
Key Insights
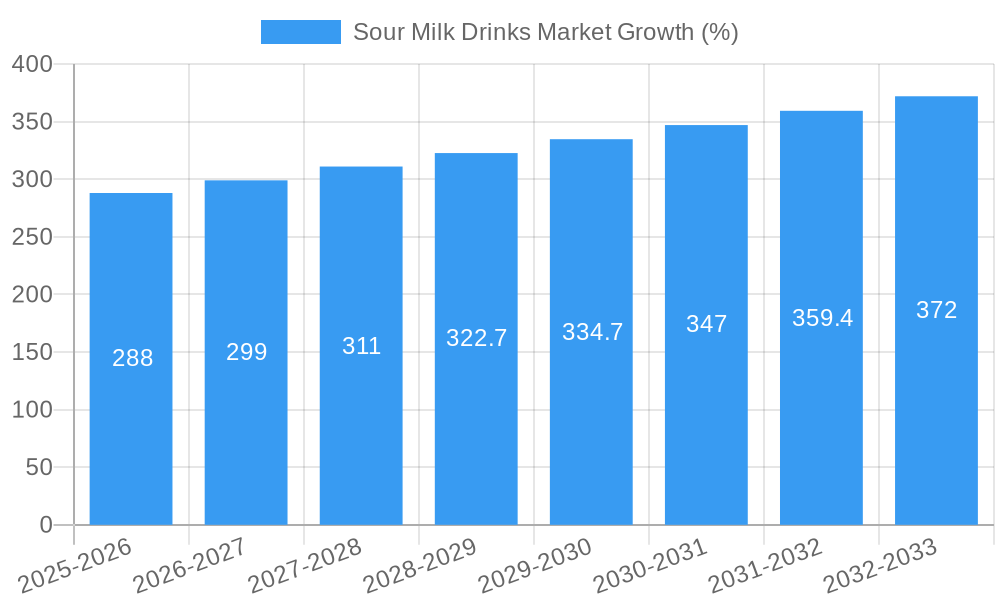
The global sour milk drinks market, valued at $7,674.4 million in 2025, is projected to experience steady growth, driven by increasing consumer awareness of the health benefits associated with fermented dairy products. This growth is fueled by the rising popularity of probiotics and their perceived role in gut health and immunity, a trend significantly impacting consumer choices in the beverage and dairy sectors. Key product segments within this market include kefir, buttermilk, sour cream, yogurt, and laban, each catering to specific consumer preferences and dietary needs. The off-trade distribution channel (supermarkets, grocery stores) currently dominates, although the on-trade sector (restaurants, cafes) is exhibiting promising growth potential as consumers seek convenient and healthy options for on-the-go consumption. Geographically, North America and Europe are currently the largest markets, though the Asia-Pacific region is expected to witness substantial growth driven by increasing disposable incomes and changing dietary habits. Competition is robust, with major players like Nestlé SA and Almarai Company vying for market share alongside regional and local brands. While price fluctuations in raw materials pose a potential restraint, the overall market outlook remains positive due to the enduring consumer demand for healthier and functional beverages.
The market's sustained growth is further influenced by product innovation, with manufacturers introducing novel flavors, functional formulations (e.g., high protein, low sugar), and convenient packaging formats to cater to evolving consumer preferences. The increasing adoption of plant-based alternatives within the dairy sector is a notable trend, although it's expected to present both opportunities and challenges. Companies are actively developing plant-based sour milk drinks to tap into the growing vegan and flexitarian consumer base. Strategic partnerships, product diversification, and effective marketing campaigns are crucial for companies to maintain a competitive edge in this dynamic market. Furthermore, the increasing focus on sustainability and ethical sourcing of raw materials is becoming a key differentiator for brands aiming to attract environmentally conscious consumers. The forecast period of 2025-2033 suggests continued expansion, with a projected CAGR of 3.44%, indicating a significant market opportunity for both established players and new entrants.

Sour Milk Drinks Market: A Comprehensive Report (2019-2033)
This in-depth report provides a comprehensive analysis of the global Sour Milk Drinks Market, offering invaluable insights for industry stakeholders, investors, and researchers. Covering the historical period (2019-2024), base year (2025), and forecast period (2025-2033), this report meticulously examines market dynamics, competitive landscapes, and future growth prospects. The market is segmented by product type (kefir, buttermilk, sour cream, yogurt, Laban), distribution channel (off-trade, on-trade), and end-use (household, foodservice, retail). The report projects a market value of xx Million by 2033, exhibiting a CAGR of xx% during the forecast period.
Sour Milk Drinks Market Structure & Competitive Dynamics
The global sour milk drinks market exhibits a moderately consolidated structure, with key players like Nestlé SA, Almarai Company, and Green Valley Farms Market and Creamery holding significant market share. However, the presence of numerous regional and local players introduces competitive intensity. Innovation within the sector focuses primarily on enhancing product quality, extending shelf life, and catering to evolving consumer preferences for healthier and functional foods. Regulatory frameworks concerning food safety and labeling significantly impact market operations, while the availability of substitute products, such as plant-based alternatives, presents a challenge. End-user trends toward convenience and premiumization drive market growth, influencing product development and distribution strategies. M&A activities within the industry remain relatively modest, with recent deals focusing primarily on expanding geographical reach and product portfolios. For instance, a recent M&A deal in the industry valued at approximately xx Million demonstrates strategic investments in this space. Market share analysis reveals that Nestlé SA holds the largest share, followed by Almarai Company and Green Valley Farms Market and Creamery.
- Market Concentration: Moderately Consolidated
- Innovation Focus: Product quality, shelf life, health benefits
- Regulatory Landscape: Stringent food safety and labeling regulations
- Substitutes: Plant-based alternatives
- End-user Trends: Convenience, premiumization
- M&A Activity: Primarily focused on geographic expansion and portfolio diversification.
Sour Milk Drinks Market Industry Trends & Insights
The global sour milk drinks market is experiencing robust growth driven by several key factors. The rising consumer preference for healthier and functional foods, coupled with increasing awareness of the probiotic benefits of sour milk drinks, fuels market expansion. Technological advancements in processing and packaging are improving product quality and shelf life, enhancing consumer appeal. Furthermore, the growing demand for convenient and on-the-go food options is driving the popularity of ready-to-drink sour milk beverages. However, fluctuating raw material prices and intense competition among established players and new entrants pose challenges to market growth. The market is projected to maintain a steady growth trajectory, driven by consumer demand and innovative product offerings. The CAGR of xx% over the forecast period reflects this positive outlook, with market penetration expected to reach xx% by 2033. Specific consumer preferences are shifting towards organic and sustainably sourced products, impacting procurement strategies for key players.
Dominant Markets & Segments in Sour Milk Drinks Market
The North American region currently dominates the global sour milk drinks market, fueled by high consumer demand for yogurt and kefir. Within product types, yogurt holds the largest market share, followed by kefir and buttermilk. The off-trade distribution channel, encompassing supermarkets, hypermarkets, and convenience stores, accounts for a significant portion of sales. Household consumption represents the largest end-use segment.
- Key Drivers of North American Dominance:
- High per capita consumption of dairy products
- Established distribution networks
- Strong consumer preference for convenience and health-conscious products
- Yogurt Segment Dominance:
- Wide product variety and availability
- Perceived health benefits and functional attributes
- High consumer acceptance and familiarity
- Off-trade Channel Dominance:
- Widespread availability in retail stores
- Convenient accessibility for consumers
- Household Consumption Dominance:
- Increasing popularity as a breakfast item and snack
- Versatile usage in various culinary applications
Sour Milk Drinks Market Product Innovations
Recent product innovations focus on enhancing taste profiles, incorporating functional ingredients (e.g., probiotics, prebiotics, added vitamins), and adopting sustainable packaging solutions. The market is witnessing the emergence of novel sour milk drinks with unique flavor combinations and textures catering to evolving consumer preferences. Technological advancements in fermentation processes and packaging technologies are improving product shelf life and quality. These innovations are creating competitive advantages by enhancing product differentiation and appealing to health-conscious consumers.
Report Segmentation & Scope
This report segments the sour milk drinks market in three key aspects:
By Product Type: Kefir, buttermilk, sour cream, yogurt, Laban. Each segment's growth is analyzed, highlighting market size and competitive dynamics. Yogurt, with its established market presence, shows strong growth potential. Kefir and Laban segments are expected to exhibit significant growth due to growing awareness of their health benefits.
By Distribution Channel: Off-trade (supermarkets, hypermarkets, convenience stores) and on-trade (restaurants, cafes, bars). Off-trade dominates, but the on-trade segment shows increasing potential as consumption shifts toward foodservice settings.
By End-Use: Household, foodservice, and retail. The household segment remains the largest but increasing demand in foodservice and retail is boosting growth.
Key Drivers of Sour Milk Drinks Market Growth
Several factors are driving the growth of the sour milk drinks market: rising health consciousness amongst consumers, increasing demand for probiotic-rich foods, and the development of convenient packaging options. Government initiatives promoting dairy consumption and technological advancements in processing and preservation also contribute to market expansion. The growing popularity of plant-based alternatives presents both a challenge and an opportunity for innovation within the sector.
Challenges in the Sour Milk Drinks Market Sector
The sour milk drinks market faces challenges such as fluctuating raw material prices, stringent regulatory compliance requirements, and intense competition. Supply chain disruptions and changing consumer preferences necessitate continuous adaptation and innovation to maintain market share. The entry of new players, especially those offering plant-based alternatives, adds further competitive pressure impacting overall market growth.
Leading Players in the Sour Milk Drinks Market Market
- Nestlé SA
- Almarai Company
- Green Valley Farms Market and Creamery
- Hiland Dairy Foods Company LLC
- Lifeway Foods Inc
- Dairy Farmers of America Inc
- Producers Dairy Foods Inc (Umpqua Dairy)
- Gujarat Co-operative Milk Marketing Federation Ltd
Key Developments in Sour Milk Drinks Market Sector
- July 2022: Gujarat Co-operative Milk Marketing Federation Ltd. invested USD 60 Million in a new dairy plant in Rajkot to expand its milk, curd, and buttermilk product lines. This significantly strengthens their market position.
- August 2021: Lifeway Foods Inc. expanded its kefir distribution into the Irish market through Tesco, increasing brand visibility and market reach.
- July 2021: Lifeway Foods Inc. expanded its kefir distribution into the French market via Costco France, marking a significant step in international expansion.
Strategic Sour Milk Drinks Market Outlook
The future of the sour milk drinks market appears bright, driven by increasing consumer demand for functional and convenient food products. Strategic opportunities exist in expanding into emerging markets, developing innovative product offerings tailored to specific consumer preferences, and adopting sustainable practices throughout the supply chain. Companies that effectively leverage these opportunities are poised for significant growth in the years to come.
Sour Milk Drinks Market Segmentation
-
1. Distribution Channel
-
1.1. Off-Trade
- 1.1.1. Convenience Stores
- 1.1.2. Online Retail
- 1.1.3. Specialist Retailers
- 1.1.4. Supermarkets and Hypermarkets
- 1.1.5. Others (Warehouse clubs, gas stations, etc.)
- 1.2. On-Trade
-
1.1. Off-Trade
Sour Milk Drinks Market Segmentation By Geography
-
1. North America
- 1.1. United States
- 1.2. Canada
- 1.3. Mexico
-
2. South America
- 2.1. Brazil
- 2.2. Argentina
- 2.3. Rest of South America
-
3. Europe
- 3.1. United Kingdom
- 3.2. Germany
- 3.3. France
- 3.4. Italy
- 3.5. Spain
- 3.6. Russia
- 3.7. Benelux
- 3.8. Nordics
- 3.9. Rest of Europe
-
4. Middle East & Africa
- 4.1. Turkey
- 4.2. Israel
- 4.3. GCC
- 4.4. North Africa
- 4.5. South Africa
- 4.6. Rest of Middle East & Africa
-
5. Asia Pacific
- 5.1. China
- 5.2. India
- 5.3. Japan
- 5.4. South Korea
- 5.5. ASEAN
- 5.6. Oceania
- 5.7. Rest of Asia Pacific

Sour Milk Drinks Market REPORT HIGHLIGHTS
| Aspects | Details |
|---|---|
| Study Period | 2019-2033 |
| Base Year | 2024 |
| Estimated Year | 2025 |
| Forecast Period | 2025-2033 |
| Historical Period | 2019-2024 |
| Growth Rate | CAGR of 3.44% from 2019-2033 |
| Segmentation |
|
Table of Contents
- 1. Introduction
- 1.1. Research Scope
- 1.2. Market Segmentation
- 1.3. Research Methodology
- 1.4. Definitions and Assumptions
- 2. Executive Summary
- 2.1. Introduction
- 3. Market Dynamics
- 3.1. Introduction
- 3.2. Market Drivers
- 3.2.1. Rising Demand for Clean Label Food & Beverage Products; Rising Demand for Dairy Products
- 3.3. Market Restrains
- 3.3.1. Presence of Preservatives in Ready Meals may Hamper the Market Growth
- 3.4. Market Trends
- 3.4.1. OTHER KEY INDUSTRY TRENDS COVERED IN THE REPORT
- 4. Market Factor Analysis
- 4.1. Porters Five Forces
- 4.2. Supply/Value Chain
- 4.3. PESTEL analysis
- 4.4. Market Entropy
- 4.5. Patent/Trademark Analysis
- 5. Global Sour Milk Drinks Market Analysis, Insights and Forecast, 2019-2031
- 5.1. Market Analysis, Insights and Forecast - by Distribution Channel
- 5.1.1. Off-Trade
- 5.1.1.1. Convenience Stores
- 5.1.1.2. Online Retail
- 5.1.1.3. Specialist Retailers
- 5.1.1.4. Supermarkets and Hypermarkets
- 5.1.1.5. Others (Warehouse clubs, gas stations, etc.)
- 5.1.2. On-Trade
- 5.1.1. Off-Trade
- 5.2. Market Analysis, Insights and Forecast - by Region
- 5.2.1. North America
- 5.2.2. South America
- 5.2.3. Europe
- 5.2.4. Middle East & Africa
- 5.2.5. Asia Pacific
- 5.1. Market Analysis, Insights and Forecast - by Distribution Channel
- 6. North America Sour Milk Drinks Market Analysis, Insights and Forecast, 2019-2031
- 6.1. Market Analysis, Insights and Forecast - by Distribution Channel
- 6.1.1. Off-Trade
- 6.1.1.1. Convenience Stores
- 6.1.1.2. Online Retail
- 6.1.1.3. Specialist Retailers
- 6.1.1.4. Supermarkets and Hypermarkets
- 6.1.1.5. Others (Warehouse clubs, gas stations, etc.)
- 6.1.2. On-Trade
- 6.1.1. Off-Trade
- 6.1. Market Analysis, Insights and Forecast - by Distribution Channel
- 7. South America Sour Milk Drinks Market Analysis, Insights and Forecast, 2019-2031
- 7.1. Market Analysis, Insights and Forecast - by Distribution Channel
- 7.1.1. Off-Trade
- 7.1.1.1. Convenience Stores
- 7.1.1.2. Online Retail
- 7.1.1.3. Specialist Retailers
- 7.1.1.4. Supermarkets and Hypermarkets
- 7.1.1.5. Others (Warehouse clubs, gas stations, etc.)
- 7.1.2. On-Trade
- 7.1.1. Off-Trade
- 7.1. Market Analysis, Insights and Forecast - by Distribution Channel
- 8. Europe Sour Milk Drinks Market Analysis, Insights and Forecast, 2019-2031
- 8.1. Market Analysis, Insights and Forecast - by Distribution Channel
- 8.1.1. Off-Trade
- 8.1.1.1. Convenience Stores
- 8.1.1.2. Online Retail
- 8.1.1.3. Specialist Retailers
- 8.1.1.4. Supermarkets and Hypermarkets
- 8.1.1.5. Others (Warehouse clubs, gas stations, etc.)
- 8.1.2. On-Trade
- 8.1.1. Off-Trade
- 8.1. Market Analysis, Insights and Forecast - by Distribution Channel
- 9. Middle East & Africa Sour Milk Drinks Market Analysis, Insights and Forecast, 2019-2031
- 9.1. Market Analysis, Insights and Forecast - by Distribution Channel
- 9.1.1. Off-Trade
- 9.1.1.1. Convenience Stores
- 9.1.1.2. Online Retail
- 9.1.1.3. Specialist Retailers
- 9.1.1.4. Supermarkets and Hypermarkets
- 9.1.1.5. Others (Warehouse clubs, gas stations, etc.)
- 9.1.2. On-Trade
- 9.1.1. Off-Trade
- 9.1. Market Analysis, Insights and Forecast - by Distribution Channel
- 10. Asia Pacific Sour Milk Drinks Market Analysis, Insights and Forecast, 2019-2031
- 10.1. Market Analysis, Insights and Forecast - by Distribution Channel
- 10.1.1. Off-Trade
- 10.1.1.1. Convenience Stores
- 10.1.1.2. Online Retail
- 10.1.1.3. Specialist Retailers
- 10.1.1.4. Supermarkets and Hypermarkets
- 10.1.1.5. Others (Warehouse clubs, gas stations, etc.)
- 10.1.2. On-Trade
- 10.1.1. Off-Trade
- 10.1. Market Analysis, Insights and Forecast - by Distribution Channel
- 11. North America Sour Milk Drinks Market Analysis, Insights and Forecast, 2019-2031
- 11.1. Market Analysis, Insights and Forecast - By Country/Sub-region
- 11.1.1 United States
- 11.1.2 Canada
- 11.1.3 Mexico
- 12. South America Sour Milk Drinks Market Analysis, Insights and Forecast, 2019-2031
- 12.1. Market Analysis, Insights and Forecast - By Country/Sub-region
- 12.1.1 Brazil
- 12.1.2 Argentina
- 12.1.3 Rest of South America
- 13. Europe Sour Milk Drinks Market Analysis, Insights and Forecast, 2019-2031
- 13.1. Market Analysis, Insights and Forecast - By Country/Sub-region
- 13.1.1 Germany
- 13.1.2 France
- 13.1.3 Italy
- 13.1.4 United Kingdom
- 13.1.5 Netherlands
- 13.1.6 Rest of Europe
- 14. Asia Pacific Sour Milk Drinks Market Analysis, Insights and Forecast, 2019-2031
- 14.1. Market Analysis, Insights and Forecast - By Country/Sub-region
- 14.1.1 China
- 14.1.2 Japan
- 14.1.3 India
- 14.1.4 South Korea
- 14.1.5 Taiwan
- 14.1.6 Australia
- 14.1.7 Rest of Asia-Pacific
- 15. Middle East & Africa Sour Milk Drinks Market Analysis, Insights and Forecast, 2019-2031
- 15.1. Market Analysis, Insights and Forecast - By Country/Sub-region
- 15.1.1 UAE
- 15.1.2 South Africa
- 15.1.3 Saudi Arabia
- 15.1.4 Rest of MEA
- 16. Competitive Analysis
- 16.1. Global Market Share Analysis 2024
- 16.2. Company Profiles
- 16.2.1 Nestlé SA
- 16.2.1.1. Overview
- 16.2.1.2. Products
- 16.2.1.3. SWOT Analysis
- 16.2.1.4. Recent Developments
- 16.2.1.5. Financials (Based on Availability)
- 16.2.2 Almarai Company
- 16.2.2.1. Overview
- 16.2.2.2. Products
- 16.2.2.3. SWOT Analysis
- 16.2.2.4. Recent Developments
- 16.2.2.5. Financials (Based on Availability)
- 16.2.3 Green Valley Farms Market and Creamery
- 16.2.3.1. Overview
- 16.2.3.2. Products
- 16.2.3.3. SWOT Analysis
- 16.2.3.4. Recent Developments
- 16.2.3.5. Financials (Based on Availability)
- 16.2.4 Hiland Dairy Foods Company LLC
- 16.2.4.1. Overview
- 16.2.4.2. Products
- 16.2.4.3. SWOT Analysis
- 16.2.4.4. Recent Developments
- 16.2.4.5. Financials (Based on Availability)
- 16.2.5 Lifeway Foods Inc
- 16.2.5.1. Overview
- 16.2.5.2. Products
- 16.2.5.3. SWOT Analysis
- 16.2.5.4. Recent Developments
- 16.2.5.5. Financials (Based on Availability)
- 16.2.6 Dairy Farmers of America Inc
- 16.2.6.1. Overview
- 16.2.6.2. Products
- 16.2.6.3. SWOT Analysis
- 16.2.6.4. Recent Developments
- 16.2.6.5. Financials (Based on Availability)
- 16.2.7 Producers Dairy Foods Inc (Umpqua Dairy
- 16.2.7.1. Overview
- 16.2.7.2. Products
- 16.2.7.3. SWOT Analysis
- 16.2.7.4. Recent Developments
- 16.2.7.5. Financials (Based on Availability)
- 16.2.8 Gujarat Co-operative Milk Marketing Federation Ltd
- 16.2.8.1. Overview
- 16.2.8.2. Products
- 16.2.8.3. SWOT Analysis
- 16.2.8.4. Recent Developments
- 16.2.8.5. Financials (Based on Availability)
- 16.2.1 Nestlé SA
List of Figures
- Figure 1: Global Sour Milk Drinks Market Revenue Breakdown (Million, %) by Region 2024 & 2032
- Figure 2: Global Sour Milk Drinks Market Volume Breakdown (Liters, %) by Region 2024 & 2032
- Figure 3: North America Sour Milk Drinks Market Revenue (Million), by Country 2024 & 2032
- Figure 4: North America Sour Milk Drinks Market Volume (Liters), by Country 2024 & 2032
- Figure 5: North America Sour Milk Drinks Market Revenue Share (%), by Country 2024 & 2032
- Figure 6: North America Sour Milk Drinks Market Volume Share (%), by Country 2024 & 2032
- Figure 7: South America Sour Milk Drinks Market Revenue (Million), by Country 2024 & 2032
- Figure 8: South America Sour Milk Drinks Market Volume (Liters), by Country 2024 & 2032
- Figure 9: South America Sour Milk Drinks Market Revenue Share (%), by Country 2024 & 2032
- Figure 10: South America Sour Milk Drinks Market Volume Share (%), by Country 2024 & 2032
- Figure 11: Europe Sour Milk Drinks Market Revenue (Million), by Country 2024 & 2032
- Figure 12: Europe Sour Milk Drinks Market Volume (Liters), by Country 2024 & 2032
- Figure 13: Europe Sour Milk Drinks Market Revenue Share (%), by Country 2024 & 2032
- Figure 14: Europe Sour Milk Drinks Market Volume Share (%), by Country 2024 & 2032
- Figure 15: Asia Pacific Sour Milk Drinks Market Revenue (Million), by Country 2024 & 2032
- Figure 16: Asia Pacific Sour Milk Drinks Market Volume (Liters), by Country 2024 & 2032
- Figure 17: Asia Pacific Sour Milk Drinks Market Revenue Share (%), by Country 2024 & 2032
- Figure 18: Asia Pacific Sour Milk Drinks Market Volume Share (%), by Country 2024 & 2032
- Figure 19: Middle East & Africa Sour Milk Drinks Market Revenue (Million), by Country 2024 & 2032
- Figure 20: Middle East & Africa Sour Milk Drinks Market Volume (Liters), by Country 2024 & 2032
- Figure 21: Middle East & Africa Sour Milk Drinks Market Revenue Share (%), by Country 2024 & 2032
- Figure 22: Middle East & Africa Sour Milk Drinks Market Volume Share (%), by Country 2024 & 2032
- Figure 23: North America Sour Milk Drinks Market Revenue (Million), by Distribution Channel 2024 & 2032
- Figure 24: North America Sour Milk Drinks Market Volume (Liters), by Distribution Channel 2024 & 2032
- Figure 25: North America Sour Milk Drinks Market Revenue Share (%), by Distribution Channel 2024 & 2032
- Figure 26: North America Sour Milk Drinks Market Volume Share (%), by Distribution Channel 2024 & 2032
- Figure 27: North America Sour Milk Drinks Market Revenue (Million), by Country 2024 & 2032
- Figure 28: North America Sour Milk Drinks Market Volume (Liters), by Country 2024 & 2032
- Figure 29: North America Sour Milk Drinks Market Revenue Share (%), by Country 2024 & 2032
- Figure 30: North America Sour Milk Drinks Market Volume Share (%), by Country 2024 & 2032
- Figure 31: South America Sour Milk Drinks Market Revenue (Million), by Distribution Channel 2024 & 2032
- Figure 32: South America Sour Milk Drinks Market Volume (Liters), by Distribution Channel 2024 & 2032
- Figure 33: South America Sour Milk Drinks Market Revenue Share (%), by Distribution Channel 2024 & 2032
- Figure 34: South America Sour Milk Drinks Market Volume Share (%), by Distribution Channel 2024 & 2032
- Figure 35: South America Sour Milk Drinks Market Revenue (Million), by Country 2024 & 2032
- Figure 36: South America Sour Milk Drinks Market Volume (Liters), by Country 2024 & 2032
- Figure 37: South America Sour Milk Drinks Market Revenue Share (%), by Country 2024 & 2032
- Figure 38: South America Sour Milk Drinks Market Volume Share (%), by Country 2024 & 2032
- Figure 39: Europe Sour Milk Drinks Market Revenue (Million), by Distribution Channel 2024 & 2032
- Figure 40: Europe Sour Milk Drinks Market Volume (Liters), by Distribution Channel 2024 & 2032
- Figure 41: Europe Sour Milk Drinks Market Revenue Share (%), by Distribution Channel 2024 & 2032
- Figure 42: Europe Sour Milk Drinks Market Volume Share (%), by Distribution Channel 2024 & 2032
- Figure 43: Europe Sour Milk Drinks Market Revenue (Million), by Country 2024 & 2032
- Figure 44: Europe Sour Milk Drinks Market Volume (Liters), by Country 2024 & 2032
- Figure 45: Europe Sour Milk Drinks Market Revenue Share (%), by Country 2024 & 2032
- Figure 46: Europe Sour Milk Drinks Market Volume Share (%), by Country 2024 & 2032
- Figure 47: Middle East & Africa Sour Milk Drinks Market Revenue (Million), by Distribution Channel 2024 & 2032
- Figure 48: Middle East & Africa Sour Milk Drinks Market Volume (Liters), by Distribution Channel 2024 & 2032
- Figure 49: Middle East & Africa Sour Milk Drinks Market Revenue Share (%), by Distribution Channel 2024 & 2032
- Figure 50: Middle East & Africa Sour Milk Drinks Market Volume Share (%), by Distribution Channel 2024 & 2032
- Figure 51: Middle East & Africa Sour Milk Drinks Market Revenue (Million), by Country 2024 & 2032
- Figure 52: Middle East & Africa Sour Milk Drinks Market Volume (Liters), by Country 2024 & 2032
- Figure 53: Middle East & Africa Sour Milk Drinks Market Revenue Share (%), by Country 2024 & 2032
- Figure 54: Middle East & Africa Sour Milk Drinks Market Volume Share (%), by Country 2024 & 2032
- Figure 55: Asia Pacific Sour Milk Drinks Market Revenue (Million), by Distribution Channel 2024 & 2032
- Figure 56: Asia Pacific Sour Milk Drinks Market Volume (Liters), by Distribution Channel 2024 & 2032
- Figure 57: Asia Pacific Sour Milk Drinks Market Revenue Share (%), by Distribution Channel 2024 & 2032
- Figure 58: Asia Pacific Sour Milk Drinks Market Volume Share (%), by Distribution Channel 2024 & 2032
- Figure 59: Asia Pacific Sour Milk Drinks Market Revenue (Million), by Country 2024 & 2032
- Figure 60: Asia Pacific Sour Milk Drinks Market Volume (Liters), by Country 2024 & 2032
- Figure 61: Asia Pacific Sour Milk Drinks Market Revenue Share (%), by Country 2024 & 2032
- Figure 62: Asia Pacific Sour Milk Drinks Market Volume Share (%), by Country 2024 & 2032
List of Tables
- Table 1: Global Sour Milk Drinks Market Revenue Million Forecast, by Region 2019 & 2032
- Table 2: Global Sour Milk Drinks Market Volume Liters Forecast, by Region 2019 & 2032
- Table 3: Global Sour Milk Drinks Market Revenue Million Forecast, by Distribution Channel 2019 & 2032
- Table 4: Global Sour Milk Drinks Market Volume Liters Forecast, by Distribution Channel 2019 & 2032
- Table 5: Global Sour Milk Drinks Market Revenue Million Forecast, by Region 2019 & 2032
- Table 6: Global Sour Milk Drinks Market Volume Liters Forecast, by Region 2019 & 2032
- Table 7: Global Sour Milk Drinks Market Revenue Million Forecast, by Country 2019 & 2032
- Table 8: Global Sour Milk Drinks Market Volume Liters Forecast, by Country 2019 & 2032
- Table 9: United States Sour Milk Drinks Market Revenue (Million) Forecast, by Application 2019 & 2032
- Table 10: United States Sour Milk Drinks Market Volume (Liters) Forecast, by Application 2019 & 2032
- Table 11: Canada Sour Milk Drinks Market Revenue (Million) Forecast, by Application 2019 & 2032
- Table 12: Canada Sour Milk Drinks Market Volume (Liters) Forecast, by Application 2019 & 2032
- Table 13: Mexico Sour Milk Drinks Market Revenue (Million) Forecast, by Application 2019 & 2032
- Table 14: Mexico Sour Milk Drinks Market Volume (Liters) Forecast, by Application 2019 & 2032
- Table 15: Global Sour Milk Drinks Market Revenue Million Forecast, by Country 2019 & 2032
- Table 16: Global Sour Milk Drinks Market Volume Liters Forecast, by Country 2019 & 2032
- Table 17: Brazil Sour Milk Drinks Market Revenue (Million) Forecast, by Application 2019 & 2032
- Table 18: Brazil Sour Milk Drinks Market Volume (Liters) Forecast, by Application 2019 & 2032
- Table 19: Argentina Sour Milk Drinks Market Revenue (Million) Forecast, by Application 2019 & 2032
- Table 20: Argentina Sour Milk Drinks Market Volume (Liters) Forecast, by Application 2019 & 2032
- Table 21: Rest of South America Sour Milk Drinks Market Revenue (Million) Forecast, by Application 2019 & 2032
- Table 22: Rest of South America Sour Milk Drinks Market Volume (Liters) Forecast, by Application 2019 & 2032
- Table 23: Global Sour Milk Drinks Market Revenue Million Forecast, by Country 2019 & 2032
- Table 24: Global Sour Milk Drinks Market Volume Liters Forecast, by Country 2019 & 2032
- Table 25: Germany Sour Milk Drinks Market Revenue (Million) Forecast, by Application 2019 & 2032
- Table 26: Germany Sour Milk Drinks Market Volume (Liters) Forecast, by Application 2019 & 2032
- Table 27: France Sour Milk Drinks Market Revenue (Million) Forecast, by Application 2019 & 2032
- Table 28: France Sour Milk Drinks Market Volume (Liters) Forecast, by Application 2019 & 2032
- Table 29: Italy Sour Milk Drinks Market Revenue (Million) Forecast, by Application 2019 & 2032
- Table 30: Italy Sour Milk Drinks Market Volume (Liters) Forecast, by Application 2019 & 2032
- Table 31: United Kingdom Sour Milk Drinks Market Revenue (Million) Forecast, by Application 2019 & 2032
- Table 32: United Kingdom Sour Milk Drinks Market Volume (Liters) Forecast, by Application 2019 & 2032
- Table 33: Netherlands Sour Milk Drinks Market Revenue (Million) Forecast, by Application 2019 & 2032
- Table 34: Netherlands Sour Milk Drinks Market Volume (Liters) Forecast, by Application 2019 & 2032
- Table 35: Rest of Europe Sour Milk Drinks Market Revenue (Million) Forecast, by Application 2019 & 2032
- Table 36: Rest of Europe Sour Milk Drinks Market Volume (Liters) Forecast, by Application 2019 & 2032
- Table 37: Global Sour Milk Drinks Market Revenue Million Forecast, by Country 2019 & 2032
- Table 38: Global Sour Milk Drinks Market Volume Liters Forecast, by Country 2019 & 2032
- Table 39: China Sour Milk Drinks Market Revenue (Million) Forecast, by Application 2019 & 2032
- Table 40: China Sour Milk Drinks Market Volume (Liters) Forecast, by Application 2019 & 2032
- Table 41: Japan Sour Milk Drinks Market Revenue (Million) Forecast, by Application 2019 & 2032
- Table 42: Japan Sour Milk Drinks Market Volume (Liters) Forecast, by Application 2019 & 2032
- Table 43: India Sour Milk Drinks Market Revenue (Million) Forecast, by Application 2019 & 2032
- Table 44: India Sour Milk Drinks Market Volume (Liters) Forecast, by Application 2019 & 2032
- Table 45: South Korea Sour Milk Drinks Market Revenue (Million) Forecast, by Application 2019 & 2032
- Table 46: South Korea Sour Milk Drinks Market Volume (Liters) Forecast, by Application 2019 & 2032
- Table 47: Taiwan Sour Milk Drinks Market Revenue (Million) Forecast, by Application 2019 & 2032
- Table 48: Taiwan Sour Milk Drinks Market Volume (Liters) Forecast, by Application 2019 & 2032
- Table 49: Australia Sour Milk Drinks Market Revenue (Million) Forecast, by Application 2019 & 2032
- Table 50: Australia Sour Milk Drinks Market Volume (Liters) Forecast, by Application 2019 & 2032
- Table 51: Rest of Asia-Pacific Sour Milk Drinks Market Revenue (Million) Forecast, by Application 2019 & 2032
- Table 52: Rest of Asia-Pacific Sour Milk Drinks Market Volume (Liters) Forecast, by Application 2019 & 2032
- Table 53: Global Sour Milk Drinks Market Revenue Million Forecast, by Country 2019 & 2032
- Table 54: Global Sour Milk Drinks Market Volume Liters Forecast, by Country 2019 & 2032
- Table 55: UAE Sour Milk Drinks Market Revenue (Million) Forecast, by Application 2019 & 2032
- Table 56: UAE Sour Milk Drinks Market Volume (Liters) Forecast, by Application 2019 & 2032
- Table 57: South Africa Sour Milk Drinks Market Revenue (Million) Forecast, by Application 2019 & 2032
- Table 58: South Africa Sour Milk Drinks Market Volume (Liters) Forecast, by Application 2019 & 2032
- Table 59: Saudi Arabia Sour Milk Drinks Market Revenue (Million) Forecast, by Application 2019 & 2032
- Table 60: Saudi Arabia Sour Milk Drinks Market Volume (Liters) Forecast, by Application 2019 & 2032
- Table 61: Rest of MEA Sour Milk Drinks Market Revenue (Million) Forecast, by Application 2019 & 2032
- Table 62: Rest of MEA Sour Milk Drinks Market Volume (Liters) Forecast, by Application 2019 & 2032
- Table 63: Global Sour Milk Drinks Market Revenue Million Forecast, by Distribution Channel 2019 & 2032
- Table 64: Global Sour Milk Drinks Market Volume Liters Forecast, by Distribution Channel 2019 & 2032
- Table 65: Global Sour Milk Drinks Market Revenue Million Forecast, by Country 2019 & 2032
- Table 66: Global Sour Milk Drinks Market Volume Liters Forecast, by Country 2019 & 2032
- Table 67: United States Sour Milk Drinks Market Revenue (Million) Forecast, by Application 2019 & 2032
- Table 68: United States Sour Milk Drinks Market Volume (Liters) Forecast, by Application 2019 & 2032
- Table 69: Canada Sour Milk Drinks Market Revenue (Million) Forecast, by Application 2019 & 2032
- Table 70: Canada Sour Milk Drinks Market Volume (Liters) Forecast, by Application 2019 & 2032
- Table 71: Mexico Sour Milk Drinks Market Revenue (Million) Forecast, by Application 2019 & 2032
- Table 72: Mexico Sour Milk Drinks Market Volume (Liters) Forecast, by Application 2019 & 2032
- Table 73: Global Sour Milk Drinks Market Revenue Million Forecast, by Distribution Channel 2019 & 2032
- Table 74: Global Sour Milk Drinks Market Volume Liters Forecast, by Distribution Channel 2019 & 2032
- Table 75: Global Sour Milk Drinks Market Revenue Million Forecast, by Country 2019 & 2032
- Table 76: Global Sour Milk Drinks Market Volume Liters Forecast, by Country 2019 & 2032
- Table 77: Brazil Sour Milk Drinks Market Revenue (Million) Forecast, by Application 2019 & 2032
- Table 78: Brazil Sour Milk Drinks Market Volume (Liters) Forecast, by Application 2019 & 2032
- Table 79: Argentina Sour Milk Drinks Market Revenue (Million) Forecast, by Application 2019 & 2032
- Table 80: Argentina Sour Milk Drinks Market Volume (Liters) Forecast, by Application 2019 & 2032
- Table 81: Rest of South America Sour Milk Drinks Market Revenue (Million) Forecast, by Application 2019 & 2032
- Table 82: Rest of South America Sour Milk Drinks Market Volume (Liters) Forecast, by Application 2019 & 2032
- Table 83: Global Sour Milk Drinks Market Revenue Million Forecast, by Distribution Channel 2019 & 2032
- Table 84: Global Sour Milk Drinks Market Volume Liters Forecast, by Distribution Channel 2019 & 2032
- Table 85: Global Sour Milk Drinks Market Revenue Million Forecast, by Country 2019 & 2032
- Table 86: Global Sour Milk Drinks Market Volume Liters Forecast, by Country 2019 & 2032
- Table 87: United Kingdom Sour Milk Drinks Market Revenue (Million) Forecast, by Application 2019 & 2032
- Table 88: United Kingdom Sour Milk Drinks Market Volume (Liters) Forecast, by Application 2019 & 2032
- Table 89: Germany Sour Milk Drinks Market Revenue (Million) Forecast, by Application 2019 & 2032
- Table 90: Germany Sour Milk Drinks Market Volume (Liters) Forecast, by Application 2019 & 2032
- Table 91: France Sour Milk Drinks Market Revenue (Million) Forecast, by Application 2019 & 2032
- Table 92: France Sour Milk Drinks Market Volume (Liters) Forecast, by Application 2019 & 2032
- Table 93: Italy Sour Milk Drinks Market Revenue (Million) Forecast, by Application 2019 & 2032
- Table 94: Italy Sour Milk Drinks Market Volume (Liters) Forecast, by Application 2019 & 2032
- Table 95: Spain Sour Milk Drinks Market Revenue (Million) Forecast, by Application 2019 & 2032
- Table 96: Spain Sour Milk Drinks Market Volume (Liters) Forecast, by Application 2019 & 2032
- Table 97: Russia Sour Milk Drinks Market Revenue (Million) Forecast, by Application 2019 & 2032
- Table 98: Russia Sour Milk Drinks Market Volume (Liters) Forecast, by Application 2019 & 2032
- Table 99: Benelux Sour Milk Drinks Market Revenue (Million) Forecast, by Application 2019 & 2032
- Table 100: Benelux Sour Milk Drinks Market Volume (Liters) Forecast, by Application 2019 & 2032
- Table 101: Nordics Sour Milk Drinks Market Revenue (Million) Forecast, by Application 2019 & 2032
- Table 102: Nordics Sour Milk Drinks Market Volume (Liters) Forecast, by Application 2019 & 2032
- Table 103: Rest of Europe Sour Milk Drinks Market Revenue (Million) Forecast, by Application 2019 & 2032
- Table 104: Rest of Europe Sour Milk Drinks Market Volume (Liters) Forecast, by Application 2019 & 2032
- Table 105: Global Sour Milk Drinks Market Revenue Million Forecast, by Distribution Channel 2019 & 2032
- Table 106: Global Sour Milk Drinks Market Volume Liters Forecast, by Distribution Channel 2019 & 2032
- Table 107: Global Sour Milk Drinks Market Revenue Million Forecast, by Country 2019 & 2032
- Table 108: Global Sour Milk Drinks Market Volume Liters Forecast, by Country 2019 & 2032
- Table 109: Turkey Sour Milk Drinks Market Revenue (Million) Forecast, by Application 2019 & 2032
- Table 110: Turkey Sour Milk Drinks Market Volume (Liters) Forecast, by Application 2019 & 2032
- Table 111: Israel Sour Milk Drinks Market Revenue (Million) Forecast, by Application 2019 & 2032
- Table 112: Israel Sour Milk Drinks Market Volume (Liters) Forecast, by Application 2019 & 2032
- Table 113: GCC Sour Milk Drinks Market Revenue (Million) Forecast, by Application 2019 & 2032
- Table 114: GCC Sour Milk Drinks Market Volume (Liters) Forecast, by Application 2019 & 2032
- Table 115: North Africa Sour Milk Drinks Market Revenue (Million) Forecast, by Application 2019 & 2032
- Table 116: North Africa Sour Milk Drinks Market Volume (Liters) Forecast, by Application 2019 & 2032
- Table 117: South Africa Sour Milk Drinks Market Revenue (Million) Forecast, by Application 2019 & 2032
- Table 118: South Africa Sour Milk Drinks Market Volume (Liters) Forecast, by Application 2019 & 2032
- Table 119: Rest of Middle East & Africa Sour Milk Drinks Market Revenue (Million) Forecast, by Application 2019 & 2032
- Table 120: Rest of Middle East & Africa Sour Milk Drinks Market Volume (Liters) Forecast, by Application 2019 & 2032
- Table 121: Global Sour Milk Drinks Market Revenue Million Forecast, by Distribution Channel 2019 & 2032
- Table 122: Global Sour Milk Drinks Market Volume Liters Forecast, by Distribution Channel 2019 & 2032
- Table 123: Global Sour Milk Drinks Market Revenue Million Forecast, by Country 2019 & 2032
- Table 124: Global Sour Milk Drinks Market Volume Liters Forecast, by Country 2019 & 2032
- Table 125: China Sour Milk Drinks Market Revenue (Million) Forecast, by Application 2019 & 2032
- Table 126: China Sour Milk Drinks Market Volume (Liters) Forecast, by Application 2019 & 2032
- Table 127: India Sour Milk Drinks Market Revenue (Million) Forecast, by Application 2019 & 2032
- Table 128: India Sour Milk Drinks Market Volume (Liters) Forecast, by Application 2019 & 2032
- Table 129: Japan Sour Milk Drinks Market Revenue (Million) Forecast, by Application 2019 & 2032
- Table 130: Japan Sour Milk Drinks Market Volume (Liters) Forecast, by Application 2019 & 2032
- Table 131: South Korea Sour Milk Drinks Market Revenue (Million) Forecast, by Application 2019 & 2032
- Table 132: South Korea Sour Milk Drinks Market Volume (Liters) Forecast, by Application 2019 & 2032
- Table 133: ASEAN Sour Milk Drinks Market Revenue (Million) Forecast, by Application 2019 & 2032
- Table 134: ASEAN Sour Milk Drinks Market Volume (Liters) Forecast, by Application 2019 & 2032
- Table 135: Oceania Sour Milk Drinks Market Revenue (Million) Forecast, by Application 2019 & 2032
- Table 136: Oceania Sour Milk Drinks Market Volume (Liters) Forecast, by Application 2019 & 2032
- Table 137: Rest of Asia Pacific Sour Milk Drinks Market Revenue (Million) Forecast, by Application 2019 & 2032
- Table 138: Rest of Asia Pacific Sour Milk Drinks Market Volume (Liters) Forecast, by Application 2019 & 2032
Frequently Asked Questions
1. What is the projected Compound Annual Growth Rate (CAGR) of the Sour Milk Drinks Market?
The projected CAGR is approximately 3.44%.
2. Which companies are prominent players in the Sour Milk Drinks Market?
Key companies in the market include Nestlé SA, Almarai Company, Green Valley Farms Market and Creamery, Hiland Dairy Foods Company LLC, Lifeway Foods Inc, Dairy Farmers of America Inc, Producers Dairy Foods Inc (Umpqua Dairy, Gujarat Co-operative Milk Marketing Federation Ltd.
3. What are the main segments of the Sour Milk Drinks Market?
The market segments include Distribution Channel.
4. Can you provide details about the market size?
The market size is estimated to be USD 7674.4 Million as of 2022.
5. What are some drivers contributing to market growth?
Rising Demand for Clean Label Food & Beverage Products; Rising Demand for Dairy Products.
6. What are the notable trends driving market growth?
OTHER KEY INDUSTRY TRENDS COVERED IN THE REPORT.
7. Are there any restraints impacting market growth?
Presence of Preservatives in Ready Meals may Hamper the Market Growth.
8. Can you provide examples of recent developments in the market?
July 2022: Gujarat Co-operative Milk Marketing Federation Ltd. announced an investment of USD 60 Million for a new dairy plant in Rajkot to expand the milk, curd, and buttermilk products segment.August 2021: Lifeway Foods Inc., a manufacturer of kefir and fermented probiotic products, expanded its kefir distribution in the Irish market with a listing at Tesco.July 2021: Lifeway Foods Inc. expanded its distribution of kefir into the French market through the retailer Costco France.
9. What pricing options are available for accessing the report?
Pricing options include single-user, multi-user, and enterprise licenses priced at USD 3800, USD 4500, and USD 5800 respectively.
10. Is the market size provided in terms of value or volume?
The market size is provided in terms of value, measured in Million and volume, measured in Liters.
11. Are there any specific market keywords associated with the report?
Yes, the market keyword associated with the report is "Sour Milk Drinks Market," which aids in identifying and referencing the specific market segment covered.
12. How do I determine which pricing option suits my needs best?
The pricing options vary based on user requirements and access needs. Individual users may opt for single-user licenses, while businesses requiring broader access may choose multi-user or enterprise licenses for cost-effective access to the report.
13. Are there any additional resources or data provided in the Sour Milk Drinks Market report?
While the report offers comprehensive insights, it's advisable to review the specific contents or supplementary materials provided to ascertain if additional resources or data are available.
14. How can I stay updated on further developments or reports in the Sour Milk Drinks Market?
To stay informed about further developments, trends, and reports in the Sour Milk Drinks Market, consider subscribing to industry newsletters, following relevant companies and organizations, or regularly checking reputable industry news sources and publications.
Methodology
Step 1 - Identification of Relevant Samples Size from Population Database


Step 2 - Approaches for Defining Global Market Size (Value, Volume* & Price*)

Note*: In applicable scenarios
Step 3 - Data Sources
Primary Research
- Web Analytics
- Survey Reports
- Research Institute
- Latest Research Reports
- Opinion Leaders
Secondary Research
- Annual Reports
- White Paper
- Latest Press Release
- Industry Association
- Paid Database
- Investor Presentations

Step 4 - Data Triangulation
Involves using different sources of information in order to increase the validity of a study
These sources are likely to be stakeholders in a program - participants, other researchers, program staff, other community members, and so on.
Then we put all data in single framework & apply various statistical tools to find out the dynamic on the market.
During the analysis stage, feedback from the stakeholder groups would be compared to determine areas of agreement as well as areas of divergence


