
Key Insights
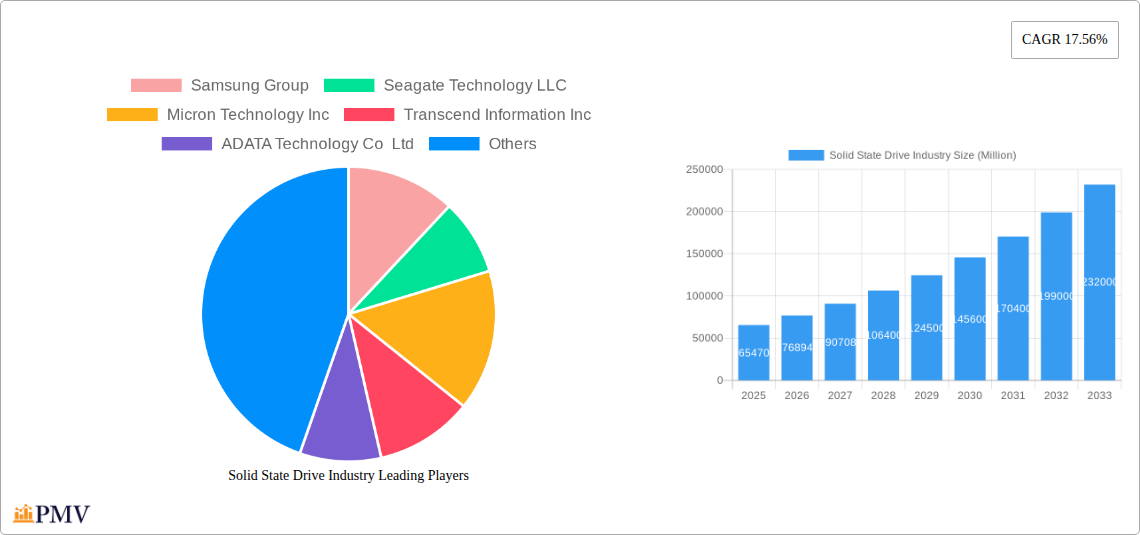
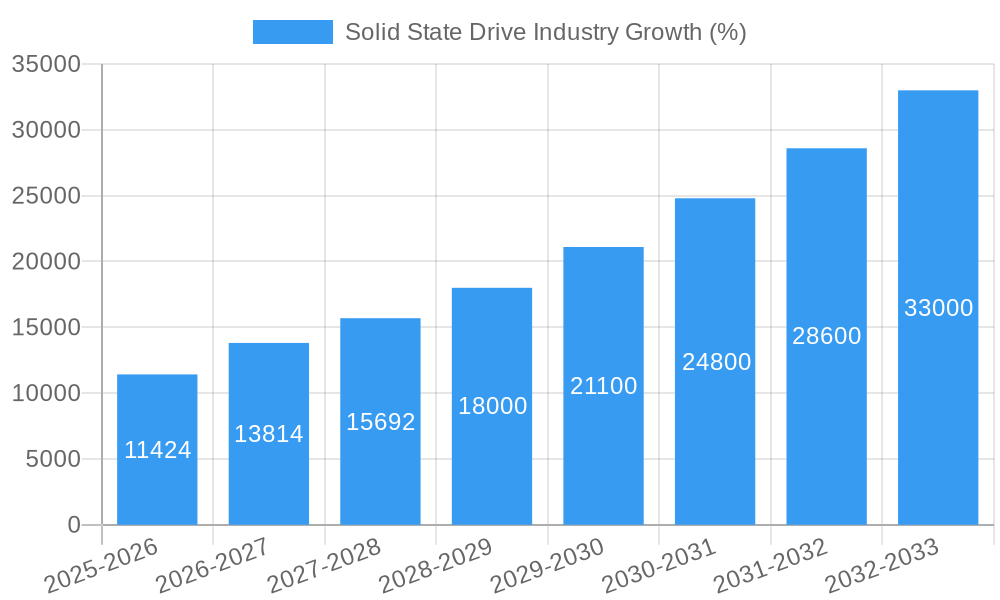
The Solid State Drive (SSD) market is experiencing robust growth, projected to reach a market size of $65.47 billion in 2025, expanding at a Compound Annual Growth Rate (CAGR) of 17.56%. This expansion is fueled by several key factors. The increasing demand for faster data storage and processing speeds across enterprise and client applications is a primary driver. Data centers, high-performance computing, and cloud infrastructure are all heavily reliant on SSDs' superior performance compared to traditional hard disk drives (HDDs). Furthermore, the continuous decline in SSD prices, coupled with advancements in technology leading to higher capacities and improved durability, makes SSDs a more cost-effective and appealing solution for a broader range of applications. The shift towards NVMe (Non-Volatile Memory Express) interfaces, offering significantly faster data transfer rates than SATA and SAS, is another crucial trend driving market expansion. However, the market faces certain restraints, including the relatively higher cost of SSDs compared to HDDs, particularly for large-capacity storage requirements, and the potential for supply chain disruptions impacting production and availability. The market segmentation reveals a significant share held by enterprise applications, driven by the need for high-speed, reliable storage in data centers. Client applications, including laptops, desktops, and gaming PCs, are also showing substantial growth fueled by consumer demand for enhanced performance.
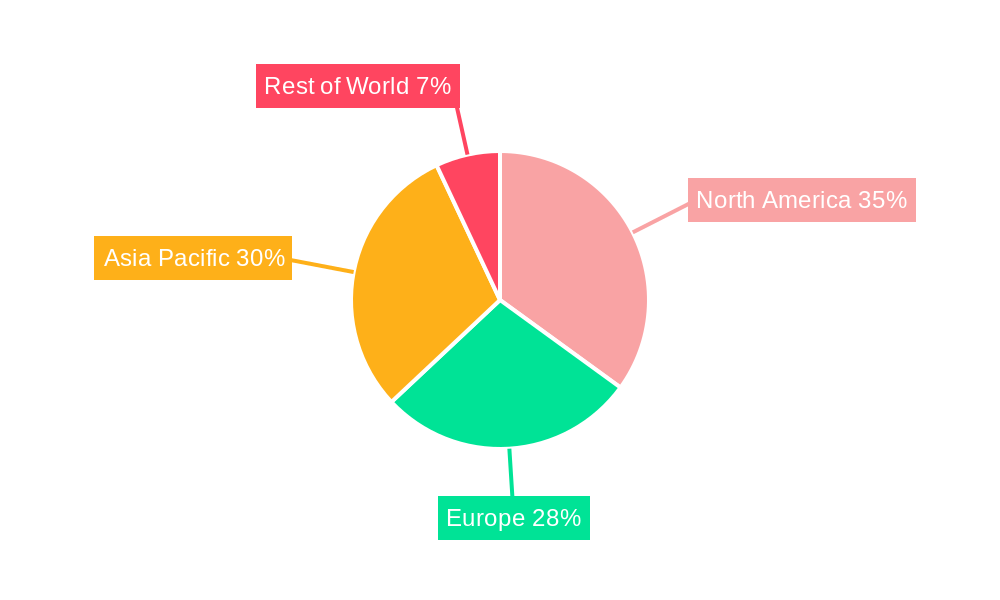
The leading players in the SSD market, including Samsung, Seagate, Micron, Western Digital, and Kingston, are strategically investing in R&D and manufacturing to maintain their market positions. Geographic analysis indicates strong growth across all regions, particularly in North America and Asia-Pacific, driven by the high adoption rates in these technologically advanced economies. However, growth in emerging markets is also expected to contribute significantly to the overall market expansion in the coming years. The forecast period (2025-2033) suggests continued robust growth, driven by the factors mentioned above. The market's trajectory indicates a substantial increase in SSD adoption across diverse sectors, transforming data storage and processing capabilities globally. The industry is likely to see further innovation in technologies like 3D NAND flash memory, further driving down costs and increasing storage capacities.
Solid State Drive (SSD) Industry Market Report: 2019-2033
This comprehensive report provides a detailed analysis of the global Solid State Drive (SSD) industry, covering market structure, competitive dynamics, technological advancements, and future growth projections from 2019 to 2033. The report leverages extensive research to deliver actionable insights for industry stakeholders, including manufacturers, investors, and technology analysts. With a focus on key players like Samsung Group, Seagate Technology LLC, Micron Technology Inc, Western Digital Corporation, and SK Hynix Inc, this report offers a granular understanding of the SSD market landscape. The study period spans from 2019 to 2033, with 2025 serving as the base and estimated year. The forecast period is 2025-2033, and the historical period is 2019-2024. Total market value projections are in Millions.
Solid State Drive Industry Market Structure & Competitive Dynamics
The global SSD market exhibits a moderately concentrated structure, with a few dominant players controlling a significant market share. Samsung Group, Western Digital Corporation, and SK Hynix Inc consistently rank among the top manufacturers, benefiting from economies of scale and established brand recognition. However, several other key players including Micron Technology Inc, Seagate Technology LLC, and Intel Corporation compete fiercely in various segments, driving innovation and price competition. The market concentration is further influenced by the availability of NAND flash memory, a critical component in SSD production.
Market share dynamics are subject to technological advancements and M&A activities. Recent years have witnessed several mergers and acquisitions, aiming to consolidate market positions and expand product portfolios. While precise M&A deal values are confidential, several transactions have exceeded xx Million, indicating significant investment in the SSD market. The regulatory landscape, while generally supportive of technological advancement, is subject to variations across regions, impacting market access and compliance costs. Product substitutes, such as traditional hard disk drives (HDDs), continue to exist, although their market share is progressively declining due to SSDs' superior performance. End-user trends, particularly the increasing demand for high-speed storage in data centers and consumer electronics, fuel market expansion.
- Market Concentration: Moderately concentrated, dominated by a few major players.
- Innovation Ecosystems: Strong R&D investment driving continuous performance improvements.
- Regulatory Frameworks: Vary across regions, impacting market access and compliance.
- Product Substitutes: HDDs, but with declining market share due to SSD superiority.
- End-User Trends: Growing demand for high-speed storage across various applications.
- M&A Activities: Significant activity with transactions exceeding xx Million in recent years.
Solid State Drive Industry Trends & Insights
The global SSD market is experiencing robust growth, driven by several key trends. The increasing adoption of cloud computing and big data analytics necessitates massive storage capacity and speed, boosting demand for high-performance SSDs. The transition from traditional HDDs to SSDs is accelerating in data centers, enterprise servers, and consumer devices due to SSDs' superior read/write speeds and durability. Technological advancements, such as the emergence of NVMe (Non-Volatile Memory Express) and PCIe (Peripheral Component Interconnect Express) interfaces, are driving the development of significantly faster and more efficient SSDs. Consumer preferences are shifting towards portable, lightweight devices, further stimulating demand for compact and high-capacity SSDs.
Competitive dynamics remain intense, with leading players engaging in price wars and product differentiation strategies. The Compound Annual Growth Rate (CAGR) for the SSD market during the forecast period (2025-2033) is projected at xx%, reflecting substantial market expansion. Market penetration of SSDs is steadily increasing across various applications, especially in the enterprise segment, surpassing xx% in 2025. These trends indicate sustained market growth, driven by technological innovation and evolving end-user demands.
Dominant Markets & Segments in Solid State Drive Industry
Leading Region/Country: North America and Asia Pacific currently dominate the SSD market, driven by substantial technological advancement, strong demand from data centers, and robust consumer electronics markets. China, in particular, is witnessing rapid growth.
Dominant Segment (By SSD Interface): PCIe SSDs are experiencing the fastest growth, due to significantly higher speeds than SATA and SAS, particularly in the enterprise and data center markets. The adoption of PCIe 5.0 and above is driving further expansion.
Dominant Segment (By Application): The enterprise segment holds a larger market share due to the high demand for high-speed storage and reliability in data centers and cloud computing infrastructure.
Key Drivers:
- North America: Strong technological advancements and substantial investments in data centers.
- Asia Pacific: Rapid growth in consumer electronics, increasing cloud adoption, and government support.
- Europe: Steady growth fueled by data center expansion and increasing adoption of SSDs in various applications.
Dominance Analysis: The dominance of PCIe interface and the enterprise segment reflects the industry's shift toward high-performance storage solutions for demanding applications. Technological advances in NAND flash memory, coupled with increased capacity and speed, fuel this trend.
Solid State Drive Industry Product Innovations
The SSD industry is witnessing continuous innovation in terms of interface technology, capacity, and performance. The emergence of PCIe 5.0 and beyond is significantly boosting data transfer speeds, while advancements in 3D NAND flash memory are leading to higher storage capacities at lower costs. New form factors are also emerging to better suit specific applications. Manufacturers are focusing on power efficiency, reliability, and data security features to enhance their competitive advantages. The innovations cater to the rising demand for high-performance, low-latency storage solutions across enterprise and consumer segments.
Report Segmentation & Scope
By SSD Interface:
SATA: The SATA interface remains a significant segment, especially in the client market, though its market share is gradually declining compared to PCIe. Growth is projected at xx% during the forecast period, reflecting continued demand in cost-sensitive applications.
SAS: The SAS interface primarily serves the enterprise segment and is projected to experience moderate growth, owing to its high reliability and stability. Growth is projected at xx% during the forecast period.
PCIe: The PCIe interface dominates the high-performance segment and is expected to experience the highest growth rate (xx%) during the forecast period, driven by the adoption of NVMe and PCIe 5.0 technologies.
By Application:
Enterprise: The enterprise segment accounts for a larger market share due to high demand for data centers. Growth is anticipated at xx% due to cloud computing adoption and growing data volumes.
Client: The client segment experiences substantial growth, driven by rising adoption of SSDs in laptops, desktops, and mobile devices. Growth is expected at xx% due to increased consumer demand for faster storage.
Key Drivers of Solid State Drive Industry Growth
Technological advancements, especially in NAND flash memory and interface technologies (NVMe and PCIe), are primary drivers of SSD market growth. The escalating demand for high-speed storage in data centers, driven by cloud computing and big data analytics, fuels significant market expansion. Furthermore, increasing consumer demand for faster and more reliable storage in laptops, desktops, and smartphones contributes to market growth. Government initiatives promoting digitalization and infrastructure development in several regions also positively impact SSD demand.
Challenges in the Solid State Drive Industry Sector
The SSD industry faces several challenges, including volatility in NAND flash memory prices, which significantly affects production costs and profitability. Supply chain disruptions can impact production volumes and delivery schedules. Intense competition among manufacturers leads to price wars and margin compression. Moreover, the need for constant innovation to stay ahead of competitors necessitates substantial R&D investment. Meeting stringent data security and reliability requirements adds to the operational complexity and cost.
Leading Players in the Solid State Drive Industry Market
- Samsung Group
- Seagate Technology LLC
- Micron Technology Inc
- Transcend Information Inc
- ADATA Technology Co Ltd
- Western Digital Corporation
- SK Hynix Inc
- Teclast Electronics Co Limite
- Kingston Technology Corporation
- Intel Corporation
Key Developments in Solid State Drive Industry Sector
- July 2022: Kioxia announces new speed levels with its enterprise NVMe SSD family using PCIe 5.0 technology, enhancing data center capabilities.
- July 2022: Innodisk releases new 2.5" SATA and M.2 SSDs for edge AI applications, emphasizing low latency and high DWPD.
- June 2022: Micron introduces the 5400 SATA SSD for critical infrastructure, leveraging 176-layer NAND technology.
- April 2022: SK Hynix and Solidigm introduce PCIe Gen 4 SSDs for data centers, utilizing 128-layer NAND flash innovation.
Strategic Solid State Drive Industry Market Outlook
The SSD market is poised for continued robust growth, driven by increasing data storage needs, technological advancements, and the ongoing shift from HDDs to SSDs. Strategic opportunities exist for manufacturers focusing on high-performance PCIe SSDs, particularly in the enterprise and data center segments. Developing innovative solutions for edge computing and AI applications presents further avenues for growth. Companies investing in R&D to enhance storage capacity, speed, and reliability will likely gain a competitive edge. The market's trajectory indicates significant potential for expansion and innovation throughout the forecast period.
Solid State Drive Industry Segmentation
-
1. SSD I
- 1.1. SATA
- 1.2. SAS
- 1.3. PCIE
-
2. Appli
- 2.1. Enterprise
- 2.2. Client
Solid State Drive Industry Segmentation By Geography
-
1. North America
- 1.1. United States
- 1.2. Canada
-
2. Europe
- 2.1. Germany
- 2.2. United Kingdom
- 2.3. France
-
3. Asia
- 3.1. China
- 3.2. Taiwan
- 3.3. South Korea
- 4. Australia and New Zealand
- 5. Latin America
- 6. Middle East and Africa
Solid State Drive Industry REPORT HIGHLIGHTS
| Aspects | Details |
|---|---|
| Study Period | 2019-2033 |
| Base Year | 2024 |
| Estimated Year | 2025 |
| Forecast Period | 2025-2033 |
| Historical Period | 2019-2024 |
| Growth Rate | CAGR of 17.56% from 2019-2033 |
| Segmentation |
|
Table of Contents
- 1. Introduction
- 1.1. Research Scope
- 1.2. Market Segmentation
- 1.3. Research Methodology
- 1.4. Definitions and Assumptions
- 2. Executive Summary
- 2.1. Introduction
- 3. Market Dynamics
- 3.1. Introduction
- 3.2. Market Drivers
- 3.2.1. 4.; Growing Adoption in Data Center Applications4.; High Demand from the High-end Cloud Segment 4.; Greater Utility of SSD over HDD in Key Verticals
- 3.3. Market Restrains
- 3.3.1. Slow Pace in Development of Applications Despite Heavy investments in R&D; Commplexities in Hardware Designing
- 3.4. Market Trends
- 3.4.1. Rising Demand from Enterprise Segment to Augment the Market Growth
- 4. Market Factor Analysis
- 4.1. Porters Five Forces
- 4.2. Supply/Value Chain
- 4.3. PESTEL analysis
- 4.4. Market Entropy
- 4.5. Patent/Trademark Analysis
- 5. Global Solid State Drive Industry Analysis, Insights and Forecast, 2019-2031
- 5.1. Market Analysis, Insights and Forecast - by SSD I
- 5.1.1. SATA
- 5.1.2. SAS
- 5.1.3. PCIE
- 5.2. Market Analysis, Insights and Forecast - by Appli
- 5.2.1. Enterprise
- 5.2.2. Client
- 5.3. Market Analysis, Insights and Forecast - by Region
- 5.3.1. North America
- 5.3.2. Europe
- 5.3.3. Asia
- 5.3.4. Australia and New Zealand
- 5.3.5. Latin America
- 5.3.6. Middle East and Africa
- 5.1. Market Analysis, Insights and Forecast - by SSD I
- 6. North America Solid State Drive Industry Analysis, Insights and Forecast, 2019-2031
- 6.1. Market Analysis, Insights and Forecast - by SSD I
- 6.1.1. SATA
- 6.1.2. SAS
- 6.1.3. PCIE
- 6.2. Market Analysis, Insights and Forecast - by Appli
- 6.2.1. Enterprise
- 6.2.2. Client
- 6.1. Market Analysis, Insights and Forecast - by SSD I
- 7. Europe Solid State Drive Industry Analysis, Insights and Forecast, 2019-2031
- 7.1. Market Analysis, Insights and Forecast - by SSD I
- 7.1.1. SATA
- 7.1.2. SAS
- 7.1.3. PCIE
- 7.2. Market Analysis, Insights and Forecast - by Appli
- 7.2.1. Enterprise
- 7.2.2. Client
- 7.1. Market Analysis, Insights and Forecast - by SSD I
- 8. Asia Solid State Drive Industry Analysis, Insights and Forecast, 2019-2031
- 8.1. Market Analysis, Insights and Forecast - by SSD I
- 8.1.1. SATA
- 8.1.2. SAS
- 8.1.3. PCIE
- 8.2. Market Analysis, Insights and Forecast - by Appli
- 8.2.1. Enterprise
- 8.2.2. Client
- 8.1. Market Analysis, Insights and Forecast - by SSD I
- 9. Australia and New Zealand Solid State Drive Industry Analysis, Insights and Forecast, 2019-2031
- 9.1. Market Analysis, Insights and Forecast - by SSD I
- 9.1.1. SATA
- 9.1.2. SAS
- 9.1.3. PCIE
- 9.2. Market Analysis, Insights and Forecast - by Appli
- 9.2.1. Enterprise
- 9.2.2. Client
- 9.1. Market Analysis, Insights and Forecast - by SSD I
- 10. Latin America Solid State Drive Industry Analysis, Insights and Forecast, 2019-2031
- 10.1. Market Analysis, Insights and Forecast - by SSD I
- 10.1.1. SATA
- 10.1.2. SAS
- 10.1.3. PCIE
- 10.2. Market Analysis, Insights and Forecast - by Appli
- 10.2.1. Enterprise
- 10.2.2. Client
- 10.1. Market Analysis, Insights and Forecast - by SSD I
- 11. Middle East and Africa Solid State Drive Industry Analysis, Insights and Forecast, 2019-2031
- 11.1. Market Analysis, Insights and Forecast - by SSD I
- 11.1.1. SATA
- 11.1.2. SAS
- 11.1.3. PCIE
- 11.2. Market Analysis, Insights and Forecast - by Appli
- 11.2.1. Enterprise
- 11.2.2. Client
- 11.1. Market Analysis, Insights and Forecast - by SSD I
- 12. North America Solid State Drive Industry Analysis, Insights and Forecast, 2019-2031
- 12.1. Market Analysis, Insights and Forecast - By Country/Sub-region
- 12.1.1 United States
- 12.1.2 Canada
- 13. Europe Solid State Drive Industry Analysis, Insights and Forecast, 2019-2031
- 13.1. Market Analysis, Insights and Forecast - By Country/Sub-region
- 13.1.1 Germany
- 13.1.2 United Kingdom
- 13.1.3 France
- 13.1.4 Rest of Europe
- 14. Asia Pacific Solid State Drive Industry Analysis, Insights and Forecast, 2019-2031
- 14.1. Market Analysis, Insights and Forecast - By Country/Sub-region
- 14.1.1 China
- 14.1.2 Taiwan
- 14.1.3 South Korea
- 14.1.4 Rest of Asia Pacific
- 15. Rest of the World Solid State Drive Industry Analysis, Insights and Forecast, 2019-2031
- 15.1. Market Analysis, Insights and Forecast - By Country/Sub-region
- 15.1.1.
- 16. Competitive Analysis
- 16.1. Global Market Share Analysis 2024
- 16.2. Company Profiles
- 16.2.1 Samsung Group
- 16.2.1.1. Overview
- 16.2.1.2. Products
- 16.2.1.3. SWOT Analysis
- 16.2.1.4. Recent Developments
- 16.2.1.5. Financials (Based on Availability)
- 16.2.2 Seagate Technology LLC
- 16.2.2.1. Overview
- 16.2.2.2. Products
- 16.2.2.3. SWOT Analysis
- 16.2.2.4. Recent Developments
- 16.2.2.5. Financials (Based on Availability)
- 16.2.3 Micron Technology Inc
- 16.2.3.1. Overview
- 16.2.3.2. Products
- 16.2.3.3. SWOT Analysis
- 16.2.3.4. Recent Developments
- 16.2.3.5. Financials (Based on Availability)
- 16.2.4 Transcend Information Inc
- 16.2.4.1. Overview
- 16.2.4.2. Products
- 16.2.4.3. SWOT Analysis
- 16.2.4.4. Recent Developments
- 16.2.4.5. Financials (Based on Availability)
- 16.2.5 ADATA Technology Co Ltd
- 16.2.5.1. Overview
- 16.2.5.2. Products
- 16.2.5.3. SWOT Analysis
- 16.2.5.4. Recent Developments
- 16.2.5.5. Financials (Based on Availability)
- 16.2.6 Western Digital Corporation
- 16.2.6.1. Overview
- 16.2.6.2. Products
- 16.2.6.3. SWOT Analysis
- 16.2.6.4. Recent Developments
- 16.2.6.5. Financials (Based on Availability)
- 16.2.7 SK Hynix Inc
- 16.2.7.1. Overview
- 16.2.7.2. Products
- 16.2.7.3. SWOT Analysis
- 16.2.7.4. Recent Developments
- 16.2.7.5. Financials (Based on Availability)
- 16.2.8 Teclast Electronics Co Limite
- 16.2.8.1. Overview
- 16.2.8.2. Products
- 16.2.8.3. SWOT Analysis
- 16.2.8.4. Recent Developments
- 16.2.8.5. Financials (Based on Availability)
- 16.2.9 Kingston Technology Corporation
- 16.2.9.1. Overview
- 16.2.9.2. Products
- 16.2.9.3. SWOT Analysis
- 16.2.9.4. Recent Developments
- 16.2.9.5. Financials (Based on Availability)
- 16.2.10 Intel Corporation
- 16.2.10.1. Overview
- 16.2.10.2. Products
- 16.2.10.3. SWOT Analysis
- 16.2.10.4. Recent Developments
- 16.2.10.5. Financials (Based on Availability)
- 16.2.1 Samsung Group
List of Figures
- Figure 1: Global Solid State Drive Industry Revenue Breakdown (Million, %) by Region 2024 & 2032
- Figure 2: North America Solid State Drive Industry Revenue (Million), by Country 2024 & 2032
- Figure 3: North America Solid State Drive Industry Revenue Share (%), by Country 2024 & 2032
- Figure 4: Europe Solid State Drive Industry Revenue (Million), by Country 2024 & 2032
- Figure 5: Europe Solid State Drive Industry Revenue Share (%), by Country 2024 & 2032
- Figure 6: Asia Pacific Solid State Drive Industry Revenue (Million), by Country 2024 & 2032
- Figure 7: Asia Pacific Solid State Drive Industry Revenue Share (%), by Country 2024 & 2032
- Figure 8: Rest of the World Solid State Drive Industry Revenue (Million), by Country 2024 & 2032
- Figure 9: Rest of the World Solid State Drive Industry Revenue Share (%), by Country 2024 & 2032
- Figure 10: North America Solid State Drive Industry Revenue (Million), by SSD I 2024 & 2032
- Figure 11: North America Solid State Drive Industry Revenue Share (%), by SSD I 2024 & 2032
- Figure 12: North America Solid State Drive Industry Revenue (Million), by Appli 2024 & 2032
- Figure 13: North America Solid State Drive Industry Revenue Share (%), by Appli 2024 & 2032
- Figure 14: North America Solid State Drive Industry Revenue (Million), by Country 2024 & 2032
- Figure 15: North America Solid State Drive Industry Revenue Share (%), by Country 2024 & 2032
- Figure 16: Europe Solid State Drive Industry Revenue (Million), by SSD I 2024 & 2032
- Figure 17: Europe Solid State Drive Industry Revenue Share (%), by SSD I 2024 & 2032
- Figure 18: Europe Solid State Drive Industry Revenue (Million), by Appli 2024 & 2032
- Figure 19: Europe Solid State Drive Industry Revenue Share (%), by Appli 2024 & 2032
- Figure 20: Europe Solid State Drive Industry Revenue (Million), by Country 2024 & 2032
- Figure 21: Europe Solid State Drive Industry Revenue Share (%), by Country 2024 & 2032
- Figure 22: Asia Solid State Drive Industry Revenue (Million), by SSD I 2024 & 2032
- Figure 23: Asia Solid State Drive Industry Revenue Share (%), by SSD I 2024 & 2032
- Figure 24: Asia Solid State Drive Industry Revenue (Million), by Appli 2024 & 2032
- Figure 25: Asia Solid State Drive Industry Revenue Share (%), by Appli 2024 & 2032
- Figure 26: Asia Solid State Drive Industry Revenue (Million), by Country 2024 & 2032
- Figure 27: Asia Solid State Drive Industry Revenue Share (%), by Country 2024 & 2032
- Figure 28: Australia and New Zealand Solid State Drive Industry Revenue (Million), by SSD I 2024 & 2032
- Figure 29: Australia and New Zealand Solid State Drive Industry Revenue Share (%), by SSD I 2024 & 2032
- Figure 30: Australia and New Zealand Solid State Drive Industry Revenue (Million), by Appli 2024 & 2032
- Figure 31: Australia and New Zealand Solid State Drive Industry Revenue Share (%), by Appli 2024 & 2032
- Figure 32: Australia and New Zealand Solid State Drive Industry Revenue (Million), by Country 2024 & 2032
- Figure 33: Australia and New Zealand Solid State Drive Industry Revenue Share (%), by Country 2024 & 2032
- Figure 34: Latin America Solid State Drive Industry Revenue (Million), by SSD I 2024 & 2032
- Figure 35: Latin America Solid State Drive Industry Revenue Share (%), by SSD I 2024 & 2032
- Figure 36: Latin America Solid State Drive Industry Revenue (Million), by Appli 2024 & 2032
- Figure 37: Latin America Solid State Drive Industry Revenue Share (%), by Appli 2024 & 2032
- Figure 38: Latin America Solid State Drive Industry Revenue (Million), by Country 2024 & 2032
- Figure 39: Latin America Solid State Drive Industry Revenue Share (%), by Country 2024 & 2032
- Figure 40: Middle East and Africa Solid State Drive Industry Revenue (Million), by SSD I 2024 & 2032
- Figure 41: Middle East and Africa Solid State Drive Industry Revenue Share (%), by SSD I 2024 & 2032
- Figure 42: Middle East and Africa Solid State Drive Industry Revenue (Million), by Appli 2024 & 2032
- Figure 43: Middle East and Africa Solid State Drive Industry Revenue Share (%), by Appli 2024 & 2032
- Figure 44: Middle East and Africa Solid State Drive Industry Revenue (Million), by Country 2024 & 2032
- Figure 45: Middle East and Africa Solid State Drive Industry Revenue Share (%), by Country 2024 & 2032
List of Tables
- Table 1: Global Solid State Drive Industry Revenue Million Forecast, by Region 2019 & 2032
- Table 2: Global Solid State Drive Industry Revenue Million Forecast, by SSD I 2019 & 2032
- Table 3: Global Solid State Drive Industry Revenue Million Forecast, by Appli 2019 & 2032
- Table 4: Global Solid State Drive Industry Revenue Million Forecast, by Region 2019 & 2032
- Table 5: Global Solid State Drive Industry Revenue Million Forecast, by Country 2019 & 2032
- Table 6: United States Solid State Drive Industry Revenue (Million) Forecast, by Application 2019 & 2032
- Table 7: Canada Solid State Drive Industry Revenue (Million) Forecast, by Application 2019 & 2032
- Table 8: Global Solid State Drive Industry Revenue Million Forecast, by Country 2019 & 2032
- Table 9: Germany Solid State Drive Industry Revenue (Million) Forecast, by Application 2019 & 2032
- Table 10: United Kingdom Solid State Drive Industry Revenue (Million) Forecast, by Application 2019 & 2032
- Table 11: France Solid State Drive Industry Revenue (Million) Forecast, by Application 2019 & 2032
- Table 12: Rest of Europe Solid State Drive Industry Revenue (Million) Forecast, by Application 2019 & 2032
- Table 13: Global Solid State Drive Industry Revenue Million Forecast, by Country 2019 & 2032
- Table 14: China Solid State Drive Industry Revenue (Million) Forecast, by Application 2019 & 2032
- Table 15: Taiwan Solid State Drive Industry Revenue (Million) Forecast, by Application 2019 & 2032
- Table 16: South Korea Solid State Drive Industry Revenue (Million) Forecast, by Application 2019 & 2032
- Table 17: Rest of Asia Pacific Solid State Drive Industry Revenue (Million) Forecast, by Application 2019 & 2032
- Table 18: Global Solid State Drive Industry Revenue Million Forecast, by Country 2019 & 2032
- Table 19: Solid State Drive Industry Revenue (Million) Forecast, by Application 2019 & 2032
- Table 20: Global Solid State Drive Industry Revenue Million Forecast, by SSD I 2019 & 2032
- Table 21: Global Solid State Drive Industry Revenue Million Forecast, by Appli 2019 & 2032
- Table 22: Global Solid State Drive Industry Revenue Million Forecast, by Country 2019 & 2032
- Table 23: United States Solid State Drive Industry Revenue (Million) Forecast, by Application 2019 & 2032
- Table 24: Canada Solid State Drive Industry Revenue (Million) Forecast, by Application 2019 & 2032
- Table 25: Global Solid State Drive Industry Revenue Million Forecast, by SSD I 2019 & 2032
- Table 26: Global Solid State Drive Industry Revenue Million Forecast, by Appli 2019 & 2032
- Table 27: Global Solid State Drive Industry Revenue Million Forecast, by Country 2019 & 2032
- Table 28: Germany Solid State Drive Industry Revenue (Million) Forecast, by Application 2019 & 2032
- Table 29: United Kingdom Solid State Drive Industry Revenue (Million) Forecast, by Application 2019 & 2032
- Table 30: France Solid State Drive Industry Revenue (Million) Forecast, by Application 2019 & 2032
- Table 31: Global Solid State Drive Industry Revenue Million Forecast, by SSD I 2019 & 2032
- Table 32: Global Solid State Drive Industry Revenue Million Forecast, by Appli 2019 & 2032
- Table 33: Global Solid State Drive Industry Revenue Million Forecast, by Country 2019 & 2032
- Table 34: China Solid State Drive Industry Revenue (Million) Forecast, by Application 2019 & 2032
- Table 35: Taiwan Solid State Drive Industry Revenue (Million) Forecast, by Application 2019 & 2032
- Table 36: South Korea Solid State Drive Industry Revenue (Million) Forecast, by Application 2019 & 2032
- Table 37: Global Solid State Drive Industry Revenue Million Forecast, by SSD I 2019 & 2032
- Table 38: Global Solid State Drive Industry Revenue Million Forecast, by Appli 2019 & 2032
- Table 39: Global Solid State Drive Industry Revenue Million Forecast, by Country 2019 & 2032
- Table 40: Global Solid State Drive Industry Revenue Million Forecast, by SSD I 2019 & 2032
- Table 41: Global Solid State Drive Industry Revenue Million Forecast, by Appli 2019 & 2032
- Table 42: Global Solid State Drive Industry Revenue Million Forecast, by Country 2019 & 2032
- Table 43: Global Solid State Drive Industry Revenue Million Forecast, by SSD I 2019 & 2032
- Table 44: Global Solid State Drive Industry Revenue Million Forecast, by Appli 2019 & 2032
- Table 45: Global Solid State Drive Industry Revenue Million Forecast, by Country 2019 & 2032
Frequently Asked Questions
1. What is the projected Compound Annual Growth Rate (CAGR) of the Solid State Drive Industry?
The projected CAGR is approximately 17.56%.
2. Which companies are prominent players in the Solid State Drive Industry?
Key companies in the market include Samsung Group, Seagate Technology LLC, Micron Technology Inc, Transcend Information Inc, ADATA Technology Co Ltd, Western Digital Corporation, SK Hynix Inc, Teclast Electronics Co Limite, Kingston Technology Corporation, Intel Corporation.
3. What are the main segments of the Solid State Drive Industry?
The market segments include SSD I, Appli.
4. Can you provide details about the market size?
The market size is estimated to be USD 65.47 Million as of 2022.
5. What are some drivers contributing to market growth?
4.; Growing Adoption in Data Center Applications4.; High Demand from the High-end Cloud Segment 4.; Greater Utility of SSD over HDD in Key Verticals.
6. What are the notable trends driving market growth?
Rising Demand from Enterprise Segment to Augment the Market Growth.
7. Are there any restraints impacting market growth?
Slow Pace in Development of Applications Despite Heavy investments in R&D; Commplexities in Hardware Designing.
8. Can you provide examples of recent developments in the market?
July 2022 - Kioxia Announces New Speed Levels with Enterprise NVMe SSD Family Designed using PCIe 5.0 Technology. The KIOXIA CM7 line series is built with PCIe 5.0 technology in E3.S and 2.5-inch Enterprise and Datacenter Standard Form Factor (EDSFF). The EDSFF E3 series allows the upcoming era of SSDs using PCIe 5.0 and above to satisfy future data center designs while supporting a wide range of new applications and devices.
9. What pricing options are available for accessing the report?
Pricing options include single-user, multi-user, and enterprise licenses priced at USD 4750, USD 5250, and USD 8750 respectively.
10. Is the market size provided in terms of value or volume?
The market size is provided in terms of value, measured in Million.
11. Are there any specific market keywords associated with the report?
Yes, the market keyword associated with the report is "Solid State Drive Industry," which aids in identifying and referencing the specific market segment covered.
12. How do I determine which pricing option suits my needs best?
The pricing options vary based on user requirements and access needs. Individual users may opt for single-user licenses, while businesses requiring broader access may choose multi-user or enterprise licenses for cost-effective access to the report.
13. Are there any additional resources or data provided in the Solid State Drive Industry report?
While the report offers comprehensive insights, it's advisable to review the specific contents or supplementary materials provided to ascertain if additional resources or data are available.
14. How can I stay updated on further developments or reports in the Solid State Drive Industry?
To stay informed about further developments, trends, and reports in the Solid State Drive Industry, consider subscribing to industry newsletters, following relevant companies and organizations, or regularly checking reputable industry news sources and publications.
Methodology
Step 1 - Identification of Relevant Samples Size from Population Database


Step 2 - Approaches for Defining Global Market Size (Value, Volume* & Price*)

Note*: In applicable scenarios
Step 3 - Data Sources
Primary Research
- Web Analytics
- Survey Reports
- Research Institute
- Latest Research Reports
- Opinion Leaders
Secondary Research
- Annual Reports
- White Paper
- Latest Press Release
- Industry Association
- Paid Database
- Investor Presentations

Step 4 - Data Triangulation
Involves using different sources of information in order to increase the validity of a study
These sources are likely to be stakeholders in a program - participants, other researchers, program staff, other community members, and so on.
Then we put all data in single framework & apply various statistical tools to find out the dynamic on the market.
During the analysis stage, feedback from the stakeholder groups would be compared to determine areas of agreement as well as areas of divergence


