
Key Insights
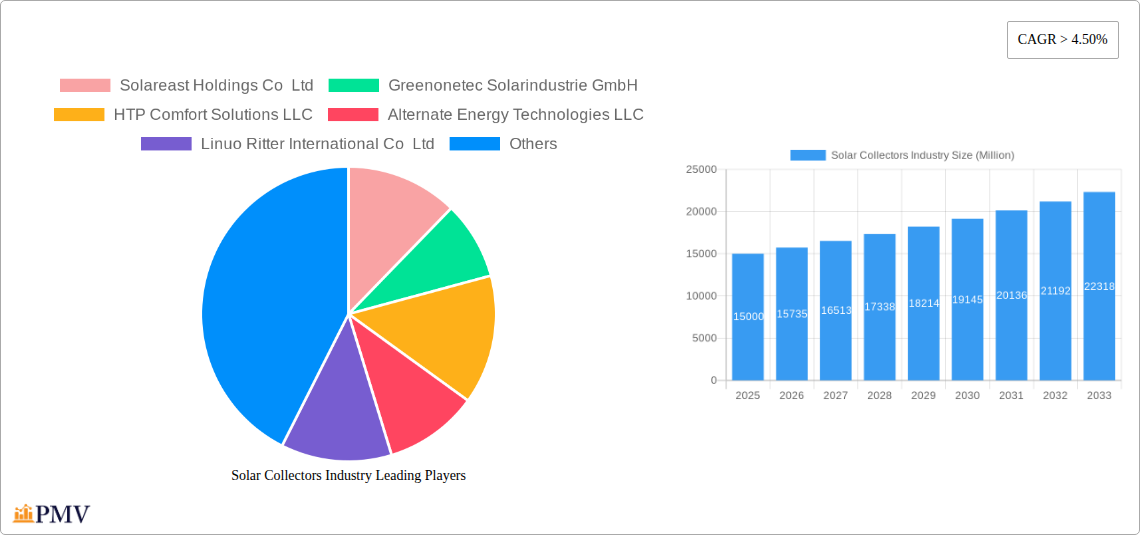
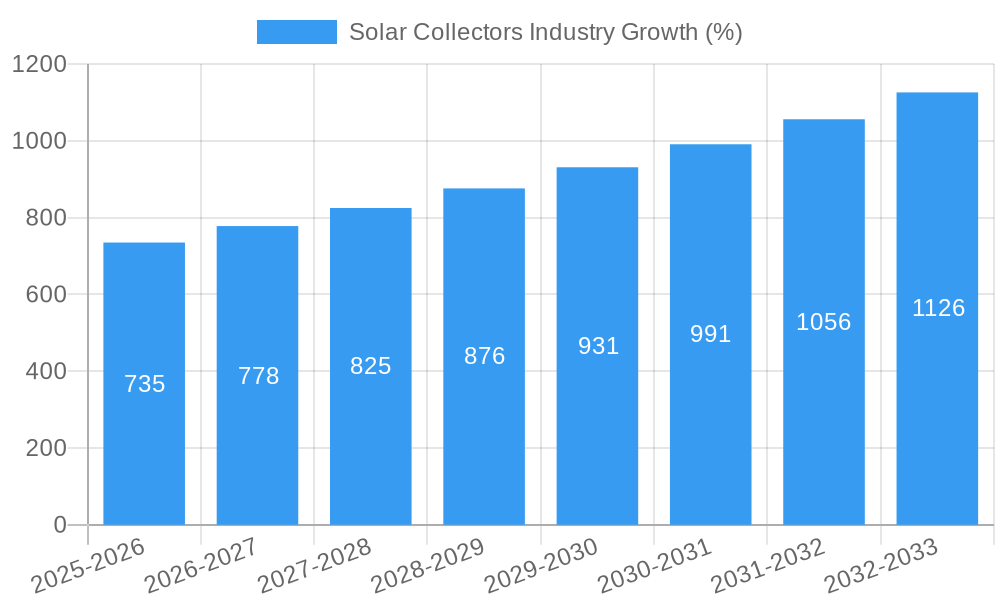
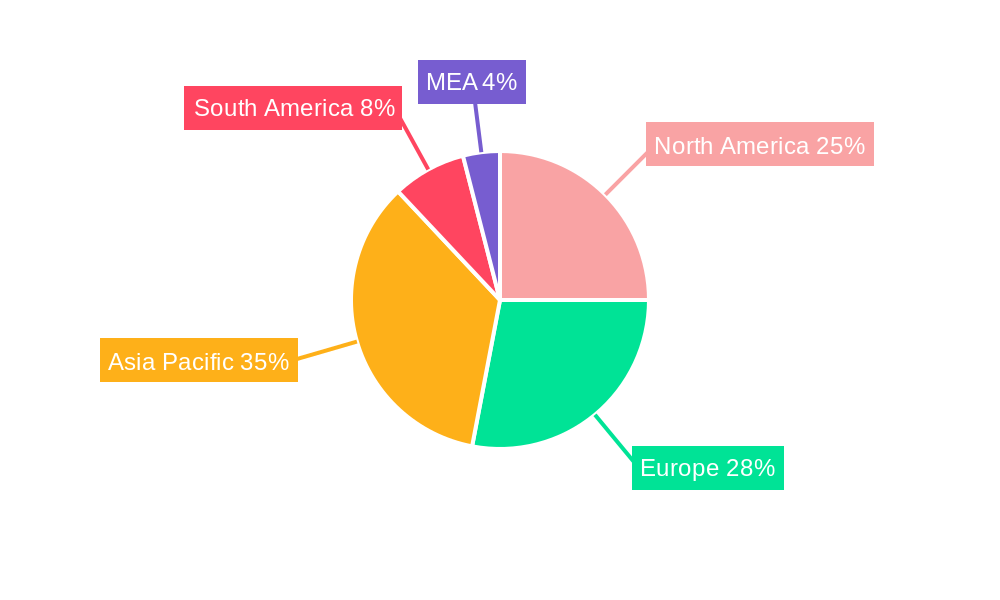
The global solar collector market is experiencing robust growth, projected to maintain a Compound Annual Growth Rate (CAGR) exceeding 4.50% from 2025 to 2033. This expansion is driven by several key factors. Increasing concerns about climate change and the urgent need for renewable energy solutions are fueling significant government investments in solar energy infrastructure and incentivizing widespread adoption. Furthermore, declining manufacturing costs and technological advancements in solar collector efficiency, particularly in glazed collector technology, are making solar thermal energy increasingly competitive with traditional energy sources. The residential sector currently holds a considerable market share, but the commercial and industrial sectors are experiencing rapid growth, driven by large-scale solar thermal installations in factories, hotels, and other commercial buildings. Geographic distribution reveals strong growth in Asia-Pacific, fueled by large-scale government initiatives and substantial energy demand in countries like China and India. North America and Europe also remain significant markets, benefiting from established renewable energy policies and strong consumer interest in sustainable solutions. However, initial high installation costs and dependence on weather conditions remain challenges that need to be addressed to further accelerate market penetration.
The segmentation of the market into glazed and unglazed collectors, alongside residential, commercial, and industrial applications, provides a granular understanding of diverse market dynamics. While glazed collectors currently dominate due to their higher efficiency, unglazed collectors are gaining traction due to their lower initial cost. The competitive landscape includes both established international players like Viessmann Manufacturing Company Inc. and Solareast Holdings Co Ltd., and regional companies focusing on specific geographical markets. Future market growth will likely be shaped by the development of more efficient and cost-effective technologies, advancements in energy storage solutions that mitigate the intermittency of solar thermal power, and the expanding adoption of solar thermal energy within smart grid initiatives. The market's success hinges on continued innovation, favorable government policies, and growing consumer awareness of the environmental and economic benefits of solar thermal energy.
This comprehensive report provides a detailed analysis of the global solar collectors industry, offering invaluable insights for stakeholders, investors, and industry professionals. With a study period spanning 2019-2033, a base year of 2025, and an estimated and forecast period of 2025-2033, this report delivers an in-depth understanding of market trends, competitive dynamics, and future growth prospects. The report covers key segments including glazed and unglazed collectors, along with residential, commercial, and industrial applications. Key players such as Solareast Holdings Co Ltd, Greenonetec Solarindustrie GmbH, HTP Comfort Solutions LLC, Alternate Energy Technologies LLC, Linuo Ritter International Co Ltd, Aalborg CSP AS, BTE solar Co Ltd, Photon Energy Systems Limited, Viessmann Manufacturing Company Inc, and Savosolar Oyj are analyzed, although the list is not exhaustive. The report projects a total market value exceeding xx Million by 2033.
Solar Collectors Industry Market Structure & Competitive Dynamics
The global solar collectors market exhibits a moderately concentrated structure, with several major players commanding significant market share. However, a vibrant ecosystem of smaller, innovative companies also contributes to market growth. The regulatory landscape varies significantly across regions, influencing adoption rates and investment decisions. Product substitution primarily comes from other renewable energy technologies, while end-user trends favor energy-efficient solutions. M&A activity in the sector has been moderate, with deal values averaging approximately xx Million in recent years. For instance, a notable acquisition in [Year] involved [Company A] acquiring [Company B] for approximately xx Million, expanding their market reach and product portfolio. Further analysis reveals:
- Market Concentration: The top 5 players hold approximately xx% of the market share.
- Innovation Ecosystems: A growing number of startups are focusing on advanced materials and improved efficiency.
- Regulatory Frameworks: Government incentives and carbon reduction targets significantly influence market growth.
- Product Substitutes: Competition comes from other renewable energy sources like wind and geothermal.
- M&A Activity: Consolidation is expected to increase as companies seek economies of scale.
Solar Collectors Industry Industry Trends & Insights
The global solar collectors market is experiencing robust growth, driven by increasing energy demand, rising energy prices, and stringent environmental regulations. The Compound Annual Growth Rate (CAGR) is projected to be xx% during the forecast period (2025-2033). Technological advancements, such as improved efficiency and durability of solar collectors, are further boosting market penetration. Consumer preferences are shifting towards sustainable and cost-effective energy solutions, leading to increased demand for solar collectors in both residential and commercial sectors. Competitive dynamics are shaped by factors such as pricing strategies, product differentiation, and technological innovation. Market penetration in the residential sector is approximately xx%, while commercial and industrial sectors show higher penetration rates due to higher initial investments and potential for large-scale installations.
Dominant Markets & Segments in Solar Collectors Industry
The European Union currently dominates the solar collector market, driven by favorable government policies, substantial investments in renewable energy infrastructure, and strong environmental awareness. Within the EU, Germany and Spain are particularly prominent. Key drivers include:
- Germany: Strong government support for renewable energy initiatives, coupled with a mature solar energy sector.
- Spain: Abundant sunshine and favorable climatic conditions make it ideal for solar energy applications.
- China: Rapid economic growth and large-scale infrastructure projects boost demand for solar collectors.
Collector Type: The glazed collector segment holds a larger market share than the unglazed collector segment due to higher efficiency.
Application: The commercial sector is the fastest-growing segment, driven by the increasing adoption of solar thermal systems in large-scale buildings and industrial facilities. Residential adoption is steady and growing consistently. The industrial segment is driven by process heat applications.
Solar Collectors Industry Product Innovations
Recent innovations in solar collectors have focused on enhancing efficiency, durability, and cost-effectiveness. Advanced materials, improved designs, and integrated smart technology are key trends. For instance, the development of evacuated tube collectors has significantly improved efficiency in low-light conditions. These advancements are broadening the market appeal of solar collectors, enhancing their competitiveness against other renewable energy technologies and traditional energy sources.
Report Segmentation & Scope
This report segments the solar collectors market by collector type (glazed and unglazed) and application (residential, commercial, and industrial). Each segment is analyzed based on its growth projections, market size, and competitive dynamics.
Glazed Collectors: This segment is expected to witness significant growth due to its higher efficiency and durability compared to unglazed collectors. The market size is projected to reach xx Million by 2033.
Unglazed Collectors: This segment offers cost-effective solutions and is suitable for specific applications. Market growth is moderate, projected at xx Million by 2033.
Residential Applications: This segment shows steady growth driven by increasing awareness of sustainable energy solutions and government incentives.
Commercial Applications: This segment is expected to experience the fastest growth due to large-scale deployments in buildings and industries.
Industrial Applications: This segment is driven by process heat applications in various industries, showing steady growth.
Key Drivers of Solar Collectors Industry Growth
Several factors drive the growth of the solar collectors industry. These include:
Government incentives and subsidies: Many countries offer financial incentives to promote the adoption of renewable energy technologies.
Falling costs of solar collectors: Technological advancements and economies of scale have significantly reduced the cost of solar collectors.
Increasing energy prices: Rising energy costs make solar collectors a more attractive and cost-effective option.
Stringent environmental regulations: Governments worldwide are implementing regulations to reduce greenhouse gas emissions, boosting the demand for renewable energy solutions.
Challenges in the Solar Collectors Industry Sector
Despite the positive growth outlook, the solar collectors industry faces several challenges:
Intermittency of solar energy: Solar collectors rely on sunlight availability, leading to variations in energy output.
High initial investment costs: The initial investment for solar collector systems can be significant, potentially hindering adoption for some customers.
Supply chain disruptions: Global supply chain issues can impact the availability and cost of solar collector components.
Leading Players in the Solar Collectors Industry Market
- Solareast Holdings Co Ltd
- Greenonetec Solarindustrie GmbH
- HTP Comfort Solutions LLC
- Alternate Energy Technologies LLC
- Linuo Ritter International Co Ltd
- Aalborg CSP AS
- BTE solar Co Ltd
- Photon Energy Systems Limited
- Viessmann Manufacturing Company Inc
- Savosolar Oyj
(List Not Exhaustive)
Key Developments in Solar Collectors Industry Sector
- July 2021: A Concentrated Solar Thermal (CST) based testing facility was established in Hyderabad, India, to enhance the testing and development of solar thermal components. This development supports the growth of India's solar energy sector and improves the overall quality and performance of solar collectors.
Strategic Solar Collectors Industry Market Outlook
The future of the solar collectors industry appears bright, driven by continued technological advancements, supportive government policies, and growing environmental consciousness. Strategic opportunities exist in developing innovative products, expanding into new markets, and forging strategic partnerships. Focus on improving efficiency, reducing costs, and enhancing the integration of solar collectors into smart grids will further accelerate market growth and create significant opportunities for industry players in the coming years.
Solar Collectors Industry Segmentation
-
1. Collector Type
- 1.1. Glazed Collector
- 1.2. Unglazed Collector
-
2. Application
- 2.1. Residential
- 2.2. Commercial
- 2.3. Industrial
Solar Collectors Industry Segmentation By Geography
- 1. North America
- 2. Europe
- 3. Asia Pacific
- 4. South America
- 5. Middle East and Africa
Solar Collectors Industry REPORT HIGHLIGHTS
| Aspects | Details |
|---|---|
| Study Period | 2019-2033 |
| Base Year | 2024 |
| Estimated Year | 2025 |
| Forecast Period | 2025-2033 |
| Historical Period | 2019-2024 |
| Growth Rate | CAGR of > 4.50% from 2019-2033 |
| Segmentation |
|
Table of Contents
- 1. Introduction
- 1.1. Research Scope
- 1.2. Market Segmentation
- 1.3. Research Methodology
- 1.4. Definitions and Assumptions
- 2. Executive Summary
- 2.1. Introduction
- 3. Market Dynamics
- 3.1. Introduction
- 3.2. Market Drivers
- 3.2.1. 4.; Demand for Clean Energy Sources4.; Supportive Government Policies
- 3.3. Market Restrains
- 3.3.1. 4.; Increasing Adoption of Other Alternative Clean Energy Sources
- 3.4. Market Trends
- 3.4.1. Residential Segment Expected to Dominate the Market
- 4. Market Factor Analysis
- 4.1. Porters Five Forces
- 4.2. Supply/Value Chain
- 4.3. PESTEL analysis
- 4.4. Market Entropy
- 4.5. Patent/Trademark Analysis
- 5. Global Solar Collectors Industry Analysis, Insights and Forecast, 2019-2031
- 5.1. Market Analysis, Insights and Forecast - by Collector Type
- 5.1.1. Glazed Collector
- 5.1.2. Unglazed Collector
- 5.2. Market Analysis, Insights and Forecast - by Application
- 5.2.1. Residential
- 5.2.2. Commercial
- 5.2.3. Industrial
- 5.3. Market Analysis, Insights and Forecast - by Region
- 5.3.1. North America
- 5.3.2. Europe
- 5.3.3. Asia Pacific
- 5.3.4. South America
- 5.3.5. Middle East and Africa
- 5.1. Market Analysis, Insights and Forecast - by Collector Type
- 6. North America Solar Collectors Industry Analysis, Insights and Forecast, 2019-2031
- 6.1. Market Analysis, Insights and Forecast - by Collector Type
- 6.1.1. Glazed Collector
- 6.1.2. Unglazed Collector
- 6.2. Market Analysis, Insights and Forecast - by Application
- 6.2.1. Residential
- 6.2.2. Commercial
- 6.2.3. Industrial
- 6.1. Market Analysis, Insights and Forecast - by Collector Type
- 7. Europe Solar Collectors Industry Analysis, Insights and Forecast, 2019-2031
- 7.1. Market Analysis, Insights and Forecast - by Collector Type
- 7.1.1. Glazed Collector
- 7.1.2. Unglazed Collector
- 7.2. Market Analysis, Insights and Forecast - by Application
- 7.2.1. Residential
- 7.2.2. Commercial
- 7.2.3. Industrial
- 7.1. Market Analysis, Insights and Forecast - by Collector Type
- 8. Asia Pacific Solar Collectors Industry Analysis, Insights and Forecast, 2019-2031
- 8.1. Market Analysis, Insights and Forecast - by Collector Type
- 8.1.1. Glazed Collector
- 8.1.2. Unglazed Collector
- 8.2. Market Analysis, Insights and Forecast - by Application
- 8.2.1. Residential
- 8.2.2. Commercial
- 8.2.3. Industrial
- 8.1. Market Analysis, Insights and Forecast - by Collector Type
- 9. South America Solar Collectors Industry Analysis, Insights and Forecast, 2019-2031
- 9.1. Market Analysis, Insights and Forecast - by Collector Type
- 9.1.1. Glazed Collector
- 9.1.2. Unglazed Collector
- 9.2. Market Analysis, Insights and Forecast - by Application
- 9.2.1. Residential
- 9.2.2. Commercial
- 9.2.3. Industrial
- 9.1. Market Analysis, Insights and Forecast - by Collector Type
- 10. Middle East and Africa Solar Collectors Industry Analysis, Insights and Forecast, 2019-2031
- 10.1. Market Analysis, Insights and Forecast - by Collector Type
- 10.1.1. Glazed Collector
- 10.1.2. Unglazed Collector
- 10.2. Market Analysis, Insights and Forecast - by Application
- 10.2.1. Residential
- 10.2.2. Commercial
- 10.2.3. Industrial
- 10.1. Market Analysis, Insights and Forecast - by Collector Type
- 11. North America Solar Collectors Industry Analysis, Insights and Forecast, 2019-2031
- 11.1. Market Analysis, Insights and Forecast - By Country/Sub-region
- 11.1.1 United States
- 11.1.2 Canada
- 11.1.3 Mexico
- 12. Europe Solar Collectors Industry Analysis, Insights and Forecast, 2019-2031
- 12.1. Market Analysis, Insights and Forecast - By Country/Sub-region
- 12.1.1 Germany
- 12.1.2 United Kingdom
- 12.1.3 France
- 12.1.4 Spain
- 12.1.5 Italy
- 12.1.6 Spain
- 12.1.7 Belgium
- 12.1.8 Netherland
- 12.1.9 Nordics
- 12.1.10 Rest of Europe
- 13. Asia Pacific Solar Collectors Industry Analysis, Insights and Forecast, 2019-2031
- 13.1. Market Analysis, Insights and Forecast - By Country/Sub-region
- 13.1.1 China
- 13.1.2 Japan
- 13.1.3 India
- 13.1.4 South Korea
- 13.1.5 Southeast Asia
- 13.1.6 Australia
- 13.1.7 Indonesia
- 13.1.8 Phillipes
- 13.1.9 Singapore
- 13.1.10 Thailandc
- 13.1.11 Rest of Asia Pacific
- 14. South America Solar Collectors Industry Analysis, Insights and Forecast, 2019-2031
- 14.1. Market Analysis, Insights and Forecast - By Country/Sub-region
- 14.1.1 Brazil
- 14.1.2 Argentina
- 14.1.3 Peru
- 14.1.4 Chile
- 14.1.5 Colombia
- 14.1.6 Ecuador
- 14.1.7 Venezuela
- 14.1.8 Rest of South America
- 15. North America Solar Collectors Industry Analysis, Insights and Forecast, 2019-2031
- 15.1. Market Analysis, Insights and Forecast - By Country/Sub-region
- 15.1.1 United States
- 15.1.2 Canada
- 15.1.3 Mexico
- 16. MEA Solar Collectors Industry Analysis, Insights and Forecast, 2019-2031
- 16.1. Market Analysis, Insights and Forecast - By Country/Sub-region
- 16.1.1 United Arab Emirates
- 16.1.2 Saudi Arabia
- 16.1.3 South Africa
- 16.1.4 Rest of Middle East and Africa
- 17. Competitive Analysis
- 17.1. Global Market Share Analysis 2024
- 17.2. Company Profiles
- 17.2.1 Solareast Holdings Co Ltd
- 17.2.1.1. Overview
- 17.2.1.2. Products
- 17.2.1.3. SWOT Analysis
- 17.2.1.4. Recent Developments
- 17.2.1.5. Financials (Based on Availability)
- 17.2.2 Greenonetec Solarindustrie GmbH
- 17.2.2.1. Overview
- 17.2.2.2. Products
- 17.2.2.3. SWOT Analysis
- 17.2.2.4. Recent Developments
- 17.2.2.5. Financials (Based on Availability)
- 17.2.3 HTP Comfort Solutions LLC
- 17.2.3.1. Overview
- 17.2.3.2. Products
- 17.2.3.3. SWOT Analysis
- 17.2.3.4. Recent Developments
- 17.2.3.5. Financials (Based on Availability)
- 17.2.4 Alternate Energy Technologies LLC
- 17.2.4.1. Overview
- 17.2.4.2. Products
- 17.2.4.3. SWOT Analysis
- 17.2.4.4. Recent Developments
- 17.2.4.5. Financials (Based on Availability)
- 17.2.5 Linuo Ritter International Co Ltd
- 17.2.5.1. Overview
- 17.2.5.2. Products
- 17.2.5.3. SWOT Analysis
- 17.2.5.4. Recent Developments
- 17.2.5.5. Financials (Based on Availability)
- 17.2.6 Aalborg CSP AS
- 17.2.6.1. Overview
- 17.2.6.2. Products
- 17.2.6.3. SWOT Analysis
- 17.2.6.4. Recent Developments
- 17.2.6.5. Financials (Based on Availability)
- 17.2.7 BTE solar Co Ltd
- 17.2.7.1. Overview
- 17.2.7.2. Products
- 17.2.7.3. SWOT Analysis
- 17.2.7.4. Recent Developments
- 17.2.7.5. Financials (Based on Availability)
- 17.2.8 Photon Energy Systems Limited
- 17.2.8.1. Overview
- 17.2.8.2. Products
- 17.2.8.3. SWOT Analysis
- 17.2.8.4. Recent Developments
- 17.2.8.5. Financials (Based on Availability)
- 17.2.9 Viessmann Manufacturing Company Inc
- 17.2.9.1. Overview
- 17.2.9.2. Products
- 17.2.9.3. SWOT Analysis
- 17.2.9.4. Recent Developments
- 17.2.9.5. Financials (Based on Availability)
- 17.2.10 Savosolar Oyj*List Not Exhaustive
- 17.2.10.1. Overview
- 17.2.10.2. Products
- 17.2.10.3. SWOT Analysis
- 17.2.10.4. Recent Developments
- 17.2.10.5. Financials (Based on Availability)
- 17.2.1 Solareast Holdings Co Ltd
List of Figures
- Figure 1: Global Solar Collectors Industry Revenue Breakdown (Million, %) by Region 2024 & 2032
- Figure 2: North America Solar Collectors Industry Revenue (Million), by Country 2024 & 2032
- Figure 3: North America Solar Collectors Industry Revenue Share (%), by Country 2024 & 2032
- Figure 4: Europe Solar Collectors Industry Revenue (Million), by Country 2024 & 2032
- Figure 5: Europe Solar Collectors Industry Revenue Share (%), by Country 2024 & 2032
- Figure 6: Asia Pacific Solar Collectors Industry Revenue (Million), by Country 2024 & 2032
- Figure 7: Asia Pacific Solar Collectors Industry Revenue Share (%), by Country 2024 & 2032
- Figure 8: South America Solar Collectors Industry Revenue (Million), by Country 2024 & 2032
- Figure 9: South America Solar Collectors Industry Revenue Share (%), by Country 2024 & 2032
- Figure 10: North America Solar Collectors Industry Revenue (Million), by Country 2024 & 2032
- Figure 11: North America Solar Collectors Industry Revenue Share (%), by Country 2024 & 2032
- Figure 12: MEA Solar Collectors Industry Revenue (Million), by Country 2024 & 2032
- Figure 13: MEA Solar Collectors Industry Revenue Share (%), by Country 2024 & 2032
- Figure 14: North America Solar Collectors Industry Revenue (Million), by Collector Type 2024 & 2032
- Figure 15: North America Solar Collectors Industry Revenue Share (%), by Collector Type 2024 & 2032
- Figure 16: North America Solar Collectors Industry Revenue (Million), by Application 2024 & 2032
- Figure 17: North America Solar Collectors Industry Revenue Share (%), by Application 2024 & 2032
- Figure 18: North America Solar Collectors Industry Revenue (Million), by Country 2024 & 2032
- Figure 19: North America Solar Collectors Industry Revenue Share (%), by Country 2024 & 2032
- Figure 20: Europe Solar Collectors Industry Revenue (Million), by Collector Type 2024 & 2032
- Figure 21: Europe Solar Collectors Industry Revenue Share (%), by Collector Type 2024 & 2032
- Figure 22: Europe Solar Collectors Industry Revenue (Million), by Application 2024 & 2032
- Figure 23: Europe Solar Collectors Industry Revenue Share (%), by Application 2024 & 2032
- Figure 24: Europe Solar Collectors Industry Revenue (Million), by Country 2024 & 2032
- Figure 25: Europe Solar Collectors Industry Revenue Share (%), by Country 2024 & 2032
- Figure 26: Asia Pacific Solar Collectors Industry Revenue (Million), by Collector Type 2024 & 2032
- Figure 27: Asia Pacific Solar Collectors Industry Revenue Share (%), by Collector Type 2024 & 2032
- Figure 28: Asia Pacific Solar Collectors Industry Revenue (Million), by Application 2024 & 2032
- Figure 29: Asia Pacific Solar Collectors Industry Revenue Share (%), by Application 2024 & 2032
- Figure 30: Asia Pacific Solar Collectors Industry Revenue (Million), by Country 2024 & 2032
- Figure 31: Asia Pacific Solar Collectors Industry Revenue Share (%), by Country 2024 & 2032
- Figure 32: South America Solar Collectors Industry Revenue (Million), by Collector Type 2024 & 2032
- Figure 33: South America Solar Collectors Industry Revenue Share (%), by Collector Type 2024 & 2032
- Figure 34: South America Solar Collectors Industry Revenue (Million), by Application 2024 & 2032
- Figure 35: South America Solar Collectors Industry Revenue Share (%), by Application 2024 & 2032
- Figure 36: South America Solar Collectors Industry Revenue (Million), by Country 2024 & 2032
- Figure 37: South America Solar Collectors Industry Revenue Share (%), by Country 2024 & 2032
- Figure 38: Middle East and Africa Solar Collectors Industry Revenue (Million), by Collector Type 2024 & 2032
- Figure 39: Middle East and Africa Solar Collectors Industry Revenue Share (%), by Collector Type 2024 & 2032
- Figure 40: Middle East and Africa Solar Collectors Industry Revenue (Million), by Application 2024 & 2032
- Figure 41: Middle East and Africa Solar Collectors Industry Revenue Share (%), by Application 2024 & 2032
- Figure 42: Middle East and Africa Solar Collectors Industry Revenue (Million), by Country 2024 & 2032
- Figure 43: Middle East and Africa Solar Collectors Industry Revenue Share (%), by Country 2024 & 2032
List of Tables
- Table 1: Global Solar Collectors Industry Revenue Million Forecast, by Region 2019 & 2032
- Table 2: Global Solar Collectors Industry Revenue Million Forecast, by Collector Type 2019 & 2032
- Table 3: Global Solar Collectors Industry Revenue Million Forecast, by Application 2019 & 2032
- Table 4: Global Solar Collectors Industry Revenue Million Forecast, by Region 2019 & 2032
- Table 5: Global Solar Collectors Industry Revenue Million Forecast, by Country 2019 & 2032
- Table 6: United States Solar Collectors Industry Revenue (Million) Forecast, by Application 2019 & 2032
- Table 7: Canada Solar Collectors Industry Revenue (Million) Forecast, by Application 2019 & 2032
- Table 8: Mexico Solar Collectors Industry Revenue (Million) Forecast, by Application 2019 & 2032
- Table 9: Global Solar Collectors Industry Revenue Million Forecast, by Country 2019 & 2032
- Table 10: Germany Solar Collectors Industry Revenue (Million) Forecast, by Application 2019 & 2032
- Table 11: United Kingdom Solar Collectors Industry Revenue (Million) Forecast, by Application 2019 & 2032
- Table 12: France Solar Collectors Industry Revenue (Million) Forecast, by Application 2019 & 2032
- Table 13: Spain Solar Collectors Industry Revenue (Million) Forecast, by Application 2019 & 2032
- Table 14: Italy Solar Collectors Industry Revenue (Million) Forecast, by Application 2019 & 2032
- Table 15: Spain Solar Collectors Industry Revenue (Million) Forecast, by Application 2019 & 2032
- Table 16: Belgium Solar Collectors Industry Revenue (Million) Forecast, by Application 2019 & 2032
- Table 17: Netherland Solar Collectors Industry Revenue (Million) Forecast, by Application 2019 & 2032
- Table 18: Nordics Solar Collectors Industry Revenue (Million) Forecast, by Application 2019 & 2032
- Table 19: Rest of Europe Solar Collectors Industry Revenue (Million) Forecast, by Application 2019 & 2032
- Table 20: Global Solar Collectors Industry Revenue Million Forecast, by Country 2019 & 2032
- Table 21: China Solar Collectors Industry Revenue (Million) Forecast, by Application 2019 & 2032
- Table 22: Japan Solar Collectors Industry Revenue (Million) Forecast, by Application 2019 & 2032
- Table 23: India Solar Collectors Industry Revenue (Million) Forecast, by Application 2019 & 2032
- Table 24: South Korea Solar Collectors Industry Revenue (Million) Forecast, by Application 2019 & 2032
- Table 25: Southeast Asia Solar Collectors Industry Revenue (Million) Forecast, by Application 2019 & 2032
- Table 26: Australia Solar Collectors Industry Revenue (Million) Forecast, by Application 2019 & 2032
- Table 27: Indonesia Solar Collectors Industry Revenue (Million) Forecast, by Application 2019 & 2032
- Table 28: Phillipes Solar Collectors Industry Revenue (Million) Forecast, by Application 2019 & 2032
- Table 29: Singapore Solar Collectors Industry Revenue (Million) Forecast, by Application 2019 & 2032
- Table 30: Thailandc Solar Collectors Industry Revenue (Million) Forecast, by Application 2019 & 2032
- Table 31: Rest of Asia Pacific Solar Collectors Industry Revenue (Million) Forecast, by Application 2019 & 2032
- Table 32: Global Solar Collectors Industry Revenue Million Forecast, by Country 2019 & 2032
- Table 33: Brazil Solar Collectors Industry Revenue (Million) Forecast, by Application 2019 & 2032
- Table 34: Argentina Solar Collectors Industry Revenue (Million) Forecast, by Application 2019 & 2032
- Table 35: Peru Solar Collectors Industry Revenue (Million) Forecast, by Application 2019 & 2032
- Table 36: Chile Solar Collectors Industry Revenue (Million) Forecast, by Application 2019 & 2032
- Table 37: Colombia Solar Collectors Industry Revenue (Million) Forecast, by Application 2019 & 2032
- Table 38: Ecuador Solar Collectors Industry Revenue (Million) Forecast, by Application 2019 & 2032
- Table 39: Venezuela Solar Collectors Industry Revenue (Million) Forecast, by Application 2019 & 2032
- Table 40: Rest of South America Solar Collectors Industry Revenue (Million) Forecast, by Application 2019 & 2032
- Table 41: Global Solar Collectors Industry Revenue Million Forecast, by Country 2019 & 2032
- Table 42: United States Solar Collectors Industry Revenue (Million) Forecast, by Application 2019 & 2032
- Table 43: Canada Solar Collectors Industry Revenue (Million) Forecast, by Application 2019 & 2032
- Table 44: Mexico Solar Collectors Industry Revenue (Million) Forecast, by Application 2019 & 2032
- Table 45: Global Solar Collectors Industry Revenue Million Forecast, by Country 2019 & 2032
- Table 46: United Arab Emirates Solar Collectors Industry Revenue (Million) Forecast, by Application 2019 & 2032
- Table 47: Saudi Arabia Solar Collectors Industry Revenue (Million) Forecast, by Application 2019 & 2032
- Table 48: South Africa Solar Collectors Industry Revenue (Million) Forecast, by Application 2019 & 2032
- Table 49: Rest of Middle East and Africa Solar Collectors Industry Revenue (Million) Forecast, by Application 2019 & 2032
- Table 50: Global Solar Collectors Industry Revenue Million Forecast, by Collector Type 2019 & 2032
- Table 51: Global Solar Collectors Industry Revenue Million Forecast, by Application 2019 & 2032
- Table 52: Global Solar Collectors Industry Revenue Million Forecast, by Country 2019 & 2032
- Table 53: Global Solar Collectors Industry Revenue Million Forecast, by Collector Type 2019 & 2032
- Table 54: Global Solar Collectors Industry Revenue Million Forecast, by Application 2019 & 2032
- Table 55: Global Solar Collectors Industry Revenue Million Forecast, by Country 2019 & 2032
- Table 56: Global Solar Collectors Industry Revenue Million Forecast, by Collector Type 2019 & 2032
- Table 57: Global Solar Collectors Industry Revenue Million Forecast, by Application 2019 & 2032
- Table 58: Global Solar Collectors Industry Revenue Million Forecast, by Country 2019 & 2032
- Table 59: Global Solar Collectors Industry Revenue Million Forecast, by Collector Type 2019 & 2032
- Table 60: Global Solar Collectors Industry Revenue Million Forecast, by Application 2019 & 2032
- Table 61: Global Solar Collectors Industry Revenue Million Forecast, by Country 2019 & 2032
- Table 62: Global Solar Collectors Industry Revenue Million Forecast, by Collector Type 2019 & 2032
- Table 63: Global Solar Collectors Industry Revenue Million Forecast, by Application 2019 & 2032
- Table 64: Global Solar Collectors Industry Revenue Million Forecast, by Country 2019 & 2032
Frequently Asked Questions
1. What is the projected Compound Annual Growth Rate (CAGR) of the Solar Collectors Industry?
The projected CAGR is approximately > 4.50%.
2. Which companies are prominent players in the Solar Collectors Industry?
Key companies in the market include Solareast Holdings Co Ltd, Greenonetec Solarindustrie GmbH, HTP Comfort Solutions LLC, Alternate Energy Technologies LLC, Linuo Ritter International Co Ltd, Aalborg CSP AS, BTE solar Co Ltd, Photon Energy Systems Limited, Viessmann Manufacturing Company Inc, Savosolar Oyj*List Not Exhaustive.
3. What are the main segments of the Solar Collectors Industry?
The market segments include Collector Type, Application.
4. Can you provide details about the market size?
The market size is estimated to be USD XX Million as of 2022.
5. What are some drivers contributing to market growth?
4.; Demand for Clean Energy Sources4.; Supportive Government Policies.
6. What are the notable trends driving market growth?
Residential Segment Expected to Dominate the Market.
7. Are there any restraints impacting market growth?
4.; Increasing Adoption of Other Alternative Clean Energy Sources.
8. Can you provide examples of recent developments in the market?
In July 2021, a Concentrated Solar Thermal (CST) based testing facility was established in Hyderabad to help India's growing solar sector to test the capabilities and performance of solar thermal components such as solar receiver tubes, heat transfer fluids, and concentrating mirrors.
9. What pricing options are available for accessing the report?
Pricing options include single-user, multi-user, and enterprise licenses priced at USD 4750, USD 5250, and USD 8750 respectively.
10. Is the market size provided in terms of value or volume?
The market size is provided in terms of value, measured in Million.
11. Are there any specific market keywords associated with the report?
Yes, the market keyword associated with the report is "Solar Collectors Industry," which aids in identifying and referencing the specific market segment covered.
12. How do I determine which pricing option suits my needs best?
The pricing options vary based on user requirements and access needs. Individual users may opt for single-user licenses, while businesses requiring broader access may choose multi-user or enterprise licenses for cost-effective access to the report.
13. Are there any additional resources or data provided in the Solar Collectors Industry report?
While the report offers comprehensive insights, it's advisable to review the specific contents or supplementary materials provided to ascertain if additional resources or data are available.
14. How can I stay updated on further developments or reports in the Solar Collectors Industry?
To stay informed about further developments, trends, and reports in the Solar Collectors Industry, consider subscribing to industry newsletters, following relevant companies and organizations, or regularly checking reputable industry news sources and publications.
Methodology
Step 1 - Identification of Relevant Samples Size from Population Database


Step 2 - Approaches for Defining Global Market Size (Value, Volume* & Price*)

Note*: In applicable scenarios
Step 3 - Data Sources
Primary Research
- Web Analytics
- Survey Reports
- Research Institute
- Latest Research Reports
- Opinion Leaders
Secondary Research
- Annual Reports
- White Paper
- Latest Press Release
- Industry Association
- Paid Database
- Investor Presentations

Step 4 - Data Triangulation
Involves using different sources of information in order to increase the validity of a study
These sources are likely to be stakeholders in a program - participants, other researchers, program staff, other community members, and so on.
Then we put all data in single framework & apply various statistical tools to find out the dynamic on the market.
During the analysis stage, feedback from the stakeholder groups would be compared to determine areas of agreement as well as areas of divergence


