
Key Insights
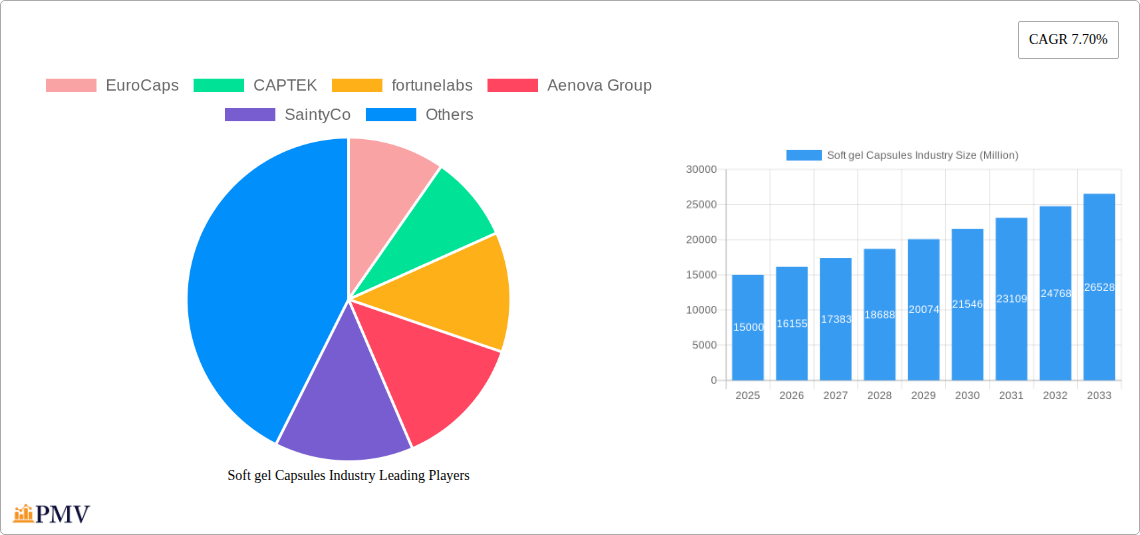
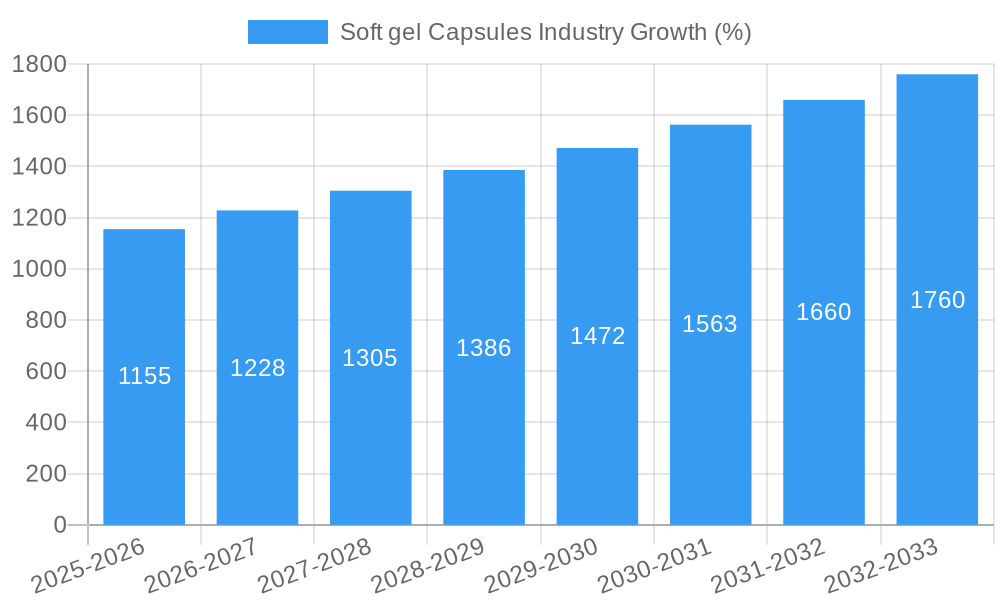
The global soft gel capsules market is experiencing robust growth, projected to reach a significant market size by 2033. Driven by increasing demand for convenient and effective drug delivery systems in the pharmaceutical and nutraceutical sectors, the market is witnessing a Compound Annual Growth Rate (CAGR) of 7.70%. This growth is fueled by several factors. The rising prevalence of chronic diseases globally necessitates innovative drug delivery solutions, and soft gel capsules offer superior bioavailability compared to traditional tablets or hard capsules. Furthermore, consumer preference for easy-to-swallow, aesthetically pleasing formulations, particularly in the nutraceutical segment (vitamins, supplements), significantly boosts demand. Technological advancements in encapsulation methods, allowing for the incorporation of various active ingredients, including oils, liquids, and powders, further contribute to market expansion. The animal-based segment currently holds a larger market share due to established use and cost-effectiveness; however, the non-animal-based segment is gaining traction fueled by growing ethical concerns and increasing demand for vegetarian/vegan options. Geographic expansion, especially in emerging economies with growing healthcare spending, presents substantial opportunities for market players.
However, the market faces certain challenges. Stringent regulatory approvals and high manufacturing costs can hinder market penetration, particularly for smaller players. Maintaining product quality and ensuring consistent bioavailability across various formulations remains a key concern. Nevertheless, the overall market outlook is positive, with opportunities for innovation and expansion in specialized applications, such as personalized medicine and targeted drug delivery. Companies such as EuroCaps, CAPTEK, and Procaps are key players leveraging their expertise and established distribution networks to capitalize on these market trends. The competitive landscape is dynamic, with ongoing innovation in capsule design and manufacturing technologies shaping the future of this thriving market.
Soft Gel Capsules Industry Market Report: 2019-2033
This comprehensive report provides a detailed analysis of the global soft gel capsules industry, covering market size, growth drivers, competitive landscape, and future outlook. The study period spans from 2019 to 2033, with 2025 serving as the base and estimated year. The forecast period extends from 2025 to 2033, while the historical period encompasses 2019-2024. The report offers actionable insights for industry stakeholders, including manufacturers, distributors, and investors. The market is segmented by type (animal-based, non-animal-based) and application (pharmaceutical, nutraceutical, other applications). Key players analyzed include EuroCaps, CAPTEK, fortunelabs, Aenova Group, SaintyCo, Procaps, Sirio Pharma, United Laboratories, Fuji Capsule Co Ltd, Soft Gel Technologies Inc, and MEDGEL. The report projects a market valued at xx Million by 2033.
Soft gel Capsules Industry Market Structure & Competitive Dynamics
The global soft gel capsules market exhibits a moderately concentrated structure, with several major players commanding significant market share. The industry's innovation ecosystem is dynamic, driven by advancements in encapsulation technologies, material science, and regulatory compliance. Stringent regulatory frameworks, particularly concerning pharmaceutical applications, significantly influence market dynamics. Product substitutes, such as tablets and hard capsules, pose competitive pressure, necessitating continuous innovation. End-user trends, primarily driven by the increasing demand for convenient and effective delivery systems for pharmaceuticals and nutraceuticals, fuel market growth.
- Market Concentration: The top five players hold approximately xx% of the market share in 2025.
- Innovation Ecosystem: Significant investments in R&D focus on improving encapsulation efficiency, enhancing bioavailability, and developing novel formulations.
- Regulatory Frameworks: Compliance with GMP (Good Manufacturing Practices) and other relevant regulations is crucial and impacts operational costs.
- Product Substitutes: Competition from alternative drug delivery systems influences pricing and market share.
- End-User Trends: Growing preference for convenient dosage forms, particularly in the nutraceutical sector, drives market expansion.
- M&A Activities: The industry has witnessed several mergers and acquisitions (M&A) deals valued at approximately xx Million in the past five years, aiming for market expansion and technological advancements. For example, a xx Million acquisition of Company X by Company Y in 2024 expanded Company Y's global footprint.
Soft gel Capsules Industry Industry Trends & Insights
The soft gel capsules market is experiencing robust growth, driven by several key factors. The increasing prevalence of chronic diseases, coupled with rising healthcare expenditure, fuels demand for pharmaceutical softgel capsules. The expanding nutraceutical sector, with its focus on health and wellness, further stimulates market growth. Technological advancements, particularly in encapsulation techniques and material science, enhance product quality and efficiency. Consumer preferences are shifting towards convenient and easy-to-swallow dosage forms, reinforcing the popularity of soft gel capsules. Competitive dynamics remain intense, with companies investing in research and development and strategic partnerships to gain a competitive edge. The Compound Annual Growth Rate (CAGR) for the period 2025-2033 is projected at xx%. Market penetration in developing economies is expected to increase significantly due to rising disposable incomes and improved healthcare infrastructure.
Dominant Markets & Segments in Soft gel Capsules Industry
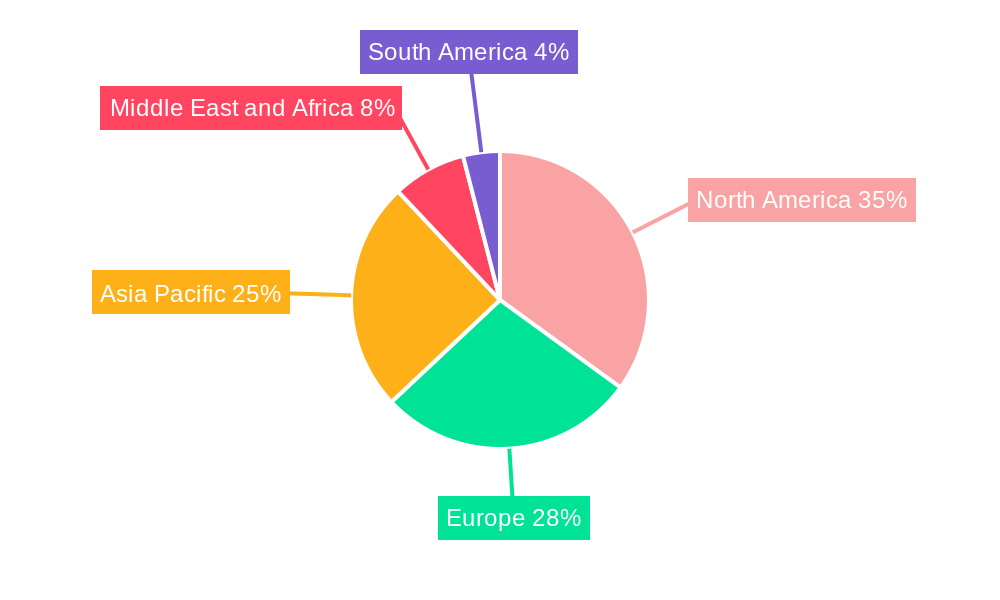
The North American region currently dominates the soft gel capsules market, followed by Europe and Asia-Pacific. Within the market segmentation:
- Type: The non-animal based segment holds a larger market share due to increasing consumer preference for vegetarian and vegan-friendly products and growing concerns regarding animal welfare and religious restrictions.
- Application: The pharmaceutical segment commands the largest share, driven by the high demand for softgel capsules in delivering various drugs efficiently. The nutraceutical segment is experiencing rapid growth due to the rising popularity of dietary supplements.
Key Drivers of Dominance:
- North America: Strong regulatory frameworks, high healthcare expenditure, and a robust pharmaceutical industry.
- Europe: High adoption of advanced encapsulation technologies and a significant presence of major industry players.
- Asia-Pacific: Rapid economic growth, rising disposable incomes, and increasing health awareness.
Soft gel Capsules Industry Product Innovations
Recent innovations in softgel capsule technology include advancements in material science, leading to improved stability, bioavailability, and controlled release formulations. The development of environmentally friendly and sustainable materials is also gaining traction. Companies are focusing on enhancing the aesthetic appeal of softgel capsules to meet consumer preferences for attractive and easy-to-consume products. This focus on innovation contributes to greater market competitiveness and expands application possibilities, particularly within niche segments.
Report Segmentation & Scope
The report segments the soft gel capsules market based on type (animal-based and non-animal-based) and application (pharmaceutical, nutraceutical, and other applications).
- Animal-based: This segment focuses on capsules utilizing gelatin derived from animal sources. The market size is projected at xx Million in 2025, with a CAGR of xx% during the forecast period. Competition in this segment is primarily based on cost and quality.
- Non-animal-based: This segment encompasses capsules utilizing vegetarian alternatives like pullulan or carrageenan. Its market size is estimated at xx Million in 2025, with a higher CAGR of xx% due to growing demand for vegetarian and vegan options. Innovation in material science is a key driver in this segment.
- Pharmaceutical Applications: This is the largest application segment, accounting for xx% of the market in 2025. Market growth is driven by the increasing need for effective drug delivery systems. Competition is intense, focused on superior bioavailability and controlled release properties.
- Nutraceutical Applications: The nutraceutical segment is experiencing significant growth with a projected market size of xx Million in 2025, driven by the increasing popularity of dietary supplements and functional foods. Innovation in flavors and functionalities are crucial competitive factors.
- Other Applications: This includes applications in cosmetics, personal care, and other specialized industries. This segment represents a smaller market share but offers niche growth opportunities.
Key Drivers of Soft gel Capsules Industry Growth
Several factors fuel the growth of the soft gel capsules industry: the rising prevalence of chronic diseases necessitates advanced drug delivery systems; increased consumer awareness of health and wellness boosts the nutraceutical sector; and technological advancements lead to improved encapsulation techniques and more bioavailable formulations. Favorable government regulations and increased investments in R&D further accelerate market expansion.
Challenges in the Soft gel Capsules Industry Sector
The soft gel capsules industry faces challenges such as stringent regulatory requirements, fluctuating raw material prices, and intense competition from alternative drug delivery systems. Supply chain disruptions and environmental concerns related to manufacturing processes also pose significant challenges. These factors can influence production costs and profitability, requiring companies to adapt to changing market dynamics.
Leading Players in the Soft gel Capsules Industry Market
- EuroCaps
- CAPTEK
- fortunelabs
- Aenova Group
- SaintyCo
- Procaps
- Sirio Pharma
- United Laboratories
- Fuji Capsule Co Ltd
- Soft Gel Technologies Inc
- MEDGEL
Key Developments in Soft gel Capsules Industry Sector
- May 2022: Windzor Pharma Ltd launched Rx Vitamin D3 product Solferol Softgel capsules in the Irish market. This launch expanded product availability and increased competition in the Vitamin D3 market.
- February 2022: ZYUS Life Sciences Inc. launched two softgel capsules, Zylem 1:20 Softgel Capsules and Zylem 5:5 Softgel Capsules in Canada. This expansion into the Canadian market broadened the company's geographic reach.
Strategic Soft gel Capsules Industry Market Outlook
The soft gel capsules market is poised for continued growth, driven by technological advancements, expanding healthcare sectors, and rising consumer demand for convenient and effective healthcare solutions. Strategic opportunities lie in developing innovative formulations, expanding into emerging markets, and focusing on sustainable manufacturing practices. Companies that successfully navigate regulatory hurdles and invest in R&D will capture significant market share.
Soft gel Capsules Industry Segmentation
-
1. Type
- 1.1. Animal Based
- 1.2. Non-animal Based
-
2. Application
- 2.1. Pharmaceutical
- 2.2. Nutraceutical
- 2.3. Other Applications
Soft gel Capsules Industry Segmentation By Geography
-
1. North America
- 1.1. United States
- 1.2. Canada
- 1.3. Mexico
-
2. Europe
- 2.1. Germany
- 2.2. United Kingdom
- 2.3. France
- 2.4. Italy
- 2.5. Spain
- 2.6. Rest of Europe
-
3. Asia Pacific
- 3.1. China
- 3.2. Japan
- 3.3. India
- 3.4. Australia
- 3.5. South Korea
- 3.6. Rest of Asia Pacific
-
4. Middle East and Africa
- 4.1. GCC
- 4.2. South Africa
- 4.3. Rest of Middle East and Africa
-
5. South America
- 5.1. Brazil
- 5.2. Argentina
- 5.3. Rest of South America
Soft gel Capsules Industry REPORT HIGHLIGHTS
| Aspects | Details |
|---|---|
| Study Period | 2019-2033 |
| Base Year | 2024 |
| Estimated Year | 2025 |
| Forecast Period | 2025-2033 |
| Historical Period | 2019-2024 |
| Growth Rate | CAGR of 7.70% from 2019-2033 |
| Segmentation |
|
Table of Contents
- 1. Introduction
- 1.1. Research Scope
- 1.2. Market Segmentation
- 1.3. Research Methodology
- 1.4. Definitions and Assumptions
- 2. Executive Summary
- 2.1. Introduction
- 3. Market Dynamics
- 3.1. Introduction
- 3.2. Market Drivers
- 3.2.1. Technological Advancements and Increasing R&D Activities; Growing Demand from Health-conscious Consumers
- 3.3. Market Restrains
- 3.3.1. Drawbacks Associated with Softgel Capsules
- 3.4. Market Trends
- 3.4.1. Pharmaceutical Segment is Expected to Hold a Significant Market Share Over the Forecast Period
- 4. Market Factor Analysis
- 4.1. Porters Five Forces
- 4.2. Supply/Value Chain
- 4.3. PESTEL analysis
- 4.4. Market Entropy
- 4.5. Patent/Trademark Analysis
- 5. Global Soft gel Capsules Industry Analysis, Insights and Forecast, 2019-2031
- 5.1. Market Analysis, Insights and Forecast - by Type
- 5.1.1. Animal Based
- 5.1.2. Non-animal Based
- 5.2. Market Analysis, Insights and Forecast - by Application
- 5.2.1. Pharmaceutical
- 5.2.2. Nutraceutical
- 5.2.3. Other Applications
- 5.3. Market Analysis, Insights and Forecast - by Region
- 5.3.1. North America
- 5.3.2. Europe
- 5.3.3. Asia Pacific
- 5.3.4. Middle East and Africa
- 5.3.5. South America
- 5.1. Market Analysis, Insights and Forecast - by Type
- 6. North America Soft gel Capsules Industry Analysis, Insights and Forecast, 2019-2031
- 6.1. Market Analysis, Insights and Forecast - by Type
- 6.1.1. Animal Based
- 6.1.2. Non-animal Based
- 6.2. Market Analysis, Insights and Forecast - by Application
- 6.2.1. Pharmaceutical
- 6.2.2. Nutraceutical
- 6.2.3. Other Applications
- 6.1. Market Analysis, Insights and Forecast - by Type
- 7. Europe Soft gel Capsules Industry Analysis, Insights and Forecast, 2019-2031
- 7.1. Market Analysis, Insights and Forecast - by Type
- 7.1.1. Animal Based
- 7.1.2. Non-animal Based
- 7.2. Market Analysis, Insights and Forecast - by Application
- 7.2.1. Pharmaceutical
- 7.2.2. Nutraceutical
- 7.2.3. Other Applications
- 7.1. Market Analysis, Insights and Forecast - by Type
- 8. Asia Pacific Soft gel Capsules Industry Analysis, Insights and Forecast, 2019-2031
- 8.1. Market Analysis, Insights and Forecast - by Type
- 8.1.1. Animal Based
- 8.1.2. Non-animal Based
- 8.2. Market Analysis, Insights and Forecast - by Application
- 8.2.1. Pharmaceutical
- 8.2.2. Nutraceutical
- 8.2.3. Other Applications
- 8.1. Market Analysis, Insights and Forecast - by Type
- 9. Middle East and Africa Soft gel Capsules Industry Analysis, Insights and Forecast, 2019-2031
- 9.1. Market Analysis, Insights and Forecast - by Type
- 9.1.1. Animal Based
- 9.1.2. Non-animal Based
- 9.2. Market Analysis, Insights and Forecast - by Application
- 9.2.1. Pharmaceutical
- 9.2.2. Nutraceutical
- 9.2.3. Other Applications
- 9.1. Market Analysis, Insights and Forecast - by Type
- 10. South America Soft gel Capsules Industry Analysis, Insights and Forecast, 2019-2031
- 10.1. Market Analysis, Insights and Forecast - by Type
- 10.1.1. Animal Based
- 10.1.2. Non-animal Based
- 10.2. Market Analysis, Insights and Forecast - by Application
- 10.2.1. Pharmaceutical
- 10.2.2. Nutraceutical
- 10.2.3. Other Applications
- 10.1. Market Analysis, Insights and Forecast - by Type
- 11. North America Soft gel Capsules Industry Analysis, Insights and Forecast, 2019-2031
- 11.1. Market Analysis, Insights and Forecast - By Country/Sub-region
- 11.1.1 United States
- 11.1.2 Canada
- 11.1.3 Mexico
- 12. Europe Soft gel Capsules Industry Analysis, Insights and Forecast, 2019-2031
- 12.1. Market Analysis, Insights and Forecast - By Country/Sub-region
- 12.1.1 Germany
- 12.1.2 United Kingdom
- 12.1.3 France
- 12.1.4 Italy
- 12.1.5 Spain
- 12.1.6 Rest of Europe
- 13. Asia Pacific Soft gel Capsules Industry Analysis, Insights and Forecast, 2019-2031
- 13.1. Market Analysis, Insights and Forecast - By Country/Sub-region
- 13.1.1 China
- 13.1.2 Japan
- 13.1.3 India
- 13.1.4 Australia
- 13.1.5 South Korea
- 13.1.6 Rest of Asia Pacific
- 14. Middle East and Africa Soft gel Capsules Industry Analysis, Insights and Forecast, 2019-2031
- 14.1. Market Analysis, Insights and Forecast - By Country/Sub-region
- 14.1.1 GCC
- 14.1.2 South Africa
- 14.1.3 Rest of Middle East and Africa
- 15. South America Soft gel Capsules Industry Analysis, Insights and Forecast, 2019-2031
- 15.1. Market Analysis, Insights and Forecast - By Country/Sub-region
- 15.1.1 Brazil
- 15.1.2 Argentina
- 15.1.3 Rest of South America
- 16. Competitive Analysis
- 16.1. Global Market Share Analysis 2024
- 16.2. Company Profiles
- 16.2.1 EuroCaps
- 16.2.1.1. Overview
- 16.2.1.2. Products
- 16.2.1.3. SWOT Analysis
- 16.2.1.4. Recent Developments
- 16.2.1.5. Financials (Based on Availability)
- 16.2.2 CAPTEK
- 16.2.2.1. Overview
- 16.2.2.2. Products
- 16.2.2.3. SWOT Analysis
- 16.2.2.4. Recent Developments
- 16.2.2.5. Financials (Based on Availability)
- 16.2.3 fortunelabs
- 16.2.3.1. Overview
- 16.2.3.2. Products
- 16.2.3.3. SWOT Analysis
- 16.2.3.4. Recent Developments
- 16.2.3.5. Financials (Based on Availability)
- 16.2.4 Aenova Group
- 16.2.4.1. Overview
- 16.2.4.2. Products
- 16.2.4.3. SWOT Analysis
- 16.2.4.4. Recent Developments
- 16.2.4.5. Financials (Based on Availability)
- 16.2.5 SaintyCo
- 16.2.5.1. Overview
- 16.2.5.2. Products
- 16.2.5.3. SWOT Analysis
- 16.2.5.4. Recent Developments
- 16.2.5.5. Financials (Based on Availability)
- 16.2.6 Procaps
- 16.2.6.1. Overview
- 16.2.6.2. Products
- 16.2.6.3. SWOT Analysis
- 16.2.6.4. Recent Developments
- 16.2.6.5. Financials (Based on Availability)
- 16.2.7 Sirio Pharma
- 16.2.7.1. Overview
- 16.2.7.2. Products
- 16.2.7.3. SWOT Analysis
- 16.2.7.4. Recent Developments
- 16.2.7.5. Financials (Based on Availability)
- 16.2.8 United Laboratories
- 16.2.8.1. Overview
- 16.2.8.2. Products
- 16.2.8.3. SWOT Analysis
- 16.2.8.4. Recent Developments
- 16.2.8.5. Financials (Based on Availability)
- 16.2.9 Fuji Capsule Co Ltd
- 16.2.9.1. Overview
- 16.2.9.2. Products
- 16.2.9.3. SWOT Analysis
- 16.2.9.4. Recent Developments
- 16.2.9.5. Financials (Based on Availability)
- 16.2.10 Soft Gel Technologies Inc
- 16.2.10.1. Overview
- 16.2.10.2. Products
- 16.2.10.3. SWOT Analysis
- 16.2.10.4. Recent Developments
- 16.2.10.5. Financials (Based on Availability)
- 16.2.11 MEDGEL
- 16.2.11.1. Overview
- 16.2.11.2. Products
- 16.2.11.3. SWOT Analysis
- 16.2.11.4. Recent Developments
- 16.2.11.5. Financials (Based on Availability)
- 16.2.1 EuroCaps
List of Figures
- Figure 1: Global Soft gel Capsules Industry Revenue Breakdown (Million, %) by Region 2024 & 2032
- Figure 2: Global Soft gel Capsules Industry Volume Breakdown (K Unit, %) by Region 2024 & 2032
- Figure 3: North America Soft gel Capsules Industry Revenue (Million), by Country 2024 & 2032
- Figure 4: North America Soft gel Capsules Industry Volume (K Unit), by Country 2024 & 2032
- Figure 5: North America Soft gel Capsules Industry Revenue Share (%), by Country 2024 & 2032
- Figure 6: North America Soft gel Capsules Industry Volume Share (%), by Country 2024 & 2032
- Figure 7: Europe Soft gel Capsules Industry Revenue (Million), by Country 2024 & 2032
- Figure 8: Europe Soft gel Capsules Industry Volume (K Unit), by Country 2024 & 2032
- Figure 9: Europe Soft gel Capsules Industry Revenue Share (%), by Country 2024 & 2032
- Figure 10: Europe Soft gel Capsules Industry Volume Share (%), by Country 2024 & 2032
- Figure 11: Asia Pacific Soft gel Capsules Industry Revenue (Million), by Country 2024 & 2032
- Figure 12: Asia Pacific Soft gel Capsules Industry Volume (K Unit), by Country 2024 & 2032
- Figure 13: Asia Pacific Soft gel Capsules Industry Revenue Share (%), by Country 2024 & 2032
- Figure 14: Asia Pacific Soft gel Capsules Industry Volume Share (%), by Country 2024 & 2032
- Figure 15: Middle East and Africa Soft gel Capsules Industry Revenue (Million), by Country 2024 & 2032
- Figure 16: Middle East and Africa Soft gel Capsules Industry Volume (K Unit), by Country 2024 & 2032
- Figure 17: Middle East and Africa Soft gel Capsules Industry Revenue Share (%), by Country 2024 & 2032
- Figure 18: Middle East and Africa Soft gel Capsules Industry Volume Share (%), by Country 2024 & 2032
- Figure 19: South America Soft gel Capsules Industry Revenue (Million), by Country 2024 & 2032
- Figure 20: South America Soft gel Capsules Industry Volume (K Unit), by Country 2024 & 2032
- Figure 21: South America Soft gel Capsules Industry Revenue Share (%), by Country 2024 & 2032
- Figure 22: South America Soft gel Capsules Industry Volume Share (%), by Country 2024 & 2032
- Figure 23: North America Soft gel Capsules Industry Revenue (Million), by Type 2024 & 2032
- Figure 24: North America Soft gel Capsules Industry Volume (K Unit), by Type 2024 & 2032
- Figure 25: North America Soft gel Capsules Industry Revenue Share (%), by Type 2024 & 2032
- Figure 26: North America Soft gel Capsules Industry Volume Share (%), by Type 2024 & 2032
- Figure 27: North America Soft gel Capsules Industry Revenue (Million), by Application 2024 & 2032
- Figure 28: North America Soft gel Capsules Industry Volume (K Unit), by Application 2024 & 2032
- Figure 29: North America Soft gel Capsules Industry Revenue Share (%), by Application 2024 & 2032
- Figure 30: North America Soft gel Capsules Industry Volume Share (%), by Application 2024 & 2032
- Figure 31: North America Soft gel Capsules Industry Revenue (Million), by Country 2024 & 2032
- Figure 32: North America Soft gel Capsules Industry Volume (K Unit), by Country 2024 & 2032
- Figure 33: North America Soft gel Capsules Industry Revenue Share (%), by Country 2024 & 2032
- Figure 34: North America Soft gel Capsules Industry Volume Share (%), by Country 2024 & 2032
- Figure 35: Europe Soft gel Capsules Industry Revenue (Million), by Type 2024 & 2032
- Figure 36: Europe Soft gel Capsules Industry Volume (K Unit), by Type 2024 & 2032
- Figure 37: Europe Soft gel Capsules Industry Revenue Share (%), by Type 2024 & 2032
- Figure 38: Europe Soft gel Capsules Industry Volume Share (%), by Type 2024 & 2032
- Figure 39: Europe Soft gel Capsules Industry Revenue (Million), by Application 2024 & 2032
- Figure 40: Europe Soft gel Capsules Industry Volume (K Unit), by Application 2024 & 2032
- Figure 41: Europe Soft gel Capsules Industry Revenue Share (%), by Application 2024 & 2032
- Figure 42: Europe Soft gel Capsules Industry Volume Share (%), by Application 2024 & 2032
- Figure 43: Europe Soft gel Capsules Industry Revenue (Million), by Country 2024 & 2032
- Figure 44: Europe Soft gel Capsules Industry Volume (K Unit), by Country 2024 & 2032
- Figure 45: Europe Soft gel Capsules Industry Revenue Share (%), by Country 2024 & 2032
- Figure 46: Europe Soft gel Capsules Industry Volume Share (%), by Country 2024 & 2032
- Figure 47: Asia Pacific Soft gel Capsules Industry Revenue (Million), by Type 2024 & 2032
- Figure 48: Asia Pacific Soft gel Capsules Industry Volume (K Unit), by Type 2024 & 2032
- Figure 49: Asia Pacific Soft gel Capsules Industry Revenue Share (%), by Type 2024 & 2032
- Figure 50: Asia Pacific Soft gel Capsules Industry Volume Share (%), by Type 2024 & 2032
- Figure 51: Asia Pacific Soft gel Capsules Industry Revenue (Million), by Application 2024 & 2032
- Figure 52: Asia Pacific Soft gel Capsules Industry Volume (K Unit), by Application 2024 & 2032
- Figure 53: Asia Pacific Soft gel Capsules Industry Revenue Share (%), by Application 2024 & 2032
- Figure 54: Asia Pacific Soft gel Capsules Industry Volume Share (%), by Application 2024 & 2032
- Figure 55: Asia Pacific Soft gel Capsules Industry Revenue (Million), by Country 2024 & 2032
- Figure 56: Asia Pacific Soft gel Capsules Industry Volume (K Unit), by Country 2024 & 2032
- Figure 57: Asia Pacific Soft gel Capsules Industry Revenue Share (%), by Country 2024 & 2032
- Figure 58: Asia Pacific Soft gel Capsules Industry Volume Share (%), by Country 2024 & 2032
- Figure 59: Middle East and Africa Soft gel Capsules Industry Revenue (Million), by Type 2024 & 2032
- Figure 60: Middle East and Africa Soft gel Capsules Industry Volume (K Unit), by Type 2024 & 2032
- Figure 61: Middle East and Africa Soft gel Capsules Industry Revenue Share (%), by Type 2024 & 2032
- Figure 62: Middle East and Africa Soft gel Capsules Industry Volume Share (%), by Type 2024 & 2032
- Figure 63: Middle East and Africa Soft gel Capsules Industry Revenue (Million), by Application 2024 & 2032
- Figure 64: Middle East and Africa Soft gel Capsules Industry Volume (K Unit), by Application 2024 & 2032
- Figure 65: Middle East and Africa Soft gel Capsules Industry Revenue Share (%), by Application 2024 & 2032
- Figure 66: Middle East and Africa Soft gel Capsules Industry Volume Share (%), by Application 2024 & 2032
- Figure 67: Middle East and Africa Soft gel Capsules Industry Revenue (Million), by Country 2024 & 2032
- Figure 68: Middle East and Africa Soft gel Capsules Industry Volume (K Unit), by Country 2024 & 2032
- Figure 69: Middle East and Africa Soft gel Capsules Industry Revenue Share (%), by Country 2024 & 2032
- Figure 70: Middle East and Africa Soft gel Capsules Industry Volume Share (%), by Country 2024 & 2032
- Figure 71: South America Soft gel Capsules Industry Revenue (Million), by Type 2024 & 2032
- Figure 72: South America Soft gel Capsules Industry Volume (K Unit), by Type 2024 & 2032
- Figure 73: South America Soft gel Capsules Industry Revenue Share (%), by Type 2024 & 2032
- Figure 74: South America Soft gel Capsules Industry Volume Share (%), by Type 2024 & 2032
- Figure 75: South America Soft gel Capsules Industry Revenue (Million), by Application 2024 & 2032
- Figure 76: South America Soft gel Capsules Industry Volume (K Unit), by Application 2024 & 2032
- Figure 77: South America Soft gel Capsules Industry Revenue Share (%), by Application 2024 & 2032
- Figure 78: South America Soft gel Capsules Industry Volume Share (%), by Application 2024 & 2032
- Figure 79: South America Soft gel Capsules Industry Revenue (Million), by Country 2024 & 2032
- Figure 80: South America Soft gel Capsules Industry Volume (K Unit), by Country 2024 & 2032
- Figure 81: South America Soft gel Capsules Industry Revenue Share (%), by Country 2024 & 2032
- Figure 82: South America Soft gel Capsules Industry Volume Share (%), by Country 2024 & 2032
List of Tables
- Table 1: Global Soft gel Capsules Industry Revenue Million Forecast, by Region 2019 & 2032
- Table 2: Global Soft gel Capsules Industry Volume K Unit Forecast, by Region 2019 & 2032
- Table 3: Global Soft gel Capsules Industry Revenue Million Forecast, by Type 2019 & 2032
- Table 4: Global Soft gel Capsules Industry Volume K Unit Forecast, by Type 2019 & 2032
- Table 5: Global Soft gel Capsules Industry Revenue Million Forecast, by Application 2019 & 2032
- Table 6: Global Soft gel Capsules Industry Volume K Unit Forecast, by Application 2019 & 2032
- Table 7: Global Soft gel Capsules Industry Revenue Million Forecast, by Region 2019 & 2032
- Table 8: Global Soft gel Capsules Industry Volume K Unit Forecast, by Region 2019 & 2032
- Table 9: Global Soft gel Capsules Industry Revenue Million Forecast, by Country 2019 & 2032
- Table 10: Global Soft gel Capsules Industry Volume K Unit Forecast, by Country 2019 & 2032
- Table 11: United States Soft gel Capsules Industry Revenue (Million) Forecast, by Application 2019 & 2032
- Table 12: United States Soft gel Capsules Industry Volume (K Unit) Forecast, by Application 2019 & 2032
- Table 13: Canada Soft gel Capsules Industry Revenue (Million) Forecast, by Application 2019 & 2032
- Table 14: Canada Soft gel Capsules Industry Volume (K Unit) Forecast, by Application 2019 & 2032
- Table 15: Mexico Soft gel Capsules Industry Revenue (Million) Forecast, by Application 2019 & 2032
- Table 16: Mexico Soft gel Capsules Industry Volume (K Unit) Forecast, by Application 2019 & 2032
- Table 17: Global Soft gel Capsules Industry Revenue Million Forecast, by Country 2019 & 2032
- Table 18: Global Soft gel Capsules Industry Volume K Unit Forecast, by Country 2019 & 2032
- Table 19: Germany Soft gel Capsules Industry Revenue (Million) Forecast, by Application 2019 & 2032
- Table 20: Germany Soft gel Capsules Industry Volume (K Unit) Forecast, by Application 2019 & 2032
- Table 21: United Kingdom Soft gel Capsules Industry Revenue (Million) Forecast, by Application 2019 & 2032
- Table 22: United Kingdom Soft gel Capsules Industry Volume (K Unit) Forecast, by Application 2019 & 2032
- Table 23: France Soft gel Capsules Industry Revenue (Million) Forecast, by Application 2019 & 2032
- Table 24: France Soft gel Capsules Industry Volume (K Unit) Forecast, by Application 2019 & 2032
- Table 25: Italy Soft gel Capsules Industry Revenue (Million) Forecast, by Application 2019 & 2032
- Table 26: Italy Soft gel Capsules Industry Volume (K Unit) Forecast, by Application 2019 & 2032
- Table 27: Spain Soft gel Capsules Industry Revenue (Million) Forecast, by Application 2019 & 2032
- Table 28: Spain Soft gel Capsules Industry Volume (K Unit) Forecast, by Application 2019 & 2032
- Table 29: Rest of Europe Soft gel Capsules Industry Revenue (Million) Forecast, by Application 2019 & 2032
- Table 30: Rest of Europe Soft gel Capsules Industry Volume (K Unit) Forecast, by Application 2019 & 2032
- Table 31: Global Soft gel Capsules Industry Revenue Million Forecast, by Country 2019 & 2032
- Table 32: Global Soft gel Capsules Industry Volume K Unit Forecast, by Country 2019 & 2032
- Table 33: China Soft gel Capsules Industry Revenue (Million) Forecast, by Application 2019 & 2032
- Table 34: China Soft gel Capsules Industry Volume (K Unit) Forecast, by Application 2019 & 2032
- Table 35: Japan Soft gel Capsules Industry Revenue (Million) Forecast, by Application 2019 & 2032
- Table 36: Japan Soft gel Capsules Industry Volume (K Unit) Forecast, by Application 2019 & 2032
- Table 37: India Soft gel Capsules Industry Revenue (Million) Forecast, by Application 2019 & 2032
- Table 38: India Soft gel Capsules Industry Volume (K Unit) Forecast, by Application 2019 & 2032
- Table 39: Australia Soft gel Capsules Industry Revenue (Million) Forecast, by Application 2019 & 2032
- Table 40: Australia Soft gel Capsules Industry Volume (K Unit) Forecast, by Application 2019 & 2032
- Table 41: South Korea Soft gel Capsules Industry Revenue (Million) Forecast, by Application 2019 & 2032
- Table 42: South Korea Soft gel Capsules Industry Volume (K Unit) Forecast, by Application 2019 & 2032
- Table 43: Rest of Asia Pacific Soft gel Capsules Industry Revenue (Million) Forecast, by Application 2019 & 2032
- Table 44: Rest of Asia Pacific Soft gel Capsules Industry Volume (K Unit) Forecast, by Application 2019 & 2032
- Table 45: Global Soft gel Capsules Industry Revenue Million Forecast, by Country 2019 & 2032
- Table 46: Global Soft gel Capsules Industry Volume K Unit Forecast, by Country 2019 & 2032
- Table 47: GCC Soft gel Capsules Industry Revenue (Million) Forecast, by Application 2019 & 2032
- Table 48: GCC Soft gel Capsules Industry Volume (K Unit) Forecast, by Application 2019 & 2032
- Table 49: South Africa Soft gel Capsules Industry Revenue (Million) Forecast, by Application 2019 & 2032
- Table 50: South Africa Soft gel Capsules Industry Volume (K Unit) Forecast, by Application 2019 & 2032
- Table 51: Rest of Middle East and Africa Soft gel Capsules Industry Revenue (Million) Forecast, by Application 2019 & 2032
- Table 52: Rest of Middle East and Africa Soft gel Capsules Industry Volume (K Unit) Forecast, by Application 2019 & 2032
- Table 53: Global Soft gel Capsules Industry Revenue Million Forecast, by Country 2019 & 2032
- Table 54: Global Soft gel Capsules Industry Volume K Unit Forecast, by Country 2019 & 2032
- Table 55: Brazil Soft gel Capsules Industry Revenue (Million) Forecast, by Application 2019 & 2032
- Table 56: Brazil Soft gel Capsules Industry Volume (K Unit) Forecast, by Application 2019 & 2032
- Table 57: Argentina Soft gel Capsules Industry Revenue (Million) Forecast, by Application 2019 & 2032
- Table 58: Argentina Soft gel Capsules Industry Volume (K Unit) Forecast, by Application 2019 & 2032
- Table 59: Rest of South America Soft gel Capsules Industry Revenue (Million) Forecast, by Application 2019 & 2032
- Table 60: Rest of South America Soft gel Capsules Industry Volume (K Unit) Forecast, by Application 2019 & 2032
- Table 61: Global Soft gel Capsules Industry Revenue Million Forecast, by Type 2019 & 2032
- Table 62: Global Soft gel Capsules Industry Volume K Unit Forecast, by Type 2019 & 2032
- Table 63: Global Soft gel Capsules Industry Revenue Million Forecast, by Application 2019 & 2032
- Table 64: Global Soft gel Capsules Industry Volume K Unit Forecast, by Application 2019 & 2032
- Table 65: Global Soft gel Capsules Industry Revenue Million Forecast, by Country 2019 & 2032
- Table 66: Global Soft gel Capsules Industry Volume K Unit Forecast, by Country 2019 & 2032
- Table 67: United States Soft gel Capsules Industry Revenue (Million) Forecast, by Application 2019 & 2032
- Table 68: United States Soft gel Capsules Industry Volume (K Unit) Forecast, by Application 2019 & 2032
- Table 69: Canada Soft gel Capsules Industry Revenue (Million) Forecast, by Application 2019 & 2032
- Table 70: Canada Soft gel Capsules Industry Volume (K Unit) Forecast, by Application 2019 & 2032
- Table 71: Mexico Soft gel Capsules Industry Revenue (Million) Forecast, by Application 2019 & 2032
- Table 72: Mexico Soft gel Capsules Industry Volume (K Unit) Forecast, by Application 2019 & 2032
- Table 73: Global Soft gel Capsules Industry Revenue Million Forecast, by Type 2019 & 2032
- Table 74: Global Soft gel Capsules Industry Volume K Unit Forecast, by Type 2019 & 2032
- Table 75: Global Soft gel Capsules Industry Revenue Million Forecast, by Application 2019 & 2032
- Table 76: Global Soft gel Capsules Industry Volume K Unit Forecast, by Application 2019 & 2032
- Table 77: Global Soft gel Capsules Industry Revenue Million Forecast, by Country 2019 & 2032
- Table 78: Global Soft gel Capsules Industry Volume K Unit Forecast, by Country 2019 & 2032
- Table 79: Germany Soft gel Capsules Industry Revenue (Million) Forecast, by Application 2019 & 2032
- Table 80: Germany Soft gel Capsules Industry Volume (K Unit) Forecast, by Application 2019 & 2032
- Table 81: United Kingdom Soft gel Capsules Industry Revenue (Million) Forecast, by Application 2019 & 2032
- Table 82: United Kingdom Soft gel Capsules Industry Volume (K Unit) Forecast, by Application 2019 & 2032
- Table 83: France Soft gel Capsules Industry Revenue (Million) Forecast, by Application 2019 & 2032
- Table 84: France Soft gel Capsules Industry Volume (K Unit) Forecast, by Application 2019 & 2032
- Table 85: Italy Soft gel Capsules Industry Revenue (Million) Forecast, by Application 2019 & 2032
- Table 86: Italy Soft gel Capsules Industry Volume (K Unit) Forecast, by Application 2019 & 2032
- Table 87: Spain Soft gel Capsules Industry Revenue (Million) Forecast, by Application 2019 & 2032
- Table 88: Spain Soft gel Capsules Industry Volume (K Unit) Forecast, by Application 2019 & 2032
- Table 89: Rest of Europe Soft gel Capsules Industry Revenue (Million) Forecast, by Application 2019 & 2032
- Table 90: Rest of Europe Soft gel Capsules Industry Volume (K Unit) Forecast, by Application 2019 & 2032
- Table 91: Global Soft gel Capsules Industry Revenue Million Forecast, by Type 2019 & 2032
- Table 92: Global Soft gel Capsules Industry Volume K Unit Forecast, by Type 2019 & 2032
- Table 93: Global Soft gel Capsules Industry Revenue Million Forecast, by Application 2019 & 2032
- Table 94: Global Soft gel Capsules Industry Volume K Unit Forecast, by Application 2019 & 2032
- Table 95: Global Soft gel Capsules Industry Revenue Million Forecast, by Country 2019 & 2032
- Table 96: Global Soft gel Capsules Industry Volume K Unit Forecast, by Country 2019 & 2032
- Table 97: China Soft gel Capsules Industry Revenue (Million) Forecast, by Application 2019 & 2032
- Table 98: China Soft gel Capsules Industry Volume (K Unit) Forecast, by Application 2019 & 2032
- Table 99: Japan Soft gel Capsules Industry Revenue (Million) Forecast, by Application 2019 & 2032
- Table 100: Japan Soft gel Capsules Industry Volume (K Unit) Forecast, by Application 2019 & 2032
- Table 101: India Soft gel Capsules Industry Revenue (Million) Forecast, by Application 2019 & 2032
- Table 102: India Soft gel Capsules Industry Volume (K Unit) Forecast, by Application 2019 & 2032
- Table 103: Australia Soft gel Capsules Industry Revenue (Million) Forecast, by Application 2019 & 2032
- Table 104: Australia Soft gel Capsules Industry Volume (K Unit) Forecast, by Application 2019 & 2032
- Table 105: South Korea Soft gel Capsules Industry Revenue (Million) Forecast, by Application 2019 & 2032
- Table 106: South Korea Soft gel Capsules Industry Volume (K Unit) Forecast, by Application 2019 & 2032
- Table 107: Rest of Asia Pacific Soft gel Capsules Industry Revenue (Million) Forecast, by Application 2019 & 2032
- Table 108: Rest of Asia Pacific Soft gel Capsules Industry Volume (K Unit) Forecast, by Application 2019 & 2032
- Table 109: Global Soft gel Capsules Industry Revenue Million Forecast, by Type 2019 & 2032
- Table 110: Global Soft gel Capsules Industry Volume K Unit Forecast, by Type 2019 & 2032
- Table 111: Global Soft gel Capsules Industry Revenue Million Forecast, by Application 2019 & 2032
- Table 112: Global Soft gel Capsules Industry Volume K Unit Forecast, by Application 2019 & 2032
- Table 113: Global Soft gel Capsules Industry Revenue Million Forecast, by Country 2019 & 2032
- Table 114: Global Soft gel Capsules Industry Volume K Unit Forecast, by Country 2019 & 2032
- Table 115: GCC Soft gel Capsules Industry Revenue (Million) Forecast, by Application 2019 & 2032
- Table 116: GCC Soft gel Capsules Industry Volume (K Unit) Forecast, by Application 2019 & 2032
- Table 117: South Africa Soft gel Capsules Industry Revenue (Million) Forecast, by Application 2019 & 2032
- Table 118: South Africa Soft gel Capsules Industry Volume (K Unit) Forecast, by Application 2019 & 2032
- Table 119: Rest of Middle East and Africa Soft gel Capsules Industry Revenue (Million) Forecast, by Application 2019 & 2032
- Table 120: Rest of Middle East and Africa Soft gel Capsules Industry Volume (K Unit) Forecast, by Application 2019 & 2032
- Table 121: Global Soft gel Capsules Industry Revenue Million Forecast, by Type 2019 & 2032
- Table 122: Global Soft gel Capsules Industry Volume K Unit Forecast, by Type 2019 & 2032
- Table 123: Global Soft gel Capsules Industry Revenue Million Forecast, by Application 2019 & 2032
- Table 124: Global Soft gel Capsules Industry Volume K Unit Forecast, by Application 2019 & 2032
- Table 125: Global Soft gel Capsules Industry Revenue Million Forecast, by Country 2019 & 2032
- Table 126: Global Soft gel Capsules Industry Volume K Unit Forecast, by Country 2019 & 2032
- Table 127: Brazil Soft gel Capsules Industry Revenue (Million) Forecast, by Application 2019 & 2032
- Table 128: Brazil Soft gel Capsules Industry Volume (K Unit) Forecast, by Application 2019 & 2032
- Table 129: Argentina Soft gel Capsules Industry Revenue (Million) Forecast, by Application 2019 & 2032
- Table 130: Argentina Soft gel Capsules Industry Volume (K Unit) Forecast, by Application 2019 & 2032
- Table 131: Rest of South America Soft gel Capsules Industry Revenue (Million) Forecast, by Application 2019 & 2032
- Table 132: Rest of South America Soft gel Capsules Industry Volume (K Unit) Forecast, by Application 2019 & 2032
Frequently Asked Questions
1. What is the projected Compound Annual Growth Rate (CAGR) of the Soft gel Capsules Industry?
The projected CAGR is approximately 7.70%.
2. Which companies are prominent players in the Soft gel Capsules Industry?
Key companies in the market include EuroCaps, CAPTEK, fortunelabs, Aenova Group, SaintyCo, Procaps, Sirio Pharma, United Laboratories, Fuji Capsule Co Ltd, Soft Gel Technologies Inc, MEDGEL.
3. What are the main segments of the Soft gel Capsules Industry?
The market segments include Type, Application.
4. Can you provide details about the market size?
The market size is estimated to be USD XX Million as of 2022.
5. What are some drivers contributing to market growth?
Technological Advancements and Increasing R&D Activities; Growing Demand from Health-conscious Consumers.
6. What are the notable trends driving market growth?
Pharmaceutical Segment is Expected to Hold a Significant Market Share Over the Forecast Period.
7. Are there any restraints impacting market growth?
Drawbacks Associated with Softgel Capsules.
8. Can you provide examples of recent developments in the market?
In May 2022, Windzor Pharma Ltd launched Rx Vitamin D3 product Solferol Softgel capsules in the Irish market. It is one of the low-cost Solferol Softgel Vitamin D3 capsules.
9. What pricing options are available for accessing the report?
Pricing options include single-user, multi-user, and enterprise licenses priced at USD 4750, USD 5250, and USD 8750 respectively.
10. Is the market size provided in terms of value or volume?
The market size is provided in terms of value, measured in Million and volume, measured in K Unit.
11. Are there any specific market keywords associated with the report?
Yes, the market keyword associated with the report is "Soft gel Capsules Industry," which aids in identifying and referencing the specific market segment covered.
12. How do I determine which pricing option suits my needs best?
The pricing options vary based on user requirements and access needs. Individual users may opt for single-user licenses, while businesses requiring broader access may choose multi-user or enterprise licenses for cost-effective access to the report.
13. Are there any additional resources or data provided in the Soft gel Capsules Industry report?
While the report offers comprehensive insights, it's advisable to review the specific contents or supplementary materials provided to ascertain if additional resources or data are available.
14. How can I stay updated on further developments or reports in the Soft gel Capsules Industry?
To stay informed about further developments, trends, and reports in the Soft gel Capsules Industry, consider subscribing to industry newsletters, following relevant companies and organizations, or regularly checking reputable industry news sources and publications.
Methodology
Step 1 - Identification of Relevant Samples Size from Population Database


Step 2 - Approaches for Defining Global Market Size (Value, Volume* & Price*)

Note*: In applicable scenarios
Step 3 - Data Sources
Primary Research
- Web Analytics
- Survey Reports
- Research Institute
- Latest Research Reports
- Opinion Leaders
Secondary Research
- Annual Reports
- White Paper
- Latest Press Release
- Industry Association
- Paid Database
- Investor Presentations

Step 4 - Data Triangulation
Involves using different sources of information in order to increase the validity of a study
These sources are likely to be stakeholders in a program - participants, other researchers, program staff, other community members, and so on.
Then we put all data in single framework & apply various statistical tools to find out the dynamic on the market.
During the analysis stage, feedback from the stakeholder groups would be compared to determine areas of agreement as well as areas of divergence


