
Key Insights
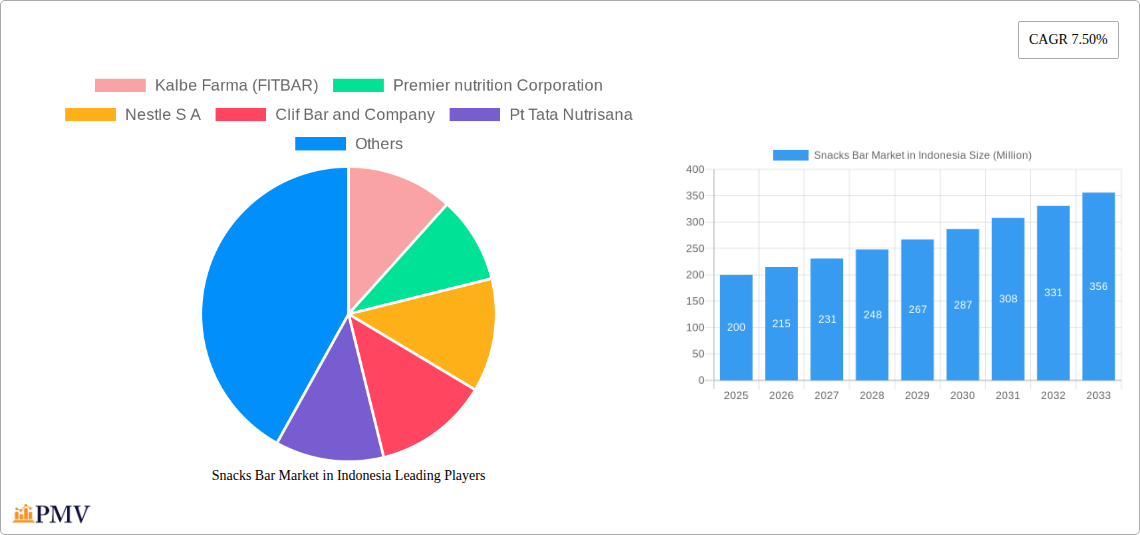
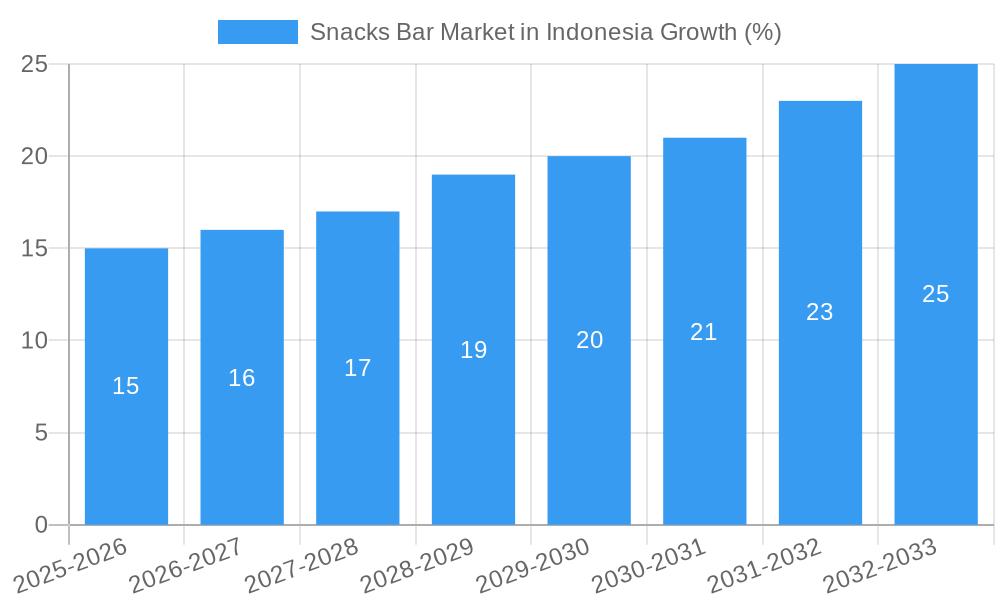
The Indonesian snacks bar market, exhibiting a robust Compound Annual Growth Rate (CAGR) of 7.50% from 2019 to 2024, presents a lucrative opportunity for both established players and new entrants. This growth is fueled by several key drivers. Rising health consciousness among Indonesian consumers is driving demand for healthier snack options, such as cereal and energy bars. The increasing popularity of convenient, on-the-go snacks, particularly amongst younger demographics and working professionals, further bolsters market expansion. The expanding middle class and increased disposable incomes are also significant contributors, enabling consumers to afford premium and specialized snack bars. Supermarkets and hypermarkets remain the dominant distribution channels, although online stores are experiencing significant growth, reflecting the broader e-commerce boom in Indonesia. Key players like Kalbe Farma (FITBAR), Nestle S.A., and General Mills are leveraging their brand recognition and distribution networks to capture market share, while smaller, niche players focus on innovative product offerings and targeted marketing campaigns. Competition is expected to intensify, particularly in the energy bar segment, as new players enter the market. Potential restraints include fluctuating raw material prices and the presence of cheaper, less healthy alternatives. However, the overall market outlook remains positive, with projections indicating continued growth throughout the forecast period (2025-2033). We estimate the market size in 2025 to be approximately $200 million USD, considering the CAGR and assuming a reasonably consistent growth trajectory.
The segment breakdown shows a strong preference for cereal and energy bars, reflecting consumer demand for functional and nutritious snacks. The convenience store and grocery store channels are also exhibiting robust growth due to their widespread reach and accessibility to consumers. To capitalize on the market opportunity, companies should invest in product innovation, focusing on locally sourced ingredients and appealing to specific consumer preferences. Strategic partnerships with e-commerce platforms are crucial for optimizing online sales. Furthermore, targeted marketing campaigns focusing on health benefits and lifestyle integration are vital for attracting and retaining customers. The Indonesian snacks bar market’s trajectory indicates significant potential for growth and offers opportunities for both established multinational corporations and smaller, agile businesses to thrive. Expansion into new regions and diversification of product offerings will be crucial for sustained success.
Snacks Bar Market in Indonesia: A Comprehensive Report (2019-2033)
This detailed report provides a comprehensive analysis of the Indonesian snacks bar market, covering market size, segmentation, competitive landscape, growth drivers, challenges, and future outlook. The study period spans 2019-2033, with 2025 as the base and estimated year. The forecast period is 2025-2033, and the historical period covers 2019-2024. This report is invaluable for businesses, investors, and stakeholders seeking to understand and capitalize on opportunities within this dynamic market. The Indonesian snacks bar market is projected to reach xx Million by 2033.
Snacks Bar Market in Indonesia Market Structure & Competitive Dynamics
The Indonesian snacks bar market exhibits a moderately concentrated structure, with key players like Nestle S.A., Kalbe Farma (FITBAR), and PT Tata Nutrisana holding significant market share. However, the presence of numerous smaller players and increasing private label offerings indicates a competitive landscape. The market's innovation ecosystem is driven by consumer demand for healthier and more convenient snack options, leading to the introduction of new flavors, ingredients, and formats. Regulatory frameworks concerning food safety and labeling influence product development and marketing strategies. Product substitutes, such as traditional snacks and confectionery, exert competitive pressure. End-user trends towards health consciousness and convenience are major growth drivers. M&A activity has been moderate, with deal values ranging from xx Million to xx Million in recent years, primarily focused on expanding product portfolios and market reach. Specific examples of M&A activity are not publicly available for this market, hence the xx values.
- Market Concentration: Moderately Concentrated
- Key Players: Nestle S.A., Kalbe Farma (FITBAR), PT Tata Nutrisana, and others.
- M&A Activity: Moderate, with deal values ranging from xx Million to xx Million.
- Innovation: Driven by health and convenience trends.
- Regulatory Framework: Focus on food safety and labeling.
Snacks Bar Market in Indonesia Industry Trends & Insights
The Indonesian snacks bar market is experiencing robust growth, driven primarily by rising disposable incomes, increasing health awareness, and a shift towards convenient snacking options. The market's CAGR during the historical period (2019-2024) was approximately xx%, and it is projected to maintain a healthy growth rate of xx% during the forecast period (2025-2033). Technological advancements in food processing and packaging enhance product shelf life and quality, contributing to market expansion. Consumer preferences are evolving towards healthier options, such as protein bars and those with natural ingredients, while the demand for indulgent treats remains significant. Competitive dynamics are characterized by both price competition and product differentiation. Market penetration remains relatively low compared to developed markets, offering substantial growth potential.
Dominant Markets & Segments in Snacks Bar Market in Indonesia
Within the Indonesian snacks bar market, the Supermarkets/Hypermarkets distribution channel holds the largest market share due to its extensive reach and established infrastructure. The Energy Bars segment displays the highest growth potential, fueled by increasing fitness consciousness among consumers. Java, as the most populous island, represents the dominant regional market.
- Dominant Distribution Channel: Supermarkets/Hypermarkets
- Fastest-Growing Product Type: Energy Bars
- Dominant Region: Java
- Key Drivers: Rising disposable incomes, improving infrastructure in key regions, increased health awareness.
Snacks Bar Market in Indonesia Product Innovations
Recent product innovations in the Indonesian snacks bar market reflect a focus on healthier options and diversified flavors. Manufacturers are incorporating high-protein ingredients, natural sweeteners, and unique flavor profiles to appeal to evolving consumer preferences. Technological advancements in ingredient sourcing, processing, and packaging are enabling the development of more nutritious and convenient products. These innovations enhance competitive advantages by offering superior taste, nutritional value, and convenience.
Report Segmentation & Scope
The report segments the Indonesian snacks bar market based on product type (Cereal Bars, Energy Bars, Other Product Types) and distribution channel (Supermarkets/Hypermarkets, Convenience/Grocery Stores, Specialty Stores, Online Stores, Other Distribution Channels). Each segment's growth projections, market sizes, and competitive dynamics are analyzed in detail. For example, the Cereal Bars segment is expected to grow at a CAGR of xx%, while the Online Stores channel is anticipated to show the fastest growth among distribution channels.
Key Drivers of Snacks Bar Market in Indonesia Growth
Several factors drive the growth of the Indonesian snacks bar market, including:
- Rising disposable incomes: Increased purchasing power allows consumers to spend more on convenient and premium snacks.
- Growing health consciousness: Consumers are increasingly seeking healthier snack options with added nutritional benefits.
- Changing lifestyles and urbanization: Busy lifestyles and urbanization contribute to the demand for convenient, on-the-go snacks.
- Increasing availability of imported products: Expanded retail infrastructure improves access to various global brands, which drives innovation and market competitiveness.
Challenges in the Snacks Bar Market in Indonesia Sector
Challenges include intense competition from traditional snacks, fluctuating raw material prices, and the need to adapt to evolving consumer preferences. Regulatory compliance related to food safety and labeling also adds complexity. Supply chain disruptions can affect product availability and pricing. The impact of these challenges on market growth is estimated at xx% annually, an impact which is projected to remain constant during the forecast period.
Leading Players in the Snacks Bar Market in Indonesia Market
- Kalbe Farma (FITBAR)
- Premier Nutrition Corporation
- Nestle S.A. [Nestle Website]
- Clif Bar and Company [Clif Bar Website]
- PT Tata Nutrisana
- General Mills Inc. [General Mills Website]
- Rise Bar
- Go Natural
- NuGo Nutrition
- Otsuka Pharmaceutical Co Ltd [Otsuka Website]
Key Developments in Snacks Bar Market in Indonesia Sector
- August 2021: PT Amerta Indah Otsuka launched a new European-inspired flavored soy bar (Danish Cheese) under its SoyJoy brand. This expansion caters to evolving consumer preferences for unique and international flavors.
- January 2022: General Mills expanded its Fibre One snack bar line with a new strawberry cheesecake-flavored cake bar, targeting consumers seeking indulgent yet relatively healthy options. These launches indicate a focus on innovation and meeting diverse consumer needs.
Strategic Snacks Bar Market in Indonesia Market Outlook
The Indonesian snacks bar market presents significant future potential. Continued economic growth, rising health awareness, and evolving consumer preferences create opportunities for innovation and market expansion. Strategic focus on product differentiation, health-focused offerings, and effective distribution strategies will be crucial for success. The market's sustained growth is expected to attract further investment and competition, further shaping its dynamic landscape.
Snacks Bar Market in Indonesia Segmentation
-
1. Product Type
- 1.1. Cereal Bars
- 1.2. Energy Bars
- 1.3. Other Product Types
-
2. Distribution Channel
- 2.1. Supermarkets/Hypermarkets
- 2.2. Convenience/Grocery Stores
- 2.3. Specialty Stores
- 2.4. Online Stores
- 2.5. Other Distribution Channels
Snacks Bar Market in Indonesia Segmentation By Geography
-
1. North America
- 1.1. United States
- 1.2. Canada
- 1.3. Mexico
-
2. South America
- 2.1. Brazil
- 2.2. Argentina
- 2.3. Rest of South America
-
3. Europe
- 3.1. United Kingdom
- 3.2. Germany
- 3.3. France
- 3.4. Italy
- 3.5. Spain
- 3.6. Russia
- 3.7. Benelux
- 3.8. Nordics
- 3.9. Rest of Europe
-
4. Middle East & Africa
- 4.1. Turkey
- 4.2. Israel
- 4.3. GCC
- 4.4. North Africa
- 4.5. South Africa
- 4.6. Rest of Middle East & Africa
-
5. Asia Pacific
- 5.1. China
- 5.2. India
- 5.3. Japan
- 5.4. South Korea
- 5.5. ASEAN
- 5.6. Oceania
- 5.7. Rest of Asia Pacific
Snacks Bar Market in Indonesia REPORT HIGHLIGHTS
| Aspects | Details |
|---|---|
| Study Period | 2019-2033 |
| Base Year | 2024 |
| Estimated Year | 2025 |
| Forecast Period | 2025-2033 |
| Historical Period | 2019-2024 |
| Growth Rate | CAGR of 7.50% from 2019-2033 |
| Segmentation |
|
Table of Contents
- 1. Introduction
- 1.1. Research Scope
- 1.2. Market Segmentation
- 1.3. Research Methodology
- 1.4. Definitions and Assumptions
- 2. Executive Summary
- 2.1. Introduction
- 3. Market Dynamics
- 3.1. Introduction
- 3.2. Market Drivers
- 3.2.1. Increasing Consumer Awareness Regarding Natural Products; Growing Demand for Anthocyanin in Pharmaceutical Industry
- 3.3. Market Restrains
- 3.3.1. Easy Availability of Synthetic Food Colorant
- 3.4. Market Trends
- 3.4.1. Growing Demand For Healthy On-the-go Snacking
- 4. Market Factor Analysis
- 4.1. Porters Five Forces
- 4.2. Supply/Value Chain
- 4.3. PESTEL analysis
- 4.4. Market Entropy
- 4.5. Patent/Trademark Analysis
- 5. Global Snacks Bar Market in Indonesia Analysis, Insights and Forecast, 2019-2031
- 5.1. Market Analysis, Insights and Forecast - by Product Type
- 5.1.1. Cereal Bars
- 5.1.2. Energy Bars
- 5.1.3. Other Product Types
- 5.2. Market Analysis, Insights and Forecast - by Distribution Channel
- 5.2.1. Supermarkets/Hypermarkets
- 5.2.2. Convenience/Grocery Stores
- 5.2.3. Specialty Stores
- 5.2.4. Online Stores
- 5.2.5. Other Distribution Channels
- 5.3. Market Analysis, Insights and Forecast - by Region
- 5.3.1. North America
- 5.3.2. South America
- 5.3.3. Europe
- 5.3.4. Middle East & Africa
- 5.3.5. Asia Pacific
- 5.1. Market Analysis, Insights and Forecast - by Product Type
- 6. North America Snacks Bar Market in Indonesia Analysis, Insights and Forecast, 2019-2031
- 6.1. Market Analysis, Insights and Forecast - by Product Type
- 6.1.1. Cereal Bars
- 6.1.2. Energy Bars
- 6.1.3. Other Product Types
- 6.2. Market Analysis, Insights and Forecast - by Distribution Channel
- 6.2.1. Supermarkets/Hypermarkets
- 6.2.2. Convenience/Grocery Stores
- 6.2.3. Specialty Stores
- 6.2.4. Online Stores
- 6.2.5. Other Distribution Channels
- 6.1. Market Analysis, Insights and Forecast - by Product Type
- 7. South America Snacks Bar Market in Indonesia Analysis, Insights and Forecast, 2019-2031
- 7.1. Market Analysis, Insights and Forecast - by Product Type
- 7.1.1. Cereal Bars
- 7.1.2. Energy Bars
- 7.1.3. Other Product Types
- 7.2. Market Analysis, Insights and Forecast - by Distribution Channel
- 7.2.1. Supermarkets/Hypermarkets
- 7.2.2. Convenience/Grocery Stores
- 7.2.3. Specialty Stores
- 7.2.4. Online Stores
- 7.2.5. Other Distribution Channels
- 7.1. Market Analysis, Insights and Forecast - by Product Type
- 8. Europe Snacks Bar Market in Indonesia Analysis, Insights and Forecast, 2019-2031
- 8.1. Market Analysis, Insights and Forecast - by Product Type
- 8.1.1. Cereal Bars
- 8.1.2. Energy Bars
- 8.1.3. Other Product Types
- 8.2. Market Analysis, Insights and Forecast - by Distribution Channel
- 8.2.1. Supermarkets/Hypermarkets
- 8.2.2. Convenience/Grocery Stores
- 8.2.3. Specialty Stores
- 8.2.4. Online Stores
- 8.2.5. Other Distribution Channels
- 8.1. Market Analysis, Insights and Forecast - by Product Type
- 9. Middle East & Africa Snacks Bar Market in Indonesia Analysis, Insights and Forecast, 2019-2031
- 9.1. Market Analysis, Insights and Forecast - by Product Type
- 9.1.1. Cereal Bars
- 9.1.2. Energy Bars
- 9.1.3. Other Product Types
- 9.2. Market Analysis, Insights and Forecast - by Distribution Channel
- 9.2.1. Supermarkets/Hypermarkets
- 9.2.2. Convenience/Grocery Stores
- 9.2.3. Specialty Stores
- 9.2.4. Online Stores
- 9.2.5. Other Distribution Channels
- 9.1. Market Analysis, Insights and Forecast - by Product Type
- 10. Asia Pacific Snacks Bar Market in Indonesia Analysis, Insights and Forecast, 2019-2031
- 10.1. Market Analysis, Insights and Forecast - by Product Type
- 10.1.1. Cereal Bars
- 10.1.2. Energy Bars
- 10.1.3. Other Product Types
- 10.2. Market Analysis, Insights and Forecast - by Distribution Channel
- 10.2.1. Supermarkets/Hypermarkets
- 10.2.2. Convenience/Grocery Stores
- 10.2.3. Specialty Stores
- 10.2.4. Online Stores
- 10.2.5. Other Distribution Channels
- 10.1. Market Analysis, Insights and Forecast - by Product Type
- 11. Competitive Analysis
- 11.1. Global Market Share Analysis 2024
- 11.2. Company Profiles
- 11.2.1 Kalbe Farma (FITBAR)
- 11.2.1.1. Overview
- 11.2.1.2. Products
- 11.2.1.3. SWOT Analysis
- 11.2.1.4. Recent Developments
- 11.2.1.5. Financials (Based on Availability)
- 11.2.2 Premier nutrition Corporation
- 11.2.2.1. Overview
- 11.2.2.2. Products
- 11.2.2.3. SWOT Analysis
- 11.2.2.4. Recent Developments
- 11.2.2.5. Financials (Based on Availability)
- 11.2.3 Nestle S A
- 11.2.3.1. Overview
- 11.2.3.2. Products
- 11.2.3.3. SWOT Analysis
- 11.2.3.4. Recent Developments
- 11.2.3.5. Financials (Based on Availability)
- 11.2.4 Clif Bar and Company
- 11.2.4.1. Overview
- 11.2.4.2. Products
- 11.2.4.3. SWOT Analysis
- 11.2.4.4. Recent Developments
- 11.2.4.5. Financials (Based on Availability)
- 11.2.5 Pt Tata Nutrisana
- 11.2.5.1. Overview
- 11.2.5.2. Products
- 11.2.5.3. SWOT Analysis
- 11.2.5.4. Recent Developments
- 11.2.5.5. Financials (Based on Availability)
- 11.2.6 General Mills Inc*List Not Exhaustive
- 11.2.6.1. Overview
- 11.2.6.2. Products
- 11.2.6.3. SWOT Analysis
- 11.2.6.4. Recent Developments
- 11.2.6.5. Financials (Based on Availability)
- 11.2.7 Rise Bar
- 11.2.7.1. Overview
- 11.2.7.2. Products
- 11.2.7.3. SWOT Analysis
- 11.2.7.4. Recent Developments
- 11.2.7.5. Financials (Based on Availability)
- 11.2.8 Go Natural
- 11.2.8.1. Overview
- 11.2.8.2. Products
- 11.2.8.3. SWOT Analysis
- 11.2.8.4. Recent Developments
- 11.2.8.5. Financials (Based on Availability)
- 11.2.9 NuGo Nutrition
- 11.2.9.1. Overview
- 11.2.9.2. Products
- 11.2.9.3. SWOT Analysis
- 11.2.9.4. Recent Developments
- 11.2.9.5. Financials (Based on Availability)
- 11.2.10 Otsuka Pharmaceutical Co Ltd
- 11.2.10.1. Overview
- 11.2.10.2. Products
- 11.2.10.3. SWOT Analysis
- 11.2.10.4. Recent Developments
- 11.2.10.5. Financials (Based on Availability)
- 11.2.1 Kalbe Farma (FITBAR)
List of Figures
- Figure 1: Global Snacks Bar Market in Indonesia Revenue Breakdown (Million, %) by Region 2024 & 2032
- Figure 2: Indonesia Snacks Bar Market in Indonesia Revenue (Million), by Country 2024 & 2032
- Figure 3: Indonesia Snacks Bar Market in Indonesia Revenue Share (%), by Country 2024 & 2032
- Figure 4: North America Snacks Bar Market in Indonesia Revenue (Million), by Product Type 2024 & 2032
- Figure 5: North America Snacks Bar Market in Indonesia Revenue Share (%), by Product Type 2024 & 2032
- Figure 6: North America Snacks Bar Market in Indonesia Revenue (Million), by Distribution Channel 2024 & 2032
- Figure 7: North America Snacks Bar Market in Indonesia Revenue Share (%), by Distribution Channel 2024 & 2032
- Figure 8: North America Snacks Bar Market in Indonesia Revenue (Million), by Country 2024 & 2032
- Figure 9: North America Snacks Bar Market in Indonesia Revenue Share (%), by Country 2024 & 2032
- Figure 10: South America Snacks Bar Market in Indonesia Revenue (Million), by Product Type 2024 & 2032
- Figure 11: South America Snacks Bar Market in Indonesia Revenue Share (%), by Product Type 2024 & 2032
- Figure 12: South America Snacks Bar Market in Indonesia Revenue (Million), by Distribution Channel 2024 & 2032
- Figure 13: South America Snacks Bar Market in Indonesia Revenue Share (%), by Distribution Channel 2024 & 2032
- Figure 14: South America Snacks Bar Market in Indonesia Revenue (Million), by Country 2024 & 2032
- Figure 15: South America Snacks Bar Market in Indonesia Revenue Share (%), by Country 2024 & 2032
- Figure 16: Europe Snacks Bar Market in Indonesia Revenue (Million), by Product Type 2024 & 2032
- Figure 17: Europe Snacks Bar Market in Indonesia Revenue Share (%), by Product Type 2024 & 2032
- Figure 18: Europe Snacks Bar Market in Indonesia Revenue (Million), by Distribution Channel 2024 & 2032
- Figure 19: Europe Snacks Bar Market in Indonesia Revenue Share (%), by Distribution Channel 2024 & 2032
- Figure 20: Europe Snacks Bar Market in Indonesia Revenue (Million), by Country 2024 & 2032
- Figure 21: Europe Snacks Bar Market in Indonesia Revenue Share (%), by Country 2024 & 2032
- Figure 22: Middle East & Africa Snacks Bar Market in Indonesia Revenue (Million), by Product Type 2024 & 2032
- Figure 23: Middle East & Africa Snacks Bar Market in Indonesia Revenue Share (%), by Product Type 2024 & 2032
- Figure 24: Middle East & Africa Snacks Bar Market in Indonesia Revenue (Million), by Distribution Channel 2024 & 2032
- Figure 25: Middle East & Africa Snacks Bar Market in Indonesia Revenue Share (%), by Distribution Channel 2024 & 2032
- Figure 26: Middle East & Africa Snacks Bar Market in Indonesia Revenue (Million), by Country 2024 & 2032
- Figure 27: Middle East & Africa Snacks Bar Market in Indonesia Revenue Share (%), by Country 2024 & 2032
- Figure 28: Asia Pacific Snacks Bar Market in Indonesia Revenue (Million), by Product Type 2024 & 2032
- Figure 29: Asia Pacific Snacks Bar Market in Indonesia Revenue Share (%), by Product Type 2024 & 2032
- Figure 30: Asia Pacific Snacks Bar Market in Indonesia Revenue (Million), by Distribution Channel 2024 & 2032
- Figure 31: Asia Pacific Snacks Bar Market in Indonesia Revenue Share (%), by Distribution Channel 2024 & 2032
- Figure 32: Asia Pacific Snacks Bar Market in Indonesia Revenue (Million), by Country 2024 & 2032
- Figure 33: Asia Pacific Snacks Bar Market in Indonesia Revenue Share (%), by Country 2024 & 2032
List of Tables
- Table 1: Global Snacks Bar Market in Indonesia Revenue Million Forecast, by Region 2019 & 2032
- Table 2: Global Snacks Bar Market in Indonesia Revenue Million Forecast, by Product Type 2019 & 2032
- Table 3: Global Snacks Bar Market in Indonesia Revenue Million Forecast, by Distribution Channel 2019 & 2032
- Table 4: Global Snacks Bar Market in Indonesia Revenue Million Forecast, by Region 2019 & 2032
- Table 5: Global Snacks Bar Market in Indonesia Revenue Million Forecast, by Country 2019 & 2032
- Table 6: Global Snacks Bar Market in Indonesia Revenue Million Forecast, by Product Type 2019 & 2032
- Table 7: Global Snacks Bar Market in Indonesia Revenue Million Forecast, by Distribution Channel 2019 & 2032
- Table 8: Global Snacks Bar Market in Indonesia Revenue Million Forecast, by Country 2019 & 2032
- Table 9: United States Snacks Bar Market in Indonesia Revenue (Million) Forecast, by Application 2019 & 2032
- Table 10: Canada Snacks Bar Market in Indonesia Revenue (Million) Forecast, by Application 2019 & 2032
- Table 11: Mexico Snacks Bar Market in Indonesia Revenue (Million) Forecast, by Application 2019 & 2032
- Table 12: Global Snacks Bar Market in Indonesia Revenue Million Forecast, by Product Type 2019 & 2032
- Table 13: Global Snacks Bar Market in Indonesia Revenue Million Forecast, by Distribution Channel 2019 & 2032
- Table 14: Global Snacks Bar Market in Indonesia Revenue Million Forecast, by Country 2019 & 2032
- Table 15: Brazil Snacks Bar Market in Indonesia Revenue (Million) Forecast, by Application 2019 & 2032
- Table 16: Argentina Snacks Bar Market in Indonesia Revenue (Million) Forecast, by Application 2019 & 2032
- Table 17: Rest of South America Snacks Bar Market in Indonesia Revenue (Million) Forecast, by Application 2019 & 2032
- Table 18: Global Snacks Bar Market in Indonesia Revenue Million Forecast, by Product Type 2019 & 2032
- Table 19: Global Snacks Bar Market in Indonesia Revenue Million Forecast, by Distribution Channel 2019 & 2032
- Table 20: Global Snacks Bar Market in Indonesia Revenue Million Forecast, by Country 2019 & 2032
- Table 21: United Kingdom Snacks Bar Market in Indonesia Revenue (Million) Forecast, by Application 2019 & 2032
- Table 22: Germany Snacks Bar Market in Indonesia Revenue (Million) Forecast, by Application 2019 & 2032
- Table 23: France Snacks Bar Market in Indonesia Revenue (Million) Forecast, by Application 2019 & 2032
- Table 24: Italy Snacks Bar Market in Indonesia Revenue (Million) Forecast, by Application 2019 & 2032
- Table 25: Spain Snacks Bar Market in Indonesia Revenue (Million) Forecast, by Application 2019 & 2032
- Table 26: Russia Snacks Bar Market in Indonesia Revenue (Million) Forecast, by Application 2019 & 2032
- Table 27: Benelux Snacks Bar Market in Indonesia Revenue (Million) Forecast, by Application 2019 & 2032
- Table 28: Nordics Snacks Bar Market in Indonesia Revenue (Million) Forecast, by Application 2019 & 2032
- Table 29: Rest of Europe Snacks Bar Market in Indonesia Revenue (Million) Forecast, by Application 2019 & 2032
- Table 30: Global Snacks Bar Market in Indonesia Revenue Million Forecast, by Product Type 2019 & 2032
- Table 31: Global Snacks Bar Market in Indonesia Revenue Million Forecast, by Distribution Channel 2019 & 2032
- Table 32: Global Snacks Bar Market in Indonesia Revenue Million Forecast, by Country 2019 & 2032
- Table 33: Turkey Snacks Bar Market in Indonesia Revenue (Million) Forecast, by Application 2019 & 2032
- Table 34: Israel Snacks Bar Market in Indonesia Revenue (Million) Forecast, by Application 2019 & 2032
- Table 35: GCC Snacks Bar Market in Indonesia Revenue (Million) Forecast, by Application 2019 & 2032
- Table 36: North Africa Snacks Bar Market in Indonesia Revenue (Million) Forecast, by Application 2019 & 2032
- Table 37: South Africa Snacks Bar Market in Indonesia Revenue (Million) Forecast, by Application 2019 & 2032
- Table 38: Rest of Middle East & Africa Snacks Bar Market in Indonesia Revenue (Million) Forecast, by Application 2019 & 2032
- Table 39: Global Snacks Bar Market in Indonesia Revenue Million Forecast, by Product Type 2019 & 2032
- Table 40: Global Snacks Bar Market in Indonesia Revenue Million Forecast, by Distribution Channel 2019 & 2032
- Table 41: Global Snacks Bar Market in Indonesia Revenue Million Forecast, by Country 2019 & 2032
- Table 42: China Snacks Bar Market in Indonesia Revenue (Million) Forecast, by Application 2019 & 2032
- Table 43: India Snacks Bar Market in Indonesia Revenue (Million) Forecast, by Application 2019 & 2032
- Table 44: Japan Snacks Bar Market in Indonesia Revenue (Million) Forecast, by Application 2019 & 2032
- Table 45: South Korea Snacks Bar Market in Indonesia Revenue (Million) Forecast, by Application 2019 & 2032
- Table 46: ASEAN Snacks Bar Market in Indonesia Revenue (Million) Forecast, by Application 2019 & 2032
- Table 47: Oceania Snacks Bar Market in Indonesia Revenue (Million) Forecast, by Application 2019 & 2032
- Table 48: Rest of Asia Pacific Snacks Bar Market in Indonesia Revenue (Million) Forecast, by Application 2019 & 2032
Frequently Asked Questions
1. What is the projected Compound Annual Growth Rate (CAGR) of the Snacks Bar Market in Indonesia?
The projected CAGR is approximately 7.50%.
2. Which companies are prominent players in the Snacks Bar Market in Indonesia?
Key companies in the market include Kalbe Farma (FITBAR), Premier nutrition Corporation, Nestle S A, Clif Bar and Company, Pt Tata Nutrisana, General Mills Inc*List Not Exhaustive, Rise Bar, Go Natural, NuGo Nutrition, Otsuka Pharmaceutical Co Ltd.
3. What are the main segments of the Snacks Bar Market in Indonesia?
The market segments include Product Type, Distribution Channel.
4. Can you provide details about the market size?
The market size is estimated to be USD XX Million as of 2022.
5. What are some drivers contributing to market growth?
Increasing Consumer Awareness Regarding Natural Products; Growing Demand for Anthocyanin in Pharmaceutical Industry.
6. What are the notable trends driving market growth?
Growing Demand For Healthy On-the-go Snacking.
7. Are there any restraints impacting market growth?
Easy Availability of Synthetic Food Colorant.
8. Can you provide examples of recent developments in the market?
January 2022: General Mills-owned snack brand Fibre One expanded its snack bar line with a new strawberry cheesecake-flavored cake bar. The Fibre One 90-calorie bar is made with a layer of soft cake, strawberry flavor filling, and a cream cheese flavor coating and topped with crunchy sprinkles.
9. What pricing options are available for accessing the report?
Pricing options include single-user, multi-user, and enterprise licenses priced at USD 3800, USD 4500, and USD 5800 respectively.
10. Is the market size provided in terms of value or volume?
The market size is provided in terms of value, measured in Million.
11. Are there any specific market keywords associated with the report?
Yes, the market keyword associated with the report is "Snacks Bar Market in Indonesia," which aids in identifying and referencing the specific market segment covered.
12. How do I determine which pricing option suits my needs best?
The pricing options vary based on user requirements and access needs. Individual users may opt for single-user licenses, while businesses requiring broader access may choose multi-user or enterprise licenses for cost-effective access to the report.
13. Are there any additional resources or data provided in the Snacks Bar Market in Indonesia report?
While the report offers comprehensive insights, it's advisable to review the specific contents or supplementary materials provided to ascertain if additional resources or data are available.
14. How can I stay updated on further developments or reports in the Snacks Bar Market in Indonesia?
To stay informed about further developments, trends, and reports in the Snacks Bar Market in Indonesia, consider subscribing to industry newsletters, following relevant companies and organizations, or regularly checking reputable industry news sources and publications.
Methodology
Step 1 - Identification of Relevant Samples Size from Population Database


Step 2 - Approaches for Defining Global Market Size (Value, Volume* & Price*)

Note*: In applicable scenarios
Step 3 - Data Sources
Primary Research
- Web Analytics
- Survey Reports
- Research Institute
- Latest Research Reports
- Opinion Leaders
Secondary Research
- Annual Reports
- White Paper
- Latest Press Release
- Industry Association
- Paid Database
- Investor Presentations

Step 4 - Data Triangulation
Involves using different sources of information in order to increase the validity of a study
These sources are likely to be stakeholders in a program - participants, other researchers, program staff, other community members, and so on.
Then we put all data in single framework & apply various statistical tools to find out the dynamic on the market.
During the analysis stage, feedback from the stakeholder groups would be compared to determine areas of agreement as well as areas of divergence


