
Key Insights
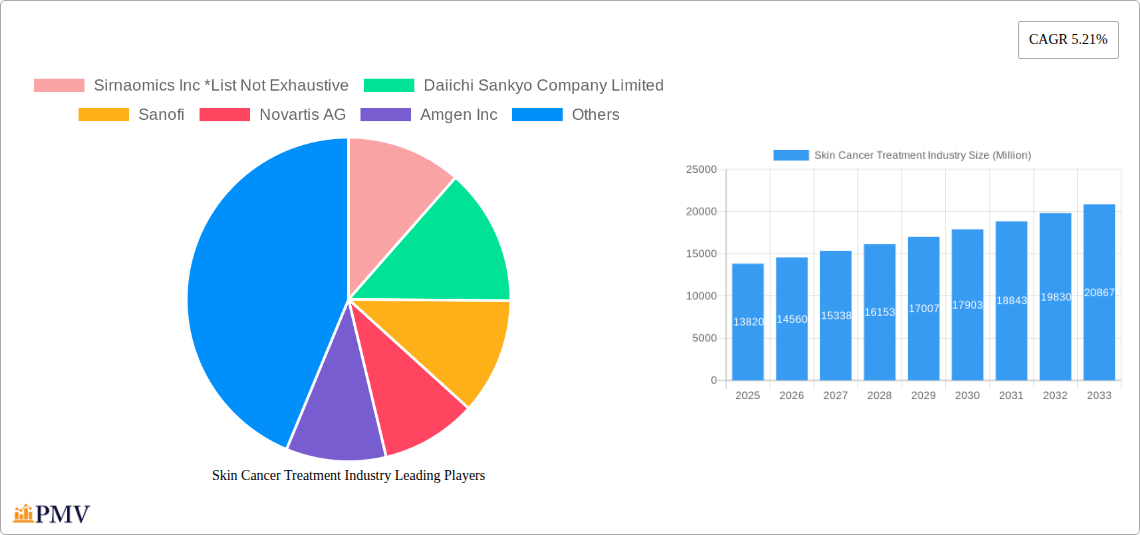
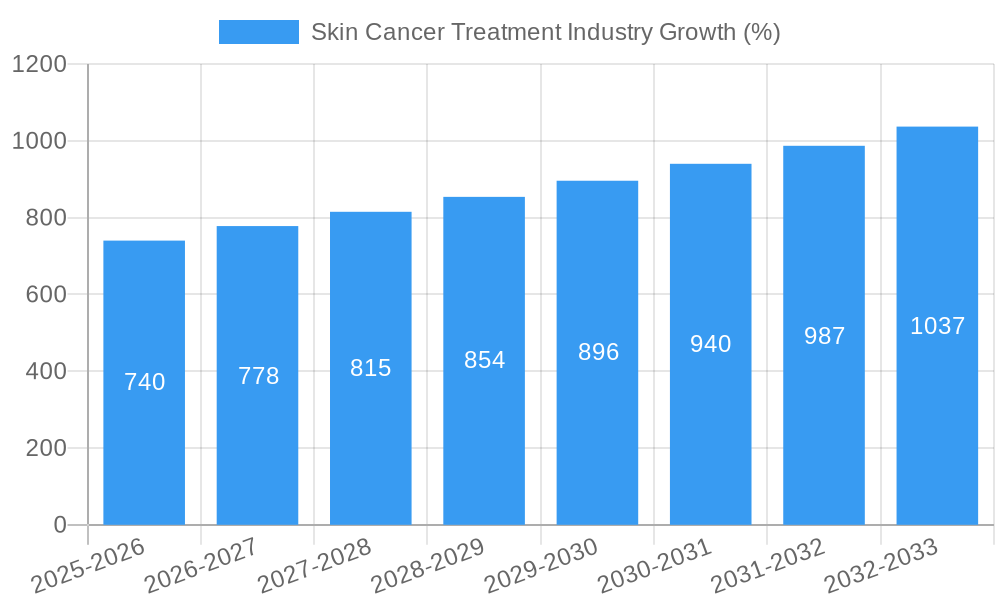
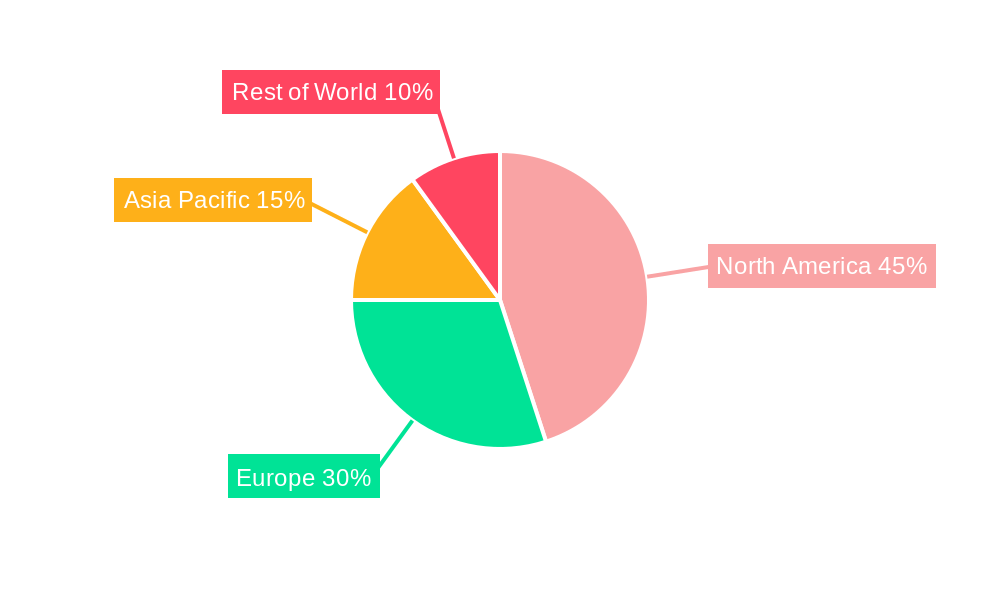
The global skin cancer treatment market, valued at $13.82 billion in 2025, is projected to experience robust growth, driven by rising skin cancer incidence rates worldwide, an aging population increasing susceptibility, and advancements in therapeutic options. The market's Compound Annual Growth Rate (CAGR) of 5.21% from 2025 to 2033 indicates a significant expansion over the forecast period. Key drivers include the increasing adoption of innovative therapies such as targeted therapies, immunotherapies, and advanced diagnostic tools improving early detection and personalized treatment approaches. Rising awareness campaigns and improved healthcare infrastructure in developing regions also contribute to market growth. However, the high cost of advanced treatments, stringent regulatory approvals, and potential side effects associated with certain therapies pose significant restraints. The market is segmented by cancer type (melanoma and non-melanoma), treatment type (diagnosis and therapeutics), and geography. Melanoma, a more aggressive form of skin cancer, commands a larger share of the market due to its higher treatment costs and complexity. North America, particularly the United States, holds a substantial market share due to high cancer prevalence, advanced healthcare infrastructure, and robust research and development activities. Europe and Asia-Pacific are also significant markets, demonstrating substantial growth potential driven by increasing awareness and rising healthcare expenditure. Major players like Amgen, Merck, Roche, and Novartis are actively involved in developing and marketing novel skin cancer treatments, fostering competition and innovation within the market. The increasing focus on personalized medicine and the development of more effective and less toxic treatment options are shaping the future landscape of this vital sector.
The therapeutic segment dominates the market due to the variety and complexity of treatments available for skin cancer. Within this, targeted therapies and immunotherapies are experiencing rapid growth, reflecting the continuous shift towards precision oncology. The diagnostic segment is also expanding due to the development of more sensitive and accurate diagnostic tests, allowing for earlier detection and improved patient outcomes. Regional variations are significant, with North America maintaining a dominant position owing to its robust healthcare system and advanced technological capabilities. However, emerging economies in Asia-Pacific are expected to witness considerable growth, driven by rising healthcare spending and growing awareness of skin cancer. Competition among key pharmaceutical companies is fierce, fueled by continuous research and development, strategic partnerships, and mergers and acquisitions, all working towards delivering more effective and accessible treatments for skin cancer patients.
Skin Cancer Treatment Industry Market Report: 2019-2033
This comprehensive report provides an in-depth analysis of the global skin cancer treatment industry, encompassing market size, segmentation, competitive landscape, and future growth projections. The study period covers 2019-2033, with a base year of 2025 and a forecast period of 2025-2033. The report is invaluable for industry stakeholders, investors, and researchers seeking actionable insights into this rapidly evolving market. The market value in 2025 is estimated at $XX Million.
Skin Cancer Treatment Industry Market Structure & Competitive Dynamics
The skin cancer treatment market is characterized by a moderately consolidated structure with several multinational pharmaceutical companies holding significant market share. Major players leverage extensive R&D capabilities and robust distribution networks to maintain their dominance. The market exhibits a dynamic competitive landscape fueled by continuous innovation, strategic mergers and acquisitions (M&A), and the introduction of novel therapies. The regulatory environment plays a crucial role, shaping product approvals and market access.
- Market Concentration: The top five players account for an estimated xx% of the global market share in 2025.
- Innovation Ecosystems: Significant investments in R&D are driving innovation in targeted therapies, immunotherapies, and diagnostic technologies.
- Regulatory Frameworks: Stringent regulatory approvals influence market entry and product lifecycles. Varying regulatory landscapes across different regions impact market growth.
- Product Substitutes: The availability of alternative treatment options and the emergence of generic drugs influence market competition.
- End-User Trends: Increasing awareness of skin cancer risks and advancements in treatment options drive market demand. The growing elderly population is a key factor contributing to this market growth.
- M&A Activities: The industry has witnessed numerous M&A deals in recent years, with deal values exceeding $XX Million in the past five years. These activities consolidate market share and accelerate the development of innovative therapies.
Skin Cancer Treatment Industry Industry Trends & Insights
The skin cancer treatment market is experiencing robust growth, driven by several key factors. The rising incidence of skin cancer globally, coupled with an aging population, fuels the demand for effective treatment options. Technological advancements in targeted therapies, immunotherapies, and diagnostic tools significantly enhance treatment outcomes and improve patient survival rates. Consumer preferences are shifting towards minimally invasive procedures and personalized treatment plans. Increased awareness campaigns and early detection initiatives contribute to improved patient diagnosis and timely intervention. The market is projected to witness a CAGR of xx% during the forecast period (2025-2033), with a substantial market penetration of new therapies. Competitive dynamics remain intense, with companies focused on research and development of novel treatment modalities.
Dominant Markets & Segments in Skin Cancer Treatment Industry
The North American region currently dominates the global skin cancer treatment market, driven by high healthcare expenditure, advanced medical infrastructure, and a high prevalence of skin cancer. The melanoma segment holds a significant market share due to its aggressive nature and the need for specialized treatments. Diagnostic technologies are also witnessing substantial growth, driven by advancements in early detection methods.
Key Drivers:
- High Prevalence of Skin Cancer: The increasing incidence of skin cancer, particularly melanoma, drives demand for effective treatment options.
- High Healthcare Expenditure: The US and other developed nations have high healthcare spending, facilitating investment in and access to advanced skin cancer treatments.
- Technological Advancements: Innovations in immunotherapy, targeted therapies, and diagnostic techniques are transforming the treatment landscape.
- Favorable Regulatory Environment: Approvals of new drugs and medical devices fuel market expansion.
Dominance Analysis:
North America's dominance is primarily attributed to its robust healthcare infrastructure, higher prevalence of skin cancer, and substantial investment in research and development. The melanoma segment's market leadership stems from the severity of the disease and the escalating need for specialized therapies. Similarly, advanced diagnostic technologies have garnered considerable attention, contributing significantly to the overall market growth.
Skin Cancer Treatment Industry Product Innovations
Recent advancements in immunotherapy, particularly checkpoint inhibitors, have revolutionized skin cancer treatment. Targeted therapies offer increased efficacy and reduced side effects compared to traditional chemotherapy. Innovative diagnostic tools enable early detection and personalized treatment strategies. These innovations are improving patient outcomes and transforming the treatment landscape, shaping future market growth.
Report Segmentation & Scope
The report segments the skin cancer treatment market based on cancer type (melanoma, non-melanoma), treatment type (diagnosis, therapeutics – including surgery, radiation therapy, chemotherapy, targeted therapy, immunotherapy), and geography.
- By Cancer Type: The melanoma segment is projected to witness higher growth due to its aggressive nature. The non-melanoma segment also represents a significant market opportunity.
- By Type: The therapeutics segment dominates the market, driven by the demand for various treatment options. The diagnosis segment is experiencing substantial growth due to technological advancements in early detection.
- By Geography: North America currently leads the market, but emerging economies are expected to show significant growth in the future.
Key Drivers of Skin Cancer Treatment Industry Growth
Several factors drive the growth of the skin cancer treatment industry, including:
- Rising Prevalence of Skin Cancer: Increasing incidence, particularly of melanoma.
- Technological Advancements: Development of innovative therapies like immunotherapy and targeted therapies.
- Increased Awareness and Early Detection: Public health campaigns and advanced diagnostic techniques.
- Growing Geriatric Population: The aging population is more susceptible to skin cancer.
- Favorable Regulatory Landscape: Approvals of new drugs and medical devices.
Challenges in the Skin Cancer Treatment Industry Sector
The skin cancer treatment market faces several challenges:
- High Treatment Costs: Advanced therapies can be expensive, limiting access for many patients.
- Drug Resistance: The development of resistance to existing therapies requires continuous innovation.
- Side Effects of Treatments: Immunotherapy and other treatments can have severe side effects.
- Complex Regulatory Landscape: Navigating the regulatory processes for drug approvals can be challenging.
Leading Players in the Skin Cancer Treatment Industry Market
- Sirnaomics Inc
- Daiichi Sankyo Company Limited
- Sanofi
- Novartis AG
- Amgen Inc
- Merck & Co Inc
- F Hoffmann-La Roche Ltd
- Abbott
- Labcorp
- Sun Pharmaceutical Industries Ltd
- QIAGEN
- Bristol-Myers Squibb Company
- Pfizer Inc
Key Developments in Skin Cancer Treatment Industry Sector
- March 2022: The FDA approved nivolumab and relatlimab-rmbw (Opdualag, Bristol-Myers Squibb Company) for adult and pediatric patients (12+) with unresectable or metastatic melanoma. This significantly impacted the melanoma treatment market.
- January 2022: SkinCure Oncology launched GentleCure.com, an educational platform for BCC and SCC treatments, influencing patient access to information and treatment options.
Strategic Skin Cancer Treatment Industry Market Outlook
The skin cancer treatment market exhibits significant growth potential driven by continued innovation in targeted therapies, immunotherapies, and diagnostic technologies. Strategic opportunities exist for companies focusing on personalized medicine, early detection, and improved patient access to affordable and effective treatments. The market's future is bright, with ongoing advancements promising improved patient outcomes and a larger market share.
Skin Cancer Treatment Industry Segmentation
-
1. Cancer Type
- 1.1. Melanoma
- 1.2. Non-melanoma
-
2. Type
-
2.1. Diagnosis
- 2.1.1. Dermatoscopy
- 2.1.2. Biopsy
- 2.1.3. Genetic Tests
- 2.1.4. Others
-
2.2. Therapeutics
- 2.2.1. Chemotherapy
- 2.2.2. Immunotherapy
- 2.2.3. Targeted Therapy
-
2.1. Diagnosis
Skin Cancer Treatment Industry Segmentation By Geography
-
1. North America
- 1.1. United States
- 1.2. Canada
- 1.3. Mexico
-
2. Europe
- 2.1. Germany
- 2.2. United Kingdom
- 2.3. France
- 2.4. Italy
- 2.5. Spain
- 2.6. Rest of Europe
-
3. Asia Pacific
- 3.1. China
- 3.2. Japan
- 3.3. India
- 3.4. Australia
- 3.5. South Korea
- 3.6. Rest of Asia Pacific
-
4. Middle East and Africa
- 4.1. GCC
- 4.2. South Africa
- 4.3. Rest of Middle East and Africa
-
5. South America
- 5.1. Brazil
- 5.2. Argentina
- 5.3. Rest of South America
Skin Cancer Treatment Industry REPORT HIGHLIGHTS
| Aspects | Details |
|---|---|
| Study Period | 2019-2033 |
| Base Year | 2024 |
| Estimated Year | 2025 |
| Forecast Period | 2025-2033 |
| Historical Period | 2019-2024 |
| Growth Rate | CAGR of 5.21% from 2019-2033 |
| Segmentation |
|
Table of Contents
- 1. Introduction
- 1.1. Research Scope
- 1.2. Market Segmentation
- 1.3. Research Methodology
- 1.4. Definitions and Assumptions
- 2. Executive Summary
- 2.1. Introduction
- 3. Market Dynamics
- 3.1. Introduction
- 3.2. Market Drivers
- 3.2.1. Increasing Incidence of Skin Cancer; Rising Awareness About Skin Cancer; Extensive Research and Developments
- 3.3. Market Restrains
- 3.3.1. High Cost Associated with Therapy; Stringent Regulatory Framework
- 3.4. Market Trends
- 3.4.1. Non-Melanoma by Cancer Type Segment is Expected to Grow Over the Forecast Period
- 4. Market Factor Analysis
- 4.1. Porters Five Forces
- 4.2. Supply/Value Chain
- 4.3. PESTEL analysis
- 4.4. Market Entropy
- 4.5. Patent/Trademark Analysis
- 5. Global Skin Cancer Treatment Industry Analysis, Insights and Forecast, 2019-2031
- 5.1. Market Analysis, Insights and Forecast - by Cancer Type
- 5.1.1. Melanoma
- 5.1.2. Non-melanoma
- 5.2. Market Analysis, Insights and Forecast - by Type
- 5.2.1. Diagnosis
- 5.2.1.1. Dermatoscopy
- 5.2.1.2. Biopsy
- 5.2.1.3. Genetic Tests
- 5.2.1.4. Others
- 5.2.2. Therapeutics
- 5.2.2.1. Chemotherapy
- 5.2.2.2. Immunotherapy
- 5.2.2.3. Targeted Therapy
- 5.2.1. Diagnosis
- 5.3. Market Analysis, Insights and Forecast - by Region
- 5.3.1. North America
- 5.3.2. Europe
- 5.3.3. Asia Pacific
- 5.3.4. Middle East and Africa
- 5.3.5. South America
- 5.1. Market Analysis, Insights and Forecast - by Cancer Type
- 6. North America Skin Cancer Treatment Industry Analysis, Insights and Forecast, 2019-2031
- 6.1. Market Analysis, Insights and Forecast - by Cancer Type
- 6.1.1. Melanoma
- 6.1.2. Non-melanoma
- 6.2. Market Analysis, Insights and Forecast - by Type
- 6.2.1. Diagnosis
- 6.2.1.1. Dermatoscopy
- 6.2.1.2. Biopsy
- 6.2.1.3. Genetic Tests
- 6.2.1.4. Others
- 6.2.2. Therapeutics
- 6.2.2.1. Chemotherapy
- 6.2.2.2. Immunotherapy
- 6.2.2.3. Targeted Therapy
- 6.2.1. Diagnosis
- 6.1. Market Analysis, Insights and Forecast - by Cancer Type
- 7. Europe Skin Cancer Treatment Industry Analysis, Insights and Forecast, 2019-2031
- 7.1. Market Analysis, Insights and Forecast - by Cancer Type
- 7.1.1. Melanoma
- 7.1.2. Non-melanoma
- 7.2. Market Analysis, Insights and Forecast - by Type
- 7.2.1. Diagnosis
- 7.2.1.1. Dermatoscopy
- 7.2.1.2. Biopsy
- 7.2.1.3. Genetic Tests
- 7.2.1.4. Others
- 7.2.2. Therapeutics
- 7.2.2.1. Chemotherapy
- 7.2.2.2. Immunotherapy
- 7.2.2.3. Targeted Therapy
- 7.2.1. Diagnosis
- 7.1. Market Analysis, Insights and Forecast - by Cancer Type
- 8. Asia Pacific Skin Cancer Treatment Industry Analysis, Insights and Forecast, 2019-2031
- 8.1. Market Analysis, Insights and Forecast - by Cancer Type
- 8.1.1. Melanoma
- 8.1.2. Non-melanoma
- 8.2. Market Analysis, Insights and Forecast - by Type
- 8.2.1. Diagnosis
- 8.2.1.1. Dermatoscopy
- 8.2.1.2. Biopsy
- 8.2.1.3. Genetic Tests
- 8.2.1.4. Others
- 8.2.2. Therapeutics
- 8.2.2.1. Chemotherapy
- 8.2.2.2. Immunotherapy
- 8.2.2.3. Targeted Therapy
- 8.2.1. Diagnosis
- 8.1. Market Analysis, Insights and Forecast - by Cancer Type
- 9. Middle East and Africa Skin Cancer Treatment Industry Analysis, Insights and Forecast, 2019-2031
- 9.1. Market Analysis, Insights and Forecast - by Cancer Type
- 9.1.1. Melanoma
- 9.1.2. Non-melanoma
- 9.2. Market Analysis, Insights and Forecast - by Type
- 9.2.1. Diagnosis
- 9.2.1.1. Dermatoscopy
- 9.2.1.2. Biopsy
- 9.2.1.3. Genetic Tests
- 9.2.1.4. Others
- 9.2.2. Therapeutics
- 9.2.2.1. Chemotherapy
- 9.2.2.2. Immunotherapy
- 9.2.2.3. Targeted Therapy
- 9.2.1. Diagnosis
- 9.1. Market Analysis, Insights and Forecast - by Cancer Type
- 10. South America Skin Cancer Treatment Industry Analysis, Insights and Forecast, 2019-2031
- 10.1. Market Analysis, Insights and Forecast - by Cancer Type
- 10.1.1. Melanoma
- 10.1.2. Non-melanoma
- 10.2. Market Analysis, Insights and Forecast - by Type
- 10.2.1. Diagnosis
- 10.2.1.1. Dermatoscopy
- 10.2.1.2. Biopsy
- 10.2.1.3. Genetic Tests
- 10.2.1.4. Others
- 10.2.2. Therapeutics
- 10.2.2.1. Chemotherapy
- 10.2.2.2. Immunotherapy
- 10.2.2.3. Targeted Therapy
- 10.2.1. Diagnosis
- 10.1. Market Analysis, Insights and Forecast - by Cancer Type
- 11. North Americ Skin Cancer Treatment Industry Analysis, Insights and Forecast, 2019-2031
- 11.1. Market Analysis, Insights and Forecast - By Country/Sub-region
- 11.1.1 United States
- 11.1.2 Canada
- 11.1.3 Mexico
- 12. South America Skin Cancer Treatment Industry Analysis, Insights and Forecast, 2019-2031
- 12.1. Market Analysis, Insights and Forecast - By Country/Sub-region
- 12.1.1 Brazil
- 12.1.2 Mexico
- 12.1.3 Rest of South America
- 13. Europe Skin Cancer Treatment Industry Analysis, Insights and Forecast, 2019-2031
- 13.1. Market Analysis, Insights and Forecast - By Country/Sub-region
- 13.1.1 Germany
- 13.1.2 United Kingdom
- 13.1.3 France
- 13.1.4 Italy
- 13.1.5 Spain
- 13.1.6 Rest of Europe
- 14. Asia Pacific Skin Cancer Treatment Industry Analysis, Insights and Forecast, 2019-2031
- 14.1. Market Analysis, Insights and Forecast - By Country/Sub-region
- 14.1.1 China
- 14.1.2 Japan
- 14.1.3 India
- 14.1.4 South Korea
- 14.1.5 Taiwan
- 14.1.6 Australia
- 14.1.7 Rest of Asia-Pacific
- 15. MEA Skin Cancer Treatment Industry Analysis, Insights and Forecast, 2019-2031
- 15.1. Market Analysis, Insights and Forecast - By Country/Sub-region
- 15.1.1 Middle East
- 15.1.2 Africa
- 16. Competitive Analysis
- 16.1. Global Market Share Analysis 2024
- 16.2. Company Profiles
- 16.2.1 Sirnaomics Inc *List Not Exhaustive
- 16.2.1.1. Overview
- 16.2.1.2. Products
- 16.2.1.3. SWOT Analysis
- 16.2.1.4. Recent Developments
- 16.2.1.5. Financials (Based on Availability)
- 16.2.2 Daiichi Sankyo Company Limited
- 16.2.2.1. Overview
- 16.2.2.2. Products
- 16.2.2.3. SWOT Analysis
- 16.2.2.4. Recent Developments
- 16.2.2.5. Financials (Based on Availability)
- 16.2.3 Sanofi
- 16.2.3.1. Overview
- 16.2.3.2. Products
- 16.2.3.3. SWOT Analysis
- 16.2.3.4. Recent Developments
- 16.2.3.5. Financials (Based on Availability)
- 16.2.4 Novartis AG
- 16.2.4.1. Overview
- 16.2.4.2. Products
- 16.2.4.3. SWOT Analysis
- 16.2.4.4. Recent Developments
- 16.2.4.5. Financials (Based on Availability)
- 16.2.5 Amgen Inc
- 16.2.5.1. Overview
- 16.2.5.2. Products
- 16.2.5.3. SWOT Analysis
- 16.2.5.4. Recent Developments
- 16.2.5.5. Financials (Based on Availability)
- 16.2.6 Merck & Co Inc
- 16.2.6.1. Overview
- 16.2.6.2. Products
- 16.2.6.3. SWOT Analysis
- 16.2.6.4. Recent Developments
- 16.2.6.5. Financials (Based on Availability)
- 16.2.7 F Hoffmann-La Roche Ltd
- 16.2.7.1. Overview
- 16.2.7.2. Products
- 16.2.7.3. SWOT Analysis
- 16.2.7.4. Recent Developments
- 16.2.7.5. Financials (Based on Availability)
- 16.2.8 Abbott
- 16.2.8.1. Overview
- 16.2.8.2. Products
- 16.2.8.3. SWOT Analysis
- 16.2.8.4. Recent Developments
- 16.2.8.5. Financials (Based on Availability)
- 16.2.9 Labcorp
- 16.2.9.1. Overview
- 16.2.9.2. Products
- 16.2.9.3. SWOT Analysis
- 16.2.9.4. Recent Developments
- 16.2.9.5. Financials (Based on Availability)
- 16.2.10 Sun Pharmaceutical Industries Ltd
- 16.2.10.1. Overview
- 16.2.10.2. Products
- 16.2.10.3. SWOT Analysis
- 16.2.10.4. Recent Developments
- 16.2.10.5. Financials (Based on Availability)
- 16.2.11 QIAGEN
- 16.2.11.1. Overview
- 16.2.11.2. Products
- 16.2.11.3. SWOT Analysis
- 16.2.11.4. Recent Developments
- 16.2.11.5. Financials (Based on Availability)
- 16.2.12 Bristol-Myers Squibb Company
- 16.2.12.1. Overview
- 16.2.12.2. Products
- 16.2.12.3. SWOT Analysis
- 16.2.12.4. Recent Developments
- 16.2.12.5. Financials (Based on Availability)
- 16.2.13 Pfizer Inc
- 16.2.13.1. Overview
- 16.2.13.2. Products
- 16.2.13.3. SWOT Analysis
- 16.2.13.4. Recent Developments
- 16.2.13.5. Financials (Based on Availability)
- 16.2.1 Sirnaomics Inc *List Not Exhaustive
List of Figures
- Figure 1: Global Skin Cancer Treatment Industry Revenue Breakdown (Million, %) by Region 2024 & 2032
- Figure 2: North Americ Skin Cancer Treatment Industry Revenue (Million), by Country 2024 & 2032
- Figure 3: North Americ Skin Cancer Treatment Industry Revenue Share (%), by Country 2024 & 2032
- Figure 4: South America Skin Cancer Treatment Industry Revenue (Million), by Country 2024 & 2032
- Figure 5: South America Skin Cancer Treatment Industry Revenue Share (%), by Country 2024 & 2032
- Figure 6: Europe Skin Cancer Treatment Industry Revenue (Million), by Country 2024 & 2032
- Figure 7: Europe Skin Cancer Treatment Industry Revenue Share (%), by Country 2024 & 2032
- Figure 8: Asia Pacific Skin Cancer Treatment Industry Revenue (Million), by Country 2024 & 2032
- Figure 9: Asia Pacific Skin Cancer Treatment Industry Revenue Share (%), by Country 2024 & 2032
- Figure 10: MEA Skin Cancer Treatment Industry Revenue (Million), by Country 2024 & 2032
- Figure 11: MEA Skin Cancer Treatment Industry Revenue Share (%), by Country 2024 & 2032
- Figure 12: North America Skin Cancer Treatment Industry Revenue (Million), by Cancer Type 2024 & 2032
- Figure 13: North America Skin Cancer Treatment Industry Revenue Share (%), by Cancer Type 2024 & 2032
- Figure 14: North America Skin Cancer Treatment Industry Revenue (Million), by Type 2024 & 2032
- Figure 15: North America Skin Cancer Treatment Industry Revenue Share (%), by Type 2024 & 2032
- Figure 16: North America Skin Cancer Treatment Industry Revenue (Million), by Country 2024 & 2032
- Figure 17: North America Skin Cancer Treatment Industry Revenue Share (%), by Country 2024 & 2032
- Figure 18: Europe Skin Cancer Treatment Industry Revenue (Million), by Cancer Type 2024 & 2032
- Figure 19: Europe Skin Cancer Treatment Industry Revenue Share (%), by Cancer Type 2024 & 2032
- Figure 20: Europe Skin Cancer Treatment Industry Revenue (Million), by Type 2024 & 2032
- Figure 21: Europe Skin Cancer Treatment Industry Revenue Share (%), by Type 2024 & 2032
- Figure 22: Europe Skin Cancer Treatment Industry Revenue (Million), by Country 2024 & 2032
- Figure 23: Europe Skin Cancer Treatment Industry Revenue Share (%), by Country 2024 & 2032
- Figure 24: Asia Pacific Skin Cancer Treatment Industry Revenue (Million), by Cancer Type 2024 & 2032
- Figure 25: Asia Pacific Skin Cancer Treatment Industry Revenue Share (%), by Cancer Type 2024 & 2032
- Figure 26: Asia Pacific Skin Cancer Treatment Industry Revenue (Million), by Type 2024 & 2032
- Figure 27: Asia Pacific Skin Cancer Treatment Industry Revenue Share (%), by Type 2024 & 2032
- Figure 28: Asia Pacific Skin Cancer Treatment Industry Revenue (Million), by Country 2024 & 2032
- Figure 29: Asia Pacific Skin Cancer Treatment Industry Revenue Share (%), by Country 2024 & 2032
- Figure 30: Middle East and Africa Skin Cancer Treatment Industry Revenue (Million), by Cancer Type 2024 & 2032
- Figure 31: Middle East and Africa Skin Cancer Treatment Industry Revenue Share (%), by Cancer Type 2024 & 2032
- Figure 32: Middle East and Africa Skin Cancer Treatment Industry Revenue (Million), by Type 2024 & 2032
- Figure 33: Middle East and Africa Skin Cancer Treatment Industry Revenue Share (%), by Type 2024 & 2032
- Figure 34: Middle East and Africa Skin Cancer Treatment Industry Revenue (Million), by Country 2024 & 2032
- Figure 35: Middle East and Africa Skin Cancer Treatment Industry Revenue Share (%), by Country 2024 & 2032
- Figure 36: South America Skin Cancer Treatment Industry Revenue (Million), by Cancer Type 2024 & 2032
- Figure 37: South America Skin Cancer Treatment Industry Revenue Share (%), by Cancer Type 2024 & 2032
- Figure 38: South America Skin Cancer Treatment Industry Revenue (Million), by Type 2024 & 2032
- Figure 39: South America Skin Cancer Treatment Industry Revenue Share (%), by Type 2024 & 2032
- Figure 40: South America Skin Cancer Treatment Industry Revenue (Million), by Country 2024 & 2032
- Figure 41: South America Skin Cancer Treatment Industry Revenue Share (%), by Country 2024 & 2032
List of Tables
- Table 1: Global Skin Cancer Treatment Industry Revenue Million Forecast, by Region 2019 & 2032
- Table 2: Global Skin Cancer Treatment Industry Revenue Million Forecast, by Cancer Type 2019 & 2032
- Table 3: Global Skin Cancer Treatment Industry Revenue Million Forecast, by Type 2019 & 2032
- Table 4: Global Skin Cancer Treatment Industry Revenue Million Forecast, by Region 2019 & 2032
- Table 5: Global Skin Cancer Treatment Industry Revenue Million Forecast, by Country 2019 & 2032
- Table 6: United States Skin Cancer Treatment Industry Revenue (Million) Forecast, by Application 2019 & 2032
- Table 7: Canada Skin Cancer Treatment Industry Revenue (Million) Forecast, by Application 2019 & 2032
- Table 8: Mexico Skin Cancer Treatment Industry Revenue (Million) Forecast, by Application 2019 & 2032
- Table 9: Global Skin Cancer Treatment Industry Revenue Million Forecast, by Country 2019 & 2032
- Table 10: Brazil Skin Cancer Treatment Industry Revenue (Million) Forecast, by Application 2019 & 2032
- Table 11: Mexico Skin Cancer Treatment Industry Revenue (Million) Forecast, by Application 2019 & 2032
- Table 12: Rest of South America Skin Cancer Treatment Industry Revenue (Million) Forecast, by Application 2019 & 2032
- Table 13: Global Skin Cancer Treatment Industry Revenue Million Forecast, by Country 2019 & 2032
- Table 14: Germany Skin Cancer Treatment Industry Revenue (Million) Forecast, by Application 2019 & 2032
- Table 15: United Kingdom Skin Cancer Treatment Industry Revenue (Million) Forecast, by Application 2019 & 2032
- Table 16: France Skin Cancer Treatment Industry Revenue (Million) Forecast, by Application 2019 & 2032
- Table 17: Italy Skin Cancer Treatment Industry Revenue (Million) Forecast, by Application 2019 & 2032
- Table 18: Spain Skin Cancer Treatment Industry Revenue (Million) Forecast, by Application 2019 & 2032
- Table 19: Rest of Europe Skin Cancer Treatment Industry Revenue (Million) Forecast, by Application 2019 & 2032
- Table 20: Global Skin Cancer Treatment Industry Revenue Million Forecast, by Country 2019 & 2032
- Table 21: China Skin Cancer Treatment Industry Revenue (Million) Forecast, by Application 2019 & 2032
- Table 22: Japan Skin Cancer Treatment Industry Revenue (Million) Forecast, by Application 2019 & 2032
- Table 23: India Skin Cancer Treatment Industry Revenue (Million) Forecast, by Application 2019 & 2032
- Table 24: South Korea Skin Cancer Treatment Industry Revenue (Million) Forecast, by Application 2019 & 2032
- Table 25: Taiwan Skin Cancer Treatment Industry Revenue (Million) Forecast, by Application 2019 & 2032
- Table 26: Australia Skin Cancer Treatment Industry Revenue (Million) Forecast, by Application 2019 & 2032
- Table 27: Rest of Asia-Pacific Skin Cancer Treatment Industry Revenue (Million) Forecast, by Application 2019 & 2032
- Table 28: Global Skin Cancer Treatment Industry Revenue Million Forecast, by Country 2019 & 2032
- Table 29: Middle East Skin Cancer Treatment Industry Revenue (Million) Forecast, by Application 2019 & 2032
- Table 30: Africa Skin Cancer Treatment Industry Revenue (Million) Forecast, by Application 2019 & 2032
- Table 31: Global Skin Cancer Treatment Industry Revenue Million Forecast, by Cancer Type 2019 & 2032
- Table 32: Global Skin Cancer Treatment Industry Revenue Million Forecast, by Type 2019 & 2032
- Table 33: Global Skin Cancer Treatment Industry Revenue Million Forecast, by Country 2019 & 2032
- Table 34: United States Skin Cancer Treatment Industry Revenue (Million) Forecast, by Application 2019 & 2032
- Table 35: Canada Skin Cancer Treatment Industry Revenue (Million) Forecast, by Application 2019 & 2032
- Table 36: Mexico Skin Cancer Treatment Industry Revenue (Million) Forecast, by Application 2019 & 2032
- Table 37: Global Skin Cancer Treatment Industry Revenue Million Forecast, by Cancer Type 2019 & 2032
- Table 38: Global Skin Cancer Treatment Industry Revenue Million Forecast, by Type 2019 & 2032
- Table 39: Global Skin Cancer Treatment Industry Revenue Million Forecast, by Country 2019 & 2032
- Table 40: Germany Skin Cancer Treatment Industry Revenue (Million) Forecast, by Application 2019 & 2032
- Table 41: United Kingdom Skin Cancer Treatment Industry Revenue (Million) Forecast, by Application 2019 & 2032
- Table 42: France Skin Cancer Treatment Industry Revenue (Million) Forecast, by Application 2019 & 2032
- Table 43: Italy Skin Cancer Treatment Industry Revenue (Million) Forecast, by Application 2019 & 2032
- Table 44: Spain Skin Cancer Treatment Industry Revenue (Million) Forecast, by Application 2019 & 2032
- Table 45: Rest of Europe Skin Cancer Treatment Industry Revenue (Million) Forecast, by Application 2019 & 2032
- Table 46: Global Skin Cancer Treatment Industry Revenue Million Forecast, by Cancer Type 2019 & 2032
- Table 47: Global Skin Cancer Treatment Industry Revenue Million Forecast, by Type 2019 & 2032
- Table 48: Global Skin Cancer Treatment Industry Revenue Million Forecast, by Country 2019 & 2032
- Table 49: China Skin Cancer Treatment Industry Revenue (Million) Forecast, by Application 2019 & 2032
- Table 50: Japan Skin Cancer Treatment Industry Revenue (Million) Forecast, by Application 2019 & 2032
- Table 51: India Skin Cancer Treatment Industry Revenue (Million) Forecast, by Application 2019 & 2032
- Table 52: Australia Skin Cancer Treatment Industry Revenue (Million) Forecast, by Application 2019 & 2032
- Table 53: South Korea Skin Cancer Treatment Industry Revenue (Million) Forecast, by Application 2019 & 2032
- Table 54: Rest of Asia Pacific Skin Cancer Treatment Industry Revenue (Million) Forecast, by Application 2019 & 2032
- Table 55: Global Skin Cancer Treatment Industry Revenue Million Forecast, by Cancer Type 2019 & 2032
- Table 56: Global Skin Cancer Treatment Industry Revenue Million Forecast, by Type 2019 & 2032
- Table 57: Global Skin Cancer Treatment Industry Revenue Million Forecast, by Country 2019 & 2032
- Table 58: GCC Skin Cancer Treatment Industry Revenue (Million) Forecast, by Application 2019 & 2032
- Table 59: South Africa Skin Cancer Treatment Industry Revenue (Million) Forecast, by Application 2019 & 2032
- Table 60: Rest of Middle East and Africa Skin Cancer Treatment Industry Revenue (Million) Forecast, by Application 2019 & 2032
- Table 61: Global Skin Cancer Treatment Industry Revenue Million Forecast, by Cancer Type 2019 & 2032
- Table 62: Global Skin Cancer Treatment Industry Revenue Million Forecast, by Type 2019 & 2032
- Table 63: Global Skin Cancer Treatment Industry Revenue Million Forecast, by Country 2019 & 2032
- Table 64: Brazil Skin Cancer Treatment Industry Revenue (Million) Forecast, by Application 2019 & 2032
- Table 65: Argentina Skin Cancer Treatment Industry Revenue (Million) Forecast, by Application 2019 & 2032
- Table 66: Rest of South America Skin Cancer Treatment Industry Revenue (Million) Forecast, by Application 2019 & 2032
Frequently Asked Questions
1. What is the projected Compound Annual Growth Rate (CAGR) of the Skin Cancer Treatment Industry?
The projected CAGR is approximately 5.21%.
2. Which companies are prominent players in the Skin Cancer Treatment Industry?
Key companies in the market include Sirnaomics Inc *List Not Exhaustive, Daiichi Sankyo Company Limited, Sanofi, Novartis AG, Amgen Inc, Merck & Co Inc, F Hoffmann-La Roche Ltd, Abbott, Labcorp, Sun Pharmaceutical Industries Ltd, QIAGEN, Bristol-Myers Squibb Company, Pfizer Inc.
3. What are the main segments of the Skin Cancer Treatment Industry?
The market segments include Cancer Type, Type.
4. Can you provide details about the market size?
The market size is estimated to be USD 13.82 Million as of 2022.
5. What are some drivers contributing to market growth?
Increasing Incidence of Skin Cancer; Rising Awareness About Skin Cancer; Extensive Research and Developments.
6. What are the notable trends driving market growth?
Non-Melanoma by Cancer Type Segment is Expected to Grow Over the Forecast Period.
7. Are there any restraints impacting market growth?
High Cost Associated with Therapy; Stringent Regulatory Framework.
8. Can you provide examples of recent developments in the market?
In March 2022, the United States Food and Drug Administration approved nivolumab and relatlimab-rmbw (Opdualag, Bristol-Myers Squibb Company) for adult and pediatric patients 12 years of age or older with unresectable or metastatic melanoma. Opdualag is a fixed-dose combination of the LAG-3-blocking antibody relatlimab and the programmed death receptor-1 blocking antibody nivolumab.
9. What pricing options are available for accessing the report?
Pricing options include single-user, multi-user, and enterprise licenses priced at USD 4750, USD 5250, and USD 8750 respectively.
10. Is the market size provided in terms of value or volume?
The market size is provided in terms of value, measured in Million.
11. Are there any specific market keywords associated with the report?
Yes, the market keyword associated with the report is "Skin Cancer Treatment Industry," which aids in identifying and referencing the specific market segment covered.
12. How do I determine which pricing option suits my needs best?
The pricing options vary based on user requirements and access needs. Individual users may opt for single-user licenses, while businesses requiring broader access may choose multi-user or enterprise licenses for cost-effective access to the report.
13. Are there any additional resources or data provided in the Skin Cancer Treatment Industry report?
While the report offers comprehensive insights, it's advisable to review the specific contents or supplementary materials provided to ascertain if additional resources or data are available.
14. How can I stay updated on further developments or reports in the Skin Cancer Treatment Industry?
To stay informed about further developments, trends, and reports in the Skin Cancer Treatment Industry, consider subscribing to industry newsletters, following relevant companies and organizations, or regularly checking reputable industry news sources and publications.
Methodology
Step 1 - Identification of Relevant Samples Size from Population Database


Step 2 - Approaches for Defining Global Market Size (Value, Volume* & Price*)

Note*: In applicable scenarios
Step 3 - Data Sources
Primary Research
- Web Analytics
- Survey Reports
- Research Institute
- Latest Research Reports
- Opinion Leaders
Secondary Research
- Annual Reports
- White Paper
- Latest Press Release
- Industry Association
- Paid Database
- Investor Presentations

Step 4 - Data Triangulation
Involves using different sources of information in order to increase the validity of a study
These sources are likely to be stakeholders in a program - participants, other researchers, program staff, other community members, and so on.
Then we put all data in single framework & apply various statistical tools to find out the dynamic on the market.
During the analysis stage, feedback from the stakeholder groups would be compared to determine areas of agreement as well as areas of divergence


