
Key Insights
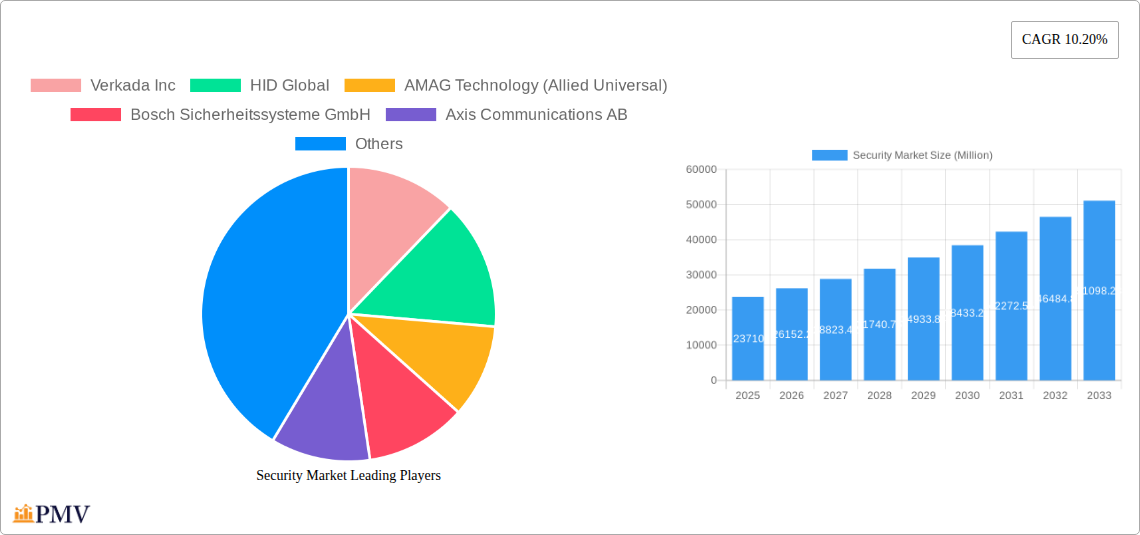
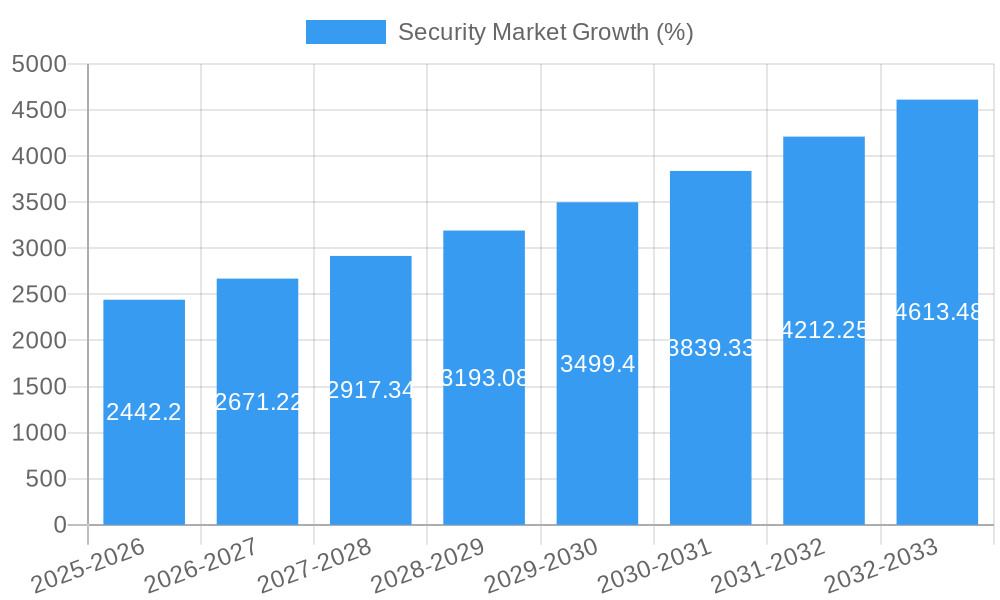
The global security market, valued at $23.71 billion in 2025, is projected to experience robust growth, exhibiting a compound annual growth rate (CAGR) of 10.20% from 2025 to 2033. This expansion is fueled by several key drivers. Increasing cyber threats and data breaches are compelling organizations across diverse sectors—from finance and healthcare to government and education—to bolster their security infrastructure. The rising adoption of cloud-based security solutions, offering enhanced scalability and accessibility, further contributes to market growth. Furthermore, the growing integration of artificial intelligence (AI) and machine learning (ML) in security systems, enabling proactive threat detection and response, is a significant catalyst. Government regulations mandating robust security protocols across industries also play a crucial role. Market trends indicate a shift towards integrated security solutions that combine physical and cybersecurity measures, offering comprehensive protection. The market also witnesses the emergence of innovative technologies like behavioral biometrics and advanced threat intelligence platforms. While factors like high initial investment costs for advanced security systems and the complexity of integrating disparate systems might present some restraints, the overall market trajectory remains highly positive.
The competitive landscape is shaped by a mix of established players and emerging technology companies. Key players like Verkada, HID Global, AMAG Technology, Bosch, Axis Communications, Honeywell, Johnson Controls, ADT, Securitas Technology, Assa Abloy, Genetec, Palo Alto Networks, Fortinet, IBM, and Cisco are actively engaged in developing and deploying cutting-edge security solutions. Their strategies include strategic acquisitions, partnerships, and continuous product innovation to maintain market share and cater to evolving customer needs. The market is segmented by solution type (e.g., video surveillance, access control, intrusion detection), deployment type (cloud-based, on-premise), and end-user industry (e.g., government, healthcare, finance). Future growth will be significantly influenced by the advancement of IoT security, the proliferation of edge computing for faster response times, and the increasing demand for robust security solutions in the face of sophisticated cyberattacks. The market's continued expansion hinges on the ability of security providers to adapt to these evolving technological advancements and customer requirements.
Security Market: A Comprehensive Report (2019-2033)
This in-depth report provides a comprehensive analysis of the global Security Market, offering invaluable insights for industry stakeholders, investors, and strategic decision-makers. With a study period spanning 2019-2033, a base year of 2025, and a forecast period of 2025-2033, this report delves into market dynamics, competitive landscapes, and future growth projections. The report meticulously examines market sizing, segmentation, key players, and emerging trends, providing actionable intelligence for navigating the evolving security landscape. The total market size is projected to reach xx Million by 2033.
Security Market Structure & Competitive Dynamics
The Security Market exhibits a moderately concentrated structure, with several key players dominating specific segments. Market share is distributed among established players like Honeywell International Inc., Johnson Controls, and ADT Inc., alongside emerging technology companies such as Verkada Inc. and Palo Alto Networks. Innovation ecosystems are highly dynamic, driven by advancements in AI, IoT, and cloud computing. Regulatory frameworks, such as GDPR and CCPA, significantly influence market practices and product development. Product substitutes, such as traditional security systems, face increasing competition from technologically advanced solutions. End-user trends reflect a growing preference for integrated, AI-powered security solutions.
- Market Concentration: High (xx%) in certain segments, moderate overall.
- M&A Activity: Significant activity observed in the historical period (2019-2024), with deal values totaling xx Million. Consolidation is expected to continue, driven by the need for expanded capabilities and market reach. Examples include [Insert specific M&A examples if available, otherwise state “Specific examples not available for disclosure.”]
- Innovation Ecosystems: Flourishing, with startups and established players collaborating to drive technological advancements.
- Regulatory Frameworks: Stringent data privacy regulations influence product development and data handling practices.
Security Market Industry Trends & Insights
The Security Market is experiencing robust growth, driven by factors such as rising cyber threats, increasing government investments in security infrastructure, and the proliferation of smart devices. The Compound Annual Growth Rate (CAGR) is estimated at xx% during the forecast period (2025-2033). Technological disruptions, including the integration of AI and IoT, are transforming security solutions, making them more intelligent and proactive. Consumer preferences are shifting towards user-friendly, cloud-based, and integrated security systems. Competitive dynamics are characterized by intense innovation and strategic partnerships to enhance product offerings and expand market reach. Market penetration of smart security systems is projected to reach xx% by 2033.
Dominant Markets & Segments in Security Market
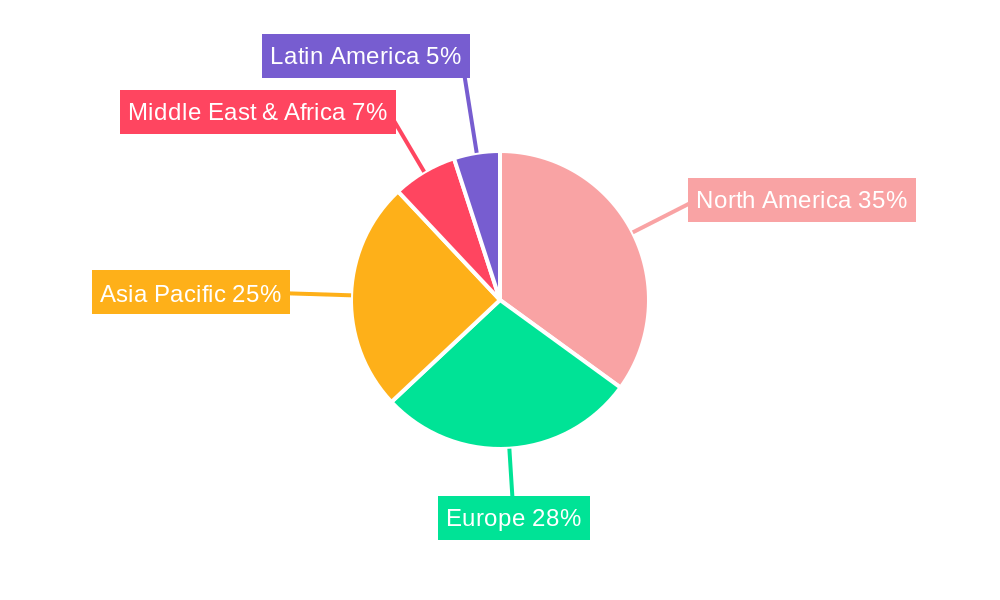
The North American region holds a dominant position in the Security Market, driven by factors such as robust economic conditions, advanced technological infrastructure, and high adoption rates of security solutions. The United States, in particular, leads the market owing to its large market size, strong investments in cybersecurity, and the presence of major technology companies.
- Key Drivers in North America:
- Robust economic growth fueling investment in security infrastructure.
- High adoption rates of advanced security technologies.
- Stringent regulatory frameworks driving demand for robust security solutions.
- Well-developed IT infrastructure supporting the deployment of advanced security systems.
The dominance of North America is likely to persist due to continuous investment in security systems across various sectors and the growing awareness of cyber threats. Other regions, such as Europe and Asia-Pacific, exhibit significant growth potential, driven by rising urbanization and increased government spending on security infrastructure.
Security Market Product Innovations
Recent product innovations include the integration of AI for threat detection and response, the use of IoT devices for enhanced surveillance and access control, and the development of cloud-based security management platforms. These innovations are enhancing the efficiency, scalability, and overall effectiveness of security solutions. The market is witnessing a trend towards integrated platforms combining various security functions, such as video surveillance, access control, and intrusion detection, under a single management interface. This trend simplifies deployment and management for end-users.
Report Segmentation & Scope
The Security Market is segmented based on several key factors:
By Product Type: This segment includes video surveillance, access control, intrusion detection, fire detection, and other security systems. Each segment exhibits distinct growth projections and competitive dynamics. The video surveillance segment is expected to witness the highest growth due to increasing adoption of IP cameras and advanced video analytics.
By End-User: This segment includes residential, commercial, industrial, and governmental sectors. The commercial sector is expected to dominate, driven by the need for comprehensive security solutions in large organizations.
By Technology: This includes traditional security technologies and advanced technologies such as AI, IoT, and cloud computing.
By Region: This segment covers North America, Europe, Asia-Pacific, Middle East & Africa, and South America.
Key Drivers of Security Market Growth
The growth of the Security Market is propelled by several factors:
Technological Advancements: AI, IoT, and cloud computing drive innovation in security solutions, making them more efficient and effective.
Rising Cyber Threats: The increasing sophistication and frequency of cyberattacks fuels demand for robust security systems.
Government Regulations: Stringent data protection laws and industry standards mandate higher levels of security.
Increased Investments in Infrastructure: Governments and businesses invest heavily in physical and digital security to protect assets and data.
Challenges in the Security Market Sector
The Security Market faces several challenges:
High Initial Investment Costs: Implementing advanced security systems can be expensive, posing a barrier for some organizations.
Integration Challenges: Integrating various security systems from different vendors can be complex and time-consuming.
Cybersecurity Risks: Security systems themselves can become targets for cyberattacks, requiring robust cybersecurity measures.
Supply Chain Disruptions: Global events can impact the availability of components and materials, affecting production and delivery timelines. The impact of xx% on overall revenue is seen during xx.
Leading Players in the Security Market Market
- Verkada Inc
- HID Global
- AMAG Technology (Allied Universal)
- Bosch Sicherheitssysteme GmbH
- Axis Communications AB
- Honeywell International Inc
- Johnson Controls
- ADT Inc
- Securitas Technology
- Assa Abloy Group
- Genetec Inc
- Palo Alto Networks
- Fortinet Inc
- IBM Corporation
- Cisco Systems Inc
Key Developments in Security Market Sector
August 2024: Alfred International launched its patented Alfred ML2 Smart Mortise Lock with Z-Wave Long Range, providing a retrofit solution for upgrading existing mortise locks to smart locks. This development expands the addressable market for smart locks and simplifies upgrades for property managers and homeowners.
May 2024: Palo Alto Networks and IBM partnered to deliver AI-driven security outcomes, leveraging AI to enhance threat detection, response, and remediation. This collaboration highlights the growing importance of AI in cybersecurity and signifies a trend towards more comprehensive and intelligent security solutions.
Strategic Security Market Market Outlook
The Security Market is poised for continued growth, driven by escalating cybersecurity threats, technological advancements, and increasing government regulations. Strategic opportunities exist for companies that can deliver innovative, integrated, and user-friendly security solutions. The market will be increasingly shaped by AI, IoT, and cloud technologies, requiring companies to adapt their strategies and invest in research and development to stay competitive. Growth will be fueled by the rising adoption of smart security solutions, especially in commercial and industrial sectors. The expansion into emerging markets and the development of customized solutions will further contribute to market expansion.
Security Market Segmentation
-
1. Security Type
-
1.1. Physical Security
- 1.1.1. Access Control
- 1.1.2. Video Surveillance
- 1.1.3. Intrusion Detection
- 1.1.4. Perimeter Security
-
1.2. Cyber Security
- 1.2.1. Network Security
- 1.2.2. End Point Security
- 1.2.3. Application Security
- 1.2.4. Cloud Security
- 1.2.5. Information Security
-
1.1. Physical Security
-
2. End-user Vertical
- 2.1. Government and Public Sector
- 2.2. Commercial
- 2.3. Industrial
- 2.4. Residential
- 2.5. Healthcare
- 2.6. Education
- 2.7. Critical Infrastructure
-
3. Solution Type
- 3.1. Hardware
- 3.2. Software
- 3.3. Services
-
4. Deployment Type
- 4.1. On-premise
- 4.2. Cloud-based
Security Market Segmentation By Geography
- 1. North America
- 2. Europe
- 3. Asia
- 4. Australia and New Zealand
- 5. Latin America
- 6. Middle East and Africa
Security Market REPORT HIGHLIGHTS
| Aspects | Details |
|---|---|
| Study Period | 2019-2033 |
| Base Year | 2024 |
| Estimated Year | 2025 |
| Forecast Period | 2025-2033 |
| Historical Period | 2019-2024 |
| Growth Rate | CAGR of 10.20% from 2019-2033 |
| Segmentation |
|
Table of Contents
- 1. Introduction
- 1.1. Research Scope
- 1.2. Market Segmentation
- 1.3. Research Methodology
- 1.4. Definitions and Assumptions
- 2. Executive Summary
- 2.1. Introduction
- 3. Market Dynamics
- 3.1. Introduction
- 3.2. Market Drivers
- 3.2.1. Increasing Cyber Threats; Growth in IoT Devices
- 3.3. Market Restrains
- 3.3.1. Increasing Cyber Threats; Growth in IoT Devices
- 3.4. Market Trends
- 3.4.1. Commercial Sector Witnessing Demand
- 4. Market Factor Analysis
- 4.1. Porters Five Forces
- 4.2. Supply/Value Chain
- 4.3. PESTEL analysis
- 4.4. Market Entropy
- 4.5. Patent/Trademark Analysis
- 5. Global Security Market Analysis, Insights and Forecast, 2019-2031
- 5.1. Market Analysis, Insights and Forecast - by Security Type
- 5.1.1. Physical Security
- 5.1.1.1. Access Control
- 5.1.1.2. Video Surveillance
- 5.1.1.3. Intrusion Detection
- 5.1.1.4. Perimeter Security
- 5.1.2. Cyber Security
- 5.1.2.1. Network Security
- 5.1.2.2. End Point Security
- 5.1.2.3. Application Security
- 5.1.2.4. Cloud Security
- 5.1.2.5. Information Security
- 5.1.1. Physical Security
- 5.2. Market Analysis, Insights and Forecast - by End-user Vertical
- 5.2.1. Government and Public Sector
- 5.2.2. Commercial
- 5.2.3. Industrial
- 5.2.4. Residential
- 5.2.5. Healthcare
- 5.2.6. Education
- 5.2.7. Critical Infrastructure
- 5.3. Market Analysis, Insights and Forecast - by Solution Type
- 5.3.1. Hardware
- 5.3.2. Software
- 5.3.3. Services
- 5.4. Market Analysis, Insights and Forecast - by Deployment Type
- 5.4.1. On-premise
- 5.4.2. Cloud-based
- 5.5. Market Analysis, Insights and Forecast - by Region
- 5.5.1. North America
- 5.5.2. Europe
- 5.5.3. Asia
- 5.5.4. Australia and New Zealand
- 5.5.5. Latin America
- 5.5.6. Middle East and Africa
- 5.1. Market Analysis, Insights and Forecast - by Security Type
- 6. North America Security Market Analysis, Insights and Forecast, 2019-2031
- 6.1. Market Analysis, Insights and Forecast - by Security Type
- 6.1.1. Physical Security
- 6.1.1.1. Access Control
- 6.1.1.2. Video Surveillance
- 6.1.1.3. Intrusion Detection
- 6.1.1.4. Perimeter Security
- 6.1.2. Cyber Security
- 6.1.2.1. Network Security
- 6.1.2.2. End Point Security
- 6.1.2.3. Application Security
- 6.1.2.4. Cloud Security
- 6.1.2.5. Information Security
- 6.1.1. Physical Security
- 6.2. Market Analysis, Insights and Forecast - by End-user Vertical
- 6.2.1. Government and Public Sector
- 6.2.2. Commercial
- 6.2.3. Industrial
- 6.2.4. Residential
- 6.2.5. Healthcare
- 6.2.6. Education
- 6.2.7. Critical Infrastructure
- 6.3. Market Analysis, Insights and Forecast - by Solution Type
- 6.3.1. Hardware
- 6.3.2. Software
- 6.3.3. Services
- 6.4. Market Analysis, Insights and Forecast - by Deployment Type
- 6.4.1. On-premise
- 6.4.2. Cloud-based
- 6.1. Market Analysis, Insights and Forecast - by Security Type
- 7. Europe Security Market Analysis, Insights and Forecast, 2019-2031
- 7.1. Market Analysis, Insights and Forecast - by Security Type
- 7.1.1. Physical Security
- 7.1.1.1. Access Control
- 7.1.1.2. Video Surveillance
- 7.1.1.3. Intrusion Detection
- 7.1.1.4. Perimeter Security
- 7.1.2. Cyber Security
- 7.1.2.1. Network Security
- 7.1.2.2. End Point Security
- 7.1.2.3. Application Security
- 7.1.2.4. Cloud Security
- 7.1.2.5. Information Security
- 7.1.1. Physical Security
- 7.2. Market Analysis, Insights and Forecast - by End-user Vertical
- 7.2.1. Government and Public Sector
- 7.2.2. Commercial
- 7.2.3. Industrial
- 7.2.4. Residential
- 7.2.5. Healthcare
- 7.2.6. Education
- 7.2.7. Critical Infrastructure
- 7.3. Market Analysis, Insights and Forecast - by Solution Type
- 7.3.1. Hardware
- 7.3.2. Software
- 7.3.3. Services
- 7.4. Market Analysis, Insights and Forecast - by Deployment Type
- 7.4.1. On-premise
- 7.4.2. Cloud-based
- 7.1. Market Analysis, Insights and Forecast - by Security Type
- 8. Asia Security Market Analysis, Insights and Forecast, 2019-2031
- 8.1. Market Analysis, Insights and Forecast - by Security Type
- 8.1.1. Physical Security
- 8.1.1.1. Access Control
- 8.1.1.2. Video Surveillance
- 8.1.1.3. Intrusion Detection
- 8.1.1.4. Perimeter Security
- 8.1.2. Cyber Security
- 8.1.2.1. Network Security
- 8.1.2.2. End Point Security
- 8.1.2.3. Application Security
- 8.1.2.4. Cloud Security
- 8.1.2.5. Information Security
- 8.1.1. Physical Security
- 8.2. Market Analysis, Insights and Forecast - by End-user Vertical
- 8.2.1. Government and Public Sector
- 8.2.2. Commercial
- 8.2.3. Industrial
- 8.2.4. Residential
- 8.2.5. Healthcare
- 8.2.6. Education
- 8.2.7. Critical Infrastructure
- 8.3. Market Analysis, Insights and Forecast - by Solution Type
- 8.3.1. Hardware
- 8.3.2. Software
- 8.3.3. Services
- 8.4. Market Analysis, Insights and Forecast - by Deployment Type
- 8.4.1. On-premise
- 8.4.2. Cloud-based
- 8.1. Market Analysis, Insights and Forecast - by Security Type
- 9. Australia and New Zealand Security Market Analysis, Insights and Forecast, 2019-2031
- 9.1. Market Analysis, Insights and Forecast - by Security Type
- 9.1.1. Physical Security
- 9.1.1.1. Access Control
- 9.1.1.2. Video Surveillance
- 9.1.1.3. Intrusion Detection
- 9.1.1.4. Perimeter Security
- 9.1.2. Cyber Security
- 9.1.2.1. Network Security
- 9.1.2.2. End Point Security
- 9.1.2.3. Application Security
- 9.1.2.4. Cloud Security
- 9.1.2.5. Information Security
- 9.1.1. Physical Security
- 9.2. Market Analysis, Insights and Forecast - by End-user Vertical
- 9.2.1. Government and Public Sector
- 9.2.2. Commercial
- 9.2.3. Industrial
- 9.2.4. Residential
- 9.2.5. Healthcare
- 9.2.6. Education
- 9.2.7. Critical Infrastructure
- 9.3. Market Analysis, Insights and Forecast - by Solution Type
- 9.3.1. Hardware
- 9.3.2. Software
- 9.3.3. Services
- 9.4. Market Analysis, Insights and Forecast - by Deployment Type
- 9.4.1. On-premise
- 9.4.2. Cloud-based
- 9.1. Market Analysis, Insights and Forecast - by Security Type
- 10. Latin America Security Market Analysis, Insights and Forecast, 2019-2031
- 10.1. Market Analysis, Insights and Forecast - by Security Type
- 10.1.1. Physical Security
- 10.1.1.1. Access Control
- 10.1.1.2. Video Surveillance
- 10.1.1.3. Intrusion Detection
- 10.1.1.4. Perimeter Security
- 10.1.2. Cyber Security
- 10.1.2.1. Network Security
- 10.1.2.2. End Point Security
- 10.1.2.3. Application Security
- 10.1.2.4. Cloud Security
- 10.1.2.5. Information Security
- 10.1.1. Physical Security
- 10.2. Market Analysis, Insights and Forecast - by End-user Vertical
- 10.2.1. Government and Public Sector
- 10.2.2. Commercial
- 10.2.3. Industrial
- 10.2.4. Residential
- 10.2.5. Healthcare
- 10.2.6. Education
- 10.2.7. Critical Infrastructure
- 10.3. Market Analysis, Insights and Forecast - by Solution Type
- 10.3.1. Hardware
- 10.3.2. Software
- 10.3.3. Services
- 10.4. Market Analysis, Insights and Forecast - by Deployment Type
- 10.4.1. On-premise
- 10.4.2. Cloud-based
- 10.1. Market Analysis, Insights and Forecast - by Security Type
- 11. Middle East and Africa Security Market Analysis, Insights and Forecast, 2019-2031
- 11.1. Market Analysis, Insights and Forecast - by Security Type
- 11.1.1. Physical Security
- 11.1.1.1. Access Control
- 11.1.1.2. Video Surveillance
- 11.1.1.3. Intrusion Detection
- 11.1.1.4. Perimeter Security
- 11.1.2. Cyber Security
- 11.1.2.1. Network Security
- 11.1.2.2. End Point Security
- 11.1.2.3. Application Security
- 11.1.2.4. Cloud Security
- 11.1.2.5. Information Security
- 11.1.1. Physical Security
- 11.2. Market Analysis, Insights and Forecast - by End-user Vertical
- 11.2.1. Government and Public Sector
- 11.2.2. Commercial
- 11.2.3. Industrial
- 11.2.4. Residential
- 11.2.5. Healthcare
- 11.2.6. Education
- 11.2.7. Critical Infrastructure
- 11.3. Market Analysis, Insights and Forecast - by Solution Type
- 11.3.1. Hardware
- 11.3.2. Software
- 11.3.3. Services
- 11.4. Market Analysis, Insights and Forecast - by Deployment Type
- 11.4.1. On-premise
- 11.4.2. Cloud-based
- 11.1. Market Analysis, Insights and Forecast - by Security Type
- 12. Competitive Analysis
- 12.1. Global Market Share Analysis 2024
- 12.2. Company Profiles
- 12.2.1 Verkada Inc
- 12.2.1.1. Overview
- 12.2.1.2. Products
- 12.2.1.3. SWOT Analysis
- 12.2.1.4. Recent Developments
- 12.2.1.5. Financials (Based on Availability)
- 12.2.2 HID Global
- 12.2.2.1. Overview
- 12.2.2.2. Products
- 12.2.2.3. SWOT Analysis
- 12.2.2.4. Recent Developments
- 12.2.2.5. Financials (Based on Availability)
- 12.2.3 AMAG Technology (Allied Universal)
- 12.2.3.1. Overview
- 12.2.3.2. Products
- 12.2.3.3. SWOT Analysis
- 12.2.3.4. Recent Developments
- 12.2.3.5. Financials (Based on Availability)
- 12.2.4 Bosch Sicherheitssysteme GmbH
- 12.2.4.1. Overview
- 12.2.4.2. Products
- 12.2.4.3. SWOT Analysis
- 12.2.4.4. Recent Developments
- 12.2.4.5. Financials (Based on Availability)
- 12.2.5 Axis Communications AB
- 12.2.5.1. Overview
- 12.2.5.2. Products
- 12.2.5.3. SWOT Analysis
- 12.2.5.4. Recent Developments
- 12.2.5.5. Financials (Based on Availability)
- 12.2.6 Honeywell International Inc
- 12.2.6.1. Overview
- 12.2.6.2. Products
- 12.2.6.3. SWOT Analysis
- 12.2.6.4. Recent Developments
- 12.2.6.5. Financials (Based on Availability)
- 12.2.7 Johnson Controls
- 12.2.7.1. Overview
- 12.2.7.2. Products
- 12.2.7.3. SWOT Analysis
- 12.2.7.4. Recent Developments
- 12.2.7.5. Financials (Based on Availability)
- 12.2.8 ADT Inc
- 12.2.8.1. Overview
- 12.2.8.2. Products
- 12.2.8.3. SWOT Analysis
- 12.2.8.4. Recent Developments
- 12.2.8.5. Financials (Based on Availability)
- 12.2.9 Securitas Technology
- 12.2.9.1. Overview
- 12.2.9.2. Products
- 12.2.9.3. SWOT Analysis
- 12.2.9.4. Recent Developments
- 12.2.9.5. Financials (Based on Availability)
- 12.2.10 Assa Abloy Group
- 12.2.10.1. Overview
- 12.2.10.2. Products
- 12.2.10.3. SWOT Analysis
- 12.2.10.4. Recent Developments
- 12.2.10.5. Financials (Based on Availability)
- 12.2.11 Genetec Inc
- 12.2.11.1. Overview
- 12.2.11.2. Products
- 12.2.11.3. SWOT Analysis
- 12.2.11.4. Recent Developments
- 12.2.11.5. Financials (Based on Availability)
- 12.2.12 Palo Alto Networks
- 12.2.12.1. Overview
- 12.2.12.2. Products
- 12.2.12.3. SWOT Analysis
- 12.2.12.4. Recent Developments
- 12.2.12.5. Financials (Based on Availability)
- 12.2.13 Fortinet Inc
- 12.2.13.1. Overview
- 12.2.13.2. Products
- 12.2.13.3. SWOT Analysis
- 12.2.13.4. Recent Developments
- 12.2.13.5. Financials (Based on Availability)
- 12.2.14 IBM Corporation
- 12.2.14.1. Overview
- 12.2.14.2. Products
- 12.2.14.3. SWOT Analysis
- 12.2.14.4. Recent Developments
- 12.2.14.5. Financials (Based on Availability)
- 12.2.15 Cisco Systems Inc
- 12.2.15.1. Overview
- 12.2.15.2. Products
- 12.2.15.3. SWOT Analysis
- 12.2.15.4. Recent Developments
- 12.2.15.5. Financials (Based on Availability)
- 12.2.1 Verkada Inc
List of Figures
- Figure 1: Global Security Market Revenue Breakdown (Million, %) by Region 2024 & 2032
- Figure 2: Global Security Market Volume Breakdown (Billion, %) by Region 2024 & 2032
- Figure 3: North America Security Market Revenue (Million), by Security Type 2024 & 2032
- Figure 4: North America Security Market Volume (Billion), by Security Type 2024 & 2032
- Figure 5: North America Security Market Revenue Share (%), by Security Type 2024 & 2032
- Figure 6: North America Security Market Volume Share (%), by Security Type 2024 & 2032
- Figure 7: North America Security Market Revenue (Million), by End-user Vertical 2024 & 2032
- Figure 8: North America Security Market Volume (Billion), by End-user Vertical 2024 & 2032
- Figure 9: North America Security Market Revenue Share (%), by End-user Vertical 2024 & 2032
- Figure 10: North America Security Market Volume Share (%), by End-user Vertical 2024 & 2032
- Figure 11: North America Security Market Revenue (Million), by Solution Type 2024 & 2032
- Figure 12: North America Security Market Volume (Billion), by Solution Type 2024 & 2032
- Figure 13: North America Security Market Revenue Share (%), by Solution Type 2024 & 2032
- Figure 14: North America Security Market Volume Share (%), by Solution Type 2024 & 2032
- Figure 15: North America Security Market Revenue (Million), by Deployment Type 2024 & 2032
- Figure 16: North America Security Market Volume (Billion), by Deployment Type 2024 & 2032
- Figure 17: North America Security Market Revenue Share (%), by Deployment Type 2024 & 2032
- Figure 18: North America Security Market Volume Share (%), by Deployment Type 2024 & 2032
- Figure 19: North America Security Market Revenue (Million), by Country 2024 & 2032
- Figure 20: North America Security Market Volume (Billion), by Country 2024 & 2032
- Figure 21: North America Security Market Revenue Share (%), by Country 2024 & 2032
- Figure 22: North America Security Market Volume Share (%), by Country 2024 & 2032
- Figure 23: Europe Security Market Revenue (Million), by Security Type 2024 & 2032
- Figure 24: Europe Security Market Volume (Billion), by Security Type 2024 & 2032
- Figure 25: Europe Security Market Revenue Share (%), by Security Type 2024 & 2032
- Figure 26: Europe Security Market Volume Share (%), by Security Type 2024 & 2032
- Figure 27: Europe Security Market Revenue (Million), by End-user Vertical 2024 & 2032
- Figure 28: Europe Security Market Volume (Billion), by End-user Vertical 2024 & 2032
- Figure 29: Europe Security Market Revenue Share (%), by End-user Vertical 2024 & 2032
- Figure 30: Europe Security Market Volume Share (%), by End-user Vertical 2024 & 2032
- Figure 31: Europe Security Market Revenue (Million), by Solution Type 2024 & 2032
- Figure 32: Europe Security Market Volume (Billion), by Solution Type 2024 & 2032
- Figure 33: Europe Security Market Revenue Share (%), by Solution Type 2024 & 2032
- Figure 34: Europe Security Market Volume Share (%), by Solution Type 2024 & 2032
- Figure 35: Europe Security Market Revenue (Million), by Deployment Type 2024 & 2032
- Figure 36: Europe Security Market Volume (Billion), by Deployment Type 2024 & 2032
- Figure 37: Europe Security Market Revenue Share (%), by Deployment Type 2024 & 2032
- Figure 38: Europe Security Market Volume Share (%), by Deployment Type 2024 & 2032
- Figure 39: Europe Security Market Revenue (Million), by Country 2024 & 2032
- Figure 40: Europe Security Market Volume (Billion), by Country 2024 & 2032
- Figure 41: Europe Security Market Revenue Share (%), by Country 2024 & 2032
- Figure 42: Europe Security Market Volume Share (%), by Country 2024 & 2032
- Figure 43: Asia Security Market Revenue (Million), by Security Type 2024 & 2032
- Figure 44: Asia Security Market Volume (Billion), by Security Type 2024 & 2032
- Figure 45: Asia Security Market Revenue Share (%), by Security Type 2024 & 2032
- Figure 46: Asia Security Market Volume Share (%), by Security Type 2024 & 2032
- Figure 47: Asia Security Market Revenue (Million), by End-user Vertical 2024 & 2032
- Figure 48: Asia Security Market Volume (Billion), by End-user Vertical 2024 & 2032
- Figure 49: Asia Security Market Revenue Share (%), by End-user Vertical 2024 & 2032
- Figure 50: Asia Security Market Volume Share (%), by End-user Vertical 2024 & 2032
- Figure 51: Asia Security Market Revenue (Million), by Solution Type 2024 & 2032
- Figure 52: Asia Security Market Volume (Billion), by Solution Type 2024 & 2032
- Figure 53: Asia Security Market Revenue Share (%), by Solution Type 2024 & 2032
- Figure 54: Asia Security Market Volume Share (%), by Solution Type 2024 & 2032
- Figure 55: Asia Security Market Revenue (Million), by Deployment Type 2024 & 2032
- Figure 56: Asia Security Market Volume (Billion), by Deployment Type 2024 & 2032
- Figure 57: Asia Security Market Revenue Share (%), by Deployment Type 2024 & 2032
- Figure 58: Asia Security Market Volume Share (%), by Deployment Type 2024 & 2032
- Figure 59: Asia Security Market Revenue (Million), by Country 2024 & 2032
- Figure 60: Asia Security Market Volume (Billion), by Country 2024 & 2032
- Figure 61: Asia Security Market Revenue Share (%), by Country 2024 & 2032
- Figure 62: Asia Security Market Volume Share (%), by Country 2024 & 2032
- Figure 63: Australia and New Zealand Security Market Revenue (Million), by Security Type 2024 & 2032
- Figure 64: Australia and New Zealand Security Market Volume (Billion), by Security Type 2024 & 2032
- Figure 65: Australia and New Zealand Security Market Revenue Share (%), by Security Type 2024 & 2032
- Figure 66: Australia and New Zealand Security Market Volume Share (%), by Security Type 2024 & 2032
- Figure 67: Australia and New Zealand Security Market Revenue (Million), by End-user Vertical 2024 & 2032
- Figure 68: Australia and New Zealand Security Market Volume (Billion), by End-user Vertical 2024 & 2032
- Figure 69: Australia and New Zealand Security Market Revenue Share (%), by End-user Vertical 2024 & 2032
- Figure 70: Australia and New Zealand Security Market Volume Share (%), by End-user Vertical 2024 & 2032
- Figure 71: Australia and New Zealand Security Market Revenue (Million), by Solution Type 2024 & 2032
- Figure 72: Australia and New Zealand Security Market Volume (Billion), by Solution Type 2024 & 2032
- Figure 73: Australia and New Zealand Security Market Revenue Share (%), by Solution Type 2024 & 2032
- Figure 74: Australia and New Zealand Security Market Volume Share (%), by Solution Type 2024 & 2032
- Figure 75: Australia and New Zealand Security Market Revenue (Million), by Deployment Type 2024 & 2032
- Figure 76: Australia and New Zealand Security Market Volume (Billion), by Deployment Type 2024 & 2032
- Figure 77: Australia and New Zealand Security Market Revenue Share (%), by Deployment Type 2024 & 2032
- Figure 78: Australia and New Zealand Security Market Volume Share (%), by Deployment Type 2024 & 2032
- Figure 79: Australia and New Zealand Security Market Revenue (Million), by Country 2024 & 2032
- Figure 80: Australia and New Zealand Security Market Volume (Billion), by Country 2024 & 2032
- Figure 81: Australia and New Zealand Security Market Revenue Share (%), by Country 2024 & 2032
- Figure 82: Australia and New Zealand Security Market Volume Share (%), by Country 2024 & 2032
- Figure 83: Latin America Security Market Revenue (Million), by Security Type 2024 & 2032
- Figure 84: Latin America Security Market Volume (Billion), by Security Type 2024 & 2032
- Figure 85: Latin America Security Market Revenue Share (%), by Security Type 2024 & 2032
- Figure 86: Latin America Security Market Volume Share (%), by Security Type 2024 & 2032
- Figure 87: Latin America Security Market Revenue (Million), by End-user Vertical 2024 & 2032
- Figure 88: Latin America Security Market Volume (Billion), by End-user Vertical 2024 & 2032
- Figure 89: Latin America Security Market Revenue Share (%), by End-user Vertical 2024 & 2032
- Figure 90: Latin America Security Market Volume Share (%), by End-user Vertical 2024 & 2032
- Figure 91: Latin America Security Market Revenue (Million), by Solution Type 2024 & 2032
- Figure 92: Latin America Security Market Volume (Billion), by Solution Type 2024 & 2032
- Figure 93: Latin America Security Market Revenue Share (%), by Solution Type 2024 & 2032
- Figure 94: Latin America Security Market Volume Share (%), by Solution Type 2024 & 2032
- Figure 95: Latin America Security Market Revenue (Million), by Deployment Type 2024 & 2032
- Figure 96: Latin America Security Market Volume (Billion), by Deployment Type 2024 & 2032
- Figure 97: Latin America Security Market Revenue Share (%), by Deployment Type 2024 & 2032
- Figure 98: Latin America Security Market Volume Share (%), by Deployment Type 2024 & 2032
- Figure 99: Latin America Security Market Revenue (Million), by Country 2024 & 2032
- Figure 100: Latin America Security Market Volume (Billion), by Country 2024 & 2032
- Figure 101: Latin America Security Market Revenue Share (%), by Country 2024 & 2032
- Figure 102: Latin America Security Market Volume Share (%), by Country 2024 & 2032
- Figure 103: Middle East and Africa Security Market Revenue (Million), by Security Type 2024 & 2032
- Figure 104: Middle East and Africa Security Market Volume (Billion), by Security Type 2024 & 2032
- Figure 105: Middle East and Africa Security Market Revenue Share (%), by Security Type 2024 & 2032
- Figure 106: Middle East and Africa Security Market Volume Share (%), by Security Type 2024 & 2032
- Figure 107: Middle East and Africa Security Market Revenue (Million), by End-user Vertical 2024 & 2032
- Figure 108: Middle East and Africa Security Market Volume (Billion), by End-user Vertical 2024 & 2032
- Figure 109: Middle East and Africa Security Market Revenue Share (%), by End-user Vertical 2024 & 2032
- Figure 110: Middle East and Africa Security Market Volume Share (%), by End-user Vertical 2024 & 2032
- Figure 111: Middle East and Africa Security Market Revenue (Million), by Solution Type 2024 & 2032
- Figure 112: Middle East and Africa Security Market Volume (Billion), by Solution Type 2024 & 2032
- Figure 113: Middle East and Africa Security Market Revenue Share (%), by Solution Type 2024 & 2032
- Figure 114: Middle East and Africa Security Market Volume Share (%), by Solution Type 2024 & 2032
- Figure 115: Middle East and Africa Security Market Revenue (Million), by Deployment Type 2024 & 2032
- Figure 116: Middle East and Africa Security Market Volume (Billion), by Deployment Type 2024 & 2032
- Figure 117: Middle East and Africa Security Market Revenue Share (%), by Deployment Type 2024 & 2032
- Figure 118: Middle East and Africa Security Market Volume Share (%), by Deployment Type 2024 & 2032
- Figure 119: Middle East and Africa Security Market Revenue (Million), by Country 2024 & 2032
- Figure 120: Middle East and Africa Security Market Volume (Billion), by Country 2024 & 2032
- Figure 121: Middle East and Africa Security Market Revenue Share (%), by Country 2024 & 2032
- Figure 122: Middle East and Africa Security Market Volume Share (%), by Country 2024 & 2032
List of Tables
- Table 1: Global Security Market Revenue Million Forecast, by Region 2019 & 2032
- Table 2: Global Security Market Volume Billion Forecast, by Region 2019 & 2032
- Table 3: Global Security Market Revenue Million Forecast, by Security Type 2019 & 2032
- Table 4: Global Security Market Volume Billion Forecast, by Security Type 2019 & 2032
- Table 5: Global Security Market Revenue Million Forecast, by End-user Vertical 2019 & 2032
- Table 6: Global Security Market Volume Billion Forecast, by End-user Vertical 2019 & 2032
- Table 7: Global Security Market Revenue Million Forecast, by Solution Type 2019 & 2032
- Table 8: Global Security Market Volume Billion Forecast, by Solution Type 2019 & 2032
- Table 9: Global Security Market Revenue Million Forecast, by Deployment Type 2019 & 2032
- Table 10: Global Security Market Volume Billion Forecast, by Deployment Type 2019 & 2032
- Table 11: Global Security Market Revenue Million Forecast, by Region 2019 & 2032
- Table 12: Global Security Market Volume Billion Forecast, by Region 2019 & 2032
- Table 13: Global Security Market Revenue Million Forecast, by Security Type 2019 & 2032
- Table 14: Global Security Market Volume Billion Forecast, by Security Type 2019 & 2032
- Table 15: Global Security Market Revenue Million Forecast, by End-user Vertical 2019 & 2032
- Table 16: Global Security Market Volume Billion Forecast, by End-user Vertical 2019 & 2032
- Table 17: Global Security Market Revenue Million Forecast, by Solution Type 2019 & 2032
- Table 18: Global Security Market Volume Billion Forecast, by Solution Type 2019 & 2032
- Table 19: Global Security Market Revenue Million Forecast, by Deployment Type 2019 & 2032
- Table 20: Global Security Market Volume Billion Forecast, by Deployment Type 2019 & 2032
- Table 21: Global Security Market Revenue Million Forecast, by Country 2019 & 2032
- Table 22: Global Security Market Volume Billion Forecast, by Country 2019 & 2032
- Table 23: Global Security Market Revenue Million Forecast, by Security Type 2019 & 2032
- Table 24: Global Security Market Volume Billion Forecast, by Security Type 2019 & 2032
- Table 25: Global Security Market Revenue Million Forecast, by End-user Vertical 2019 & 2032
- Table 26: Global Security Market Volume Billion Forecast, by End-user Vertical 2019 & 2032
- Table 27: Global Security Market Revenue Million Forecast, by Solution Type 2019 & 2032
- Table 28: Global Security Market Volume Billion Forecast, by Solution Type 2019 & 2032
- Table 29: Global Security Market Revenue Million Forecast, by Deployment Type 2019 & 2032
- Table 30: Global Security Market Volume Billion Forecast, by Deployment Type 2019 & 2032
- Table 31: Global Security Market Revenue Million Forecast, by Country 2019 & 2032
- Table 32: Global Security Market Volume Billion Forecast, by Country 2019 & 2032
- Table 33: Global Security Market Revenue Million Forecast, by Security Type 2019 & 2032
- Table 34: Global Security Market Volume Billion Forecast, by Security Type 2019 & 2032
- Table 35: Global Security Market Revenue Million Forecast, by End-user Vertical 2019 & 2032
- Table 36: Global Security Market Volume Billion Forecast, by End-user Vertical 2019 & 2032
- Table 37: Global Security Market Revenue Million Forecast, by Solution Type 2019 & 2032
- Table 38: Global Security Market Volume Billion Forecast, by Solution Type 2019 & 2032
- Table 39: Global Security Market Revenue Million Forecast, by Deployment Type 2019 & 2032
- Table 40: Global Security Market Volume Billion Forecast, by Deployment Type 2019 & 2032
- Table 41: Global Security Market Revenue Million Forecast, by Country 2019 & 2032
- Table 42: Global Security Market Volume Billion Forecast, by Country 2019 & 2032
- Table 43: Global Security Market Revenue Million Forecast, by Security Type 2019 & 2032
- Table 44: Global Security Market Volume Billion Forecast, by Security Type 2019 & 2032
- Table 45: Global Security Market Revenue Million Forecast, by End-user Vertical 2019 & 2032
- Table 46: Global Security Market Volume Billion Forecast, by End-user Vertical 2019 & 2032
- Table 47: Global Security Market Revenue Million Forecast, by Solution Type 2019 & 2032
- Table 48: Global Security Market Volume Billion Forecast, by Solution Type 2019 & 2032
- Table 49: Global Security Market Revenue Million Forecast, by Deployment Type 2019 & 2032
- Table 50: Global Security Market Volume Billion Forecast, by Deployment Type 2019 & 2032
- Table 51: Global Security Market Revenue Million Forecast, by Country 2019 & 2032
- Table 52: Global Security Market Volume Billion Forecast, by Country 2019 & 2032
- Table 53: Global Security Market Revenue Million Forecast, by Security Type 2019 & 2032
- Table 54: Global Security Market Volume Billion Forecast, by Security Type 2019 & 2032
- Table 55: Global Security Market Revenue Million Forecast, by End-user Vertical 2019 & 2032
- Table 56: Global Security Market Volume Billion Forecast, by End-user Vertical 2019 & 2032
- Table 57: Global Security Market Revenue Million Forecast, by Solution Type 2019 & 2032
- Table 58: Global Security Market Volume Billion Forecast, by Solution Type 2019 & 2032
- Table 59: Global Security Market Revenue Million Forecast, by Deployment Type 2019 & 2032
- Table 60: Global Security Market Volume Billion Forecast, by Deployment Type 2019 & 2032
- Table 61: Global Security Market Revenue Million Forecast, by Country 2019 & 2032
- Table 62: Global Security Market Volume Billion Forecast, by Country 2019 & 2032
- Table 63: Global Security Market Revenue Million Forecast, by Security Type 2019 & 2032
- Table 64: Global Security Market Volume Billion Forecast, by Security Type 2019 & 2032
- Table 65: Global Security Market Revenue Million Forecast, by End-user Vertical 2019 & 2032
- Table 66: Global Security Market Volume Billion Forecast, by End-user Vertical 2019 & 2032
- Table 67: Global Security Market Revenue Million Forecast, by Solution Type 2019 & 2032
- Table 68: Global Security Market Volume Billion Forecast, by Solution Type 2019 & 2032
- Table 69: Global Security Market Revenue Million Forecast, by Deployment Type 2019 & 2032
- Table 70: Global Security Market Volume Billion Forecast, by Deployment Type 2019 & 2032
- Table 71: Global Security Market Revenue Million Forecast, by Country 2019 & 2032
- Table 72: Global Security Market Volume Billion Forecast, by Country 2019 & 2032
Frequently Asked Questions
1. What is the projected Compound Annual Growth Rate (CAGR) of the Security Market?
The projected CAGR is approximately 10.20%.
2. Which companies are prominent players in the Security Market?
Key companies in the market include Verkada Inc, HID Global, AMAG Technology (Allied Universal), Bosch Sicherheitssysteme GmbH, Axis Communications AB, Honeywell International Inc, Johnson Controls, ADT Inc, Securitas Technology, Assa Abloy Group, Genetec Inc, Palo Alto Networks, Fortinet Inc, IBM Corporation, Cisco Systems Inc.
3. What are the main segments of the Security Market?
The market segments include Security Type, End-user Vertical, Solution Type, Deployment Type.
4. Can you provide details about the market size?
The market size is estimated to be USD 23.71 Million as of 2022.
5. What are some drivers contributing to market growth?
Increasing Cyber Threats; Growth in IoT Devices.
6. What are the notable trends driving market growth?
Commercial Sector Witnessing Demand.
7. Are there any restraints impacting market growth?
Increasing Cyber Threats; Growth in IoT Devices.
8. Can you provide examples of recent developments in the market?
August 2024: Alfred International, a subsidiary of GHT Door Hardware specializing in smart and connected locks, launched its patented Alfred ML2 Smart Mortise Lock with Z-Wave Long Range in the United States. The ML2, as per the company's claims, merges cutting-edge technology with a modern keypad and a unique design. This patented drive mechanism enables dealers to retrofit the ML2 into properties that previously used older mortise-style locks. Now available in the United States, the ML2 caters to property managers and homeowners who wish to upgrade to a smart mortise lock. This upgrade can be done without entirely replacing or re-keying the existing lock, thus sidestepping common installation challenges.
9. What pricing options are available for accessing the report?
Pricing options include single-user, multi-user, and enterprise licenses priced at USD 4750, USD 5250, and USD 8750 respectively.
10. Is the market size provided in terms of value or volume?
The market size is provided in terms of value, measured in Million and volume, measured in Billion.
11. Are there any specific market keywords associated with the report?
Yes, the market keyword associated with the report is "Security Market," which aids in identifying and referencing the specific market segment covered.
12. How do I determine which pricing option suits my needs best?
The pricing options vary based on user requirements and access needs. Individual users may opt for single-user licenses, while businesses requiring broader access may choose multi-user or enterprise licenses for cost-effective access to the report.
13. Are there any additional resources or data provided in the Security Market report?
While the report offers comprehensive insights, it's advisable to review the specific contents or supplementary materials provided to ascertain if additional resources or data are available.
14. How can I stay updated on further developments or reports in the Security Market?
To stay informed about further developments, trends, and reports in the Security Market, consider subscribing to industry newsletters, following relevant companies and organizations, or regularly checking reputable industry news sources and publications.
Methodology
Step 1 - Identification of Relevant Samples Size from Population Database


Step 2 - Approaches for Defining Global Market Size (Value, Volume* & Price*)

Note*: In applicable scenarios
Step 3 - Data Sources
Primary Research
- Web Analytics
- Survey Reports
- Research Institute
- Latest Research Reports
- Opinion Leaders
Secondary Research
- Annual Reports
- White Paper
- Latest Press Release
- Industry Association
- Paid Database
- Investor Presentations

Step 4 - Data Triangulation
Involves using different sources of information in order to increase the validity of a study
These sources are likely to be stakeholders in a program - participants, other researchers, program staff, other community members, and so on.
Then we put all data in single framework & apply various statistical tools to find out the dynamic on the market.
During the analysis stage, feedback from the stakeholder groups would be compared to determine areas of agreement as well as areas of divergence


