
Key Insights
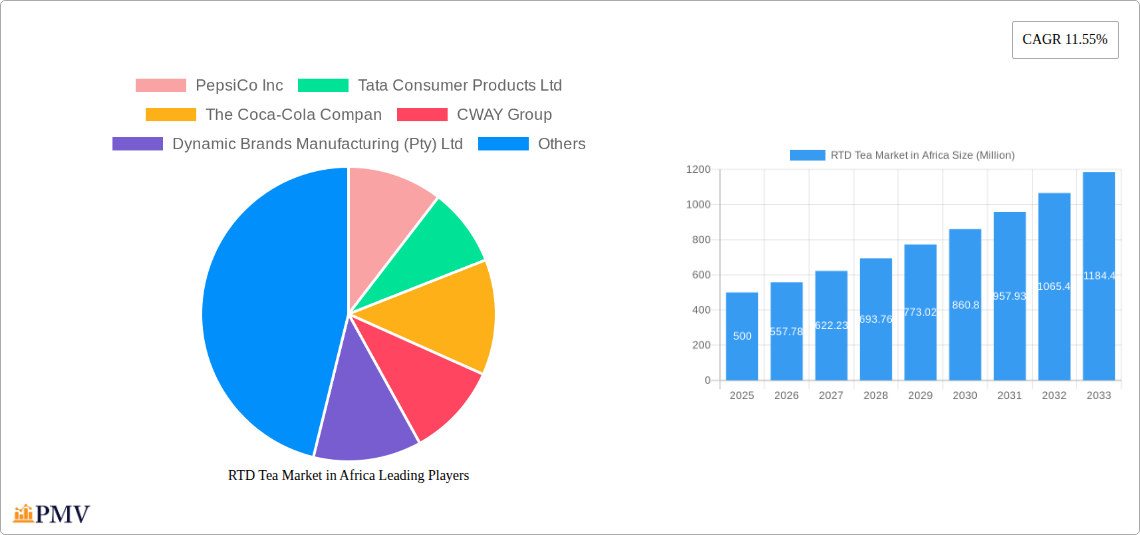
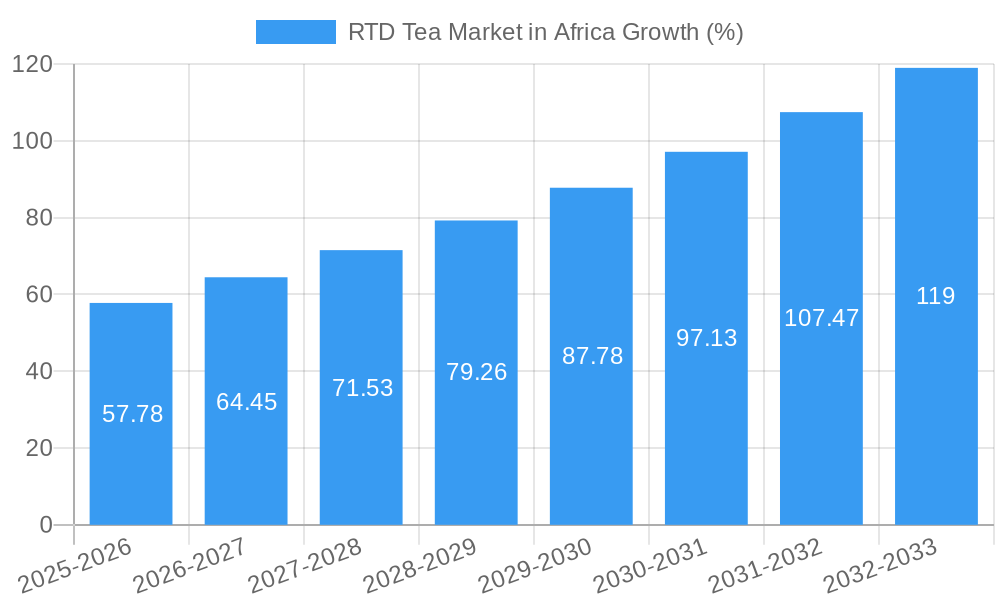
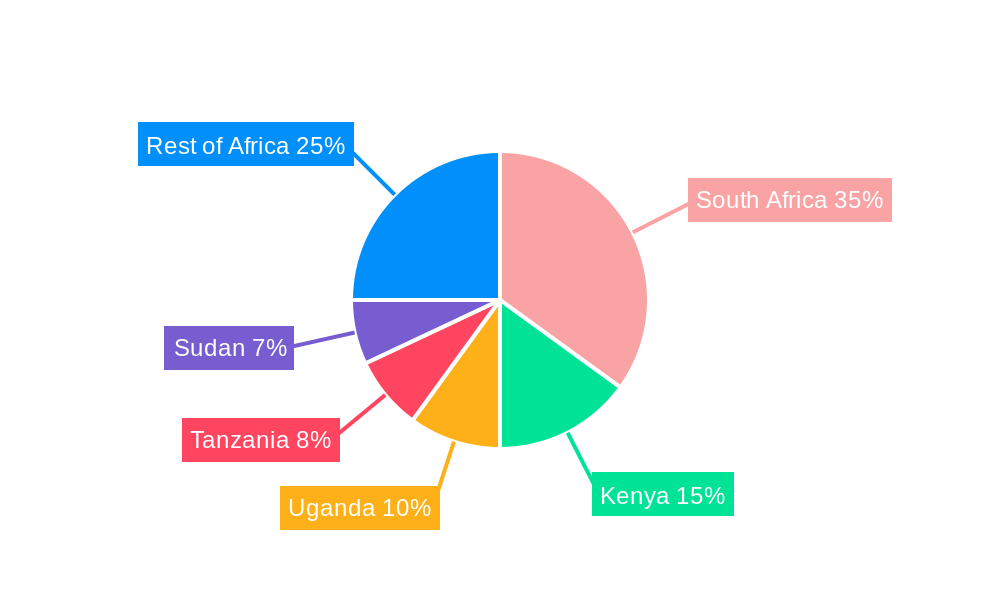
The Ready-to-Drink (RTD) tea market in Africa is experiencing robust growth, projected to maintain a Compound Annual Growth Rate (CAGR) of 11.55% from 2025 to 2033. This expansion is driven by several key factors. Increasing disposable incomes, particularly amongst younger demographics, fuel demand for convenient and refreshing beverages. The rising popularity of health-conscious lifestyles contributes significantly, with RTD tea perceived as a healthier alternative to carbonated soft drinks. Further propelling market growth is the expanding distribution network, particularly within the on-trade sector (restaurants, cafes etc.), enhancing product accessibility. The market is segmented by distribution channel (off-trade and on-trade), packaging type (aseptic packages, glass bottles, metal cans, PET bottles), and tea type (green tea, herbal tea, iced tea, and others). The preference for convenient packaging formats like PET bottles is driving growth within specific segments. Key players such as PepsiCo Inc, Tata Consumer Products Ltd, and The Coca-Cola Company are actively competing, leveraging their established distribution networks and marketing prowess to capture market share. The focus on innovation, including the introduction of new flavors and functional RTD teas, further fuels market expansion. Specific regional variations exist within Africa, with countries like South Africa, Kenya, and Uganda leading market adoption due to higher per capita incomes and established beverage consumption patterns. However, significant growth potential remains untapped in other regions of Africa, presenting attractive opportunities for market expansion.
Growth within the African RTD tea market is not without challenges. Factors such as fluctuating raw material prices and seasonality of tea production can influence profitability. The presence of established local players, offering cost-competitive alternatives, necessitates careful market positioning by multinational corporations. Furthermore, consumer preferences vary across regions, demanding product customization to meet local taste profiles. Addressing logistical complexities related to distribution in certain African regions is also crucial for sustaining growth. However, the overall positive outlook, fueled by demographic shifts, evolving consumer preferences, and increasing investment in the beverage sector, suggests a bright future for the African RTD tea market. Strategic partnerships with local distributors and a focus on sustainable sourcing practices will be key to navigating the challenges and realizing the full market potential.
This comprehensive report provides a detailed analysis of the Ready-to-Drink (RTD) tea market in Africa, offering invaluable insights for industry stakeholders, investors, and market researchers. Covering the period from 2019 to 2033, with a base year of 2025, this report presents a thorough examination of market structure, competitive dynamics, industry trends, and future growth prospects. The report includes detailed segmentation by distribution channel, packaging type, and tea type, allowing for a granular understanding of this dynamic market.
RTD Tea Market in Africa Market Structure & Competitive Dynamics
The African RTD tea market exhibits a moderately concentrated structure, with key players such as PepsiCo Inc, Tata Consumer Products Ltd, and The Coca-Cola Company holding significant market share. However, regional variations exist, with smaller, local players dominating specific markets. The market is characterized by a dynamic innovation ecosystem, particularly in packaging and flavor profiles catering to local preferences. Regulatory frameworks vary across African nations, impacting product labeling, ingredient standards, and distribution regulations. The market experiences competition from other beverages like carbonated soft drinks and fruit juices, serving as key substitutes. End-user trends show a growing preference for healthier beverages, driving demand for low-sugar and functional RTD teas. M&A activity in the sector has been moderate, with deal values averaging around xx Million in the last five years. For example, there were xx M&A deals in the historical period (2019-2024), with the average deal value at xx Million. The competitive landscape is further shaped by increasing private label penetration, impacting the margins of major players.
- Market Concentration: Moderately concentrated, with regional variations.
- Innovation Ecosystems: Focus on packaging and flavor innovation to cater to local preferences.
- Regulatory Frameworks: Vary across African nations, influencing product standards and distribution.
- Product Substitutes: Carbonated soft drinks and fruit juices.
- End-User Trends: Growing preference for healthier, low-sugar options.
- M&A Activity: Moderate activity with an average deal value of xx Million (2019-2024).
RTD Tea Market in Africa Industry Trends & Insights
The African RTD tea market is experiencing robust growth, driven by factors such as rising disposable incomes, increasing urbanization, and changing consumer preferences towards convenient and healthier beverage choices. The market witnessed a CAGR of xx% during the historical period (2019-2024) and is projected to maintain a CAGR of xx% during the forecast period (2025-2033). Technological disruptions, such as improved packaging technologies and efficient distribution networks, are contributing to market expansion. Consumer preferences are increasingly influenced by health consciousness, with demand for low-sugar and functional teas growing rapidly. Market penetration remains relatively low in several African countries, presenting substantial untapped potential. Competitive dynamics are characterized by both intense competition among multinational corporations and the emergence of agile local players catering to niche markets. The increasing adoption of e-commerce channels is also altering distribution patterns and fostering direct-to-consumer (DTC) models, as seen with BOS Brands' new subscription service.
Dominant Markets & Segments in RTD Tea Market in Africa
The PET bottle segment dominates the RTD tea packaging market in Africa due to its cost-effectiveness and convenience. The off-trade channel (supermarkets, convenience stores) holds a larger market share compared to the on-trade channel (restaurants, cafes). Iced tea is the most popular RTD tea type, followed by herbal tea. South Africa and Nigeria are currently the leading markets, primarily driven by larger populations and established distribution networks.
- Key Drivers for PET Bottle Dominance: Cost-effectiveness, convenience, and suitability for various tea types.
- Key Drivers for Off-Trade Channel Dominance: Wider reach, established distribution networks, and ease of access for consumers.
- Key Drivers for Iced Tea's Popularity: Refreshing nature, suitability for hot climates, and familiarity among consumers.
- Key Drivers for South Africa and Nigeria's Market Leadership: Large population, high disposable incomes (relatively), and well-developed distribution networks.
RTD Tea Market in Africa Product Innovations
Recent years have seen significant innovations in RTD tea, focusing on diverse flavors tailored to local tastes, functional ingredients enhancing health benefits, and sustainable packaging options. Companies are investing in convenient packaging formats, such as single-serve bottles and cans, to meet the growing demand for on-the-go consumption. Technological advancements in processing and preservation techniques are extending shelf life and improving product quality. This is particularly noticeable with the rising trend of functional RTD teas, incorporating ingredients with health benefits.
Report Segmentation & Scope
This report segments the African RTD tea market across multiple parameters:
- Distribution Channel: Off-trade and On-trade, with growth projections and market size analysis for each channel. Competitive dynamics within each channel are also explored.
- Packaging Type: Aseptic packages, glass bottles, metal cans, and PET bottles, each analyzed for market share, growth trends, and competitive landscape.
- Soft Drink Type: Green tea, herbal tea, iced tea, and other RTD teas, including detailed analyses of each segment's growth potential, consumer preferences, and competitive dynamics.
Key Drivers of RTD Tea Market in Africa Growth
The growth of the RTD tea market in Africa is fueled by several key factors: increasing urbanization leading to a higher demand for convenient beverages; rising disposable incomes enabling higher spending on premium products; a growing preference for healthier beverage choices, driving demand for low-sugar and functional teas; and favorable government policies promoting domestic manufacturing and investment in the beverage industry. The expansion of retail infrastructure further contributes to market growth.
Challenges in the RTD Tea Market in Africa Sector
The RTD tea market in Africa faces challenges such as inconsistent infrastructure hindering efficient distribution in some regions; high import tariffs and taxes on raw materials and finished products; fluctuating raw material prices impacting production costs; and intense competition from established players and the emergence of local brands. These challenges vary across countries and pose significant operational obstacles.
Leading Players in the RTD Tea Market in Africa Market
- PepsiCo Inc
- Tata Consumer Products Ltd
- The Coca-Cola Company
- CWAY Group
- Dynamic Brands Manufacturing (Pty) Ltd
- Clover S A (Pty) Ltd
- BOS Brands (Pty) Ltd
Key Developments in RTD Tea Market in Africa Sector
- February 2021: BOS Brands launched a direct-to-consumer subscription service, enhancing brand reach and customer loyalty.
- January 2021: Clover S.A. launched a new range of Rooibos RTD tea products under the Manhattan Ice Tea brand, expanding product offerings and targeting new consumer segments.
- February 2019: BOS Brands (Pty) Ltd launched unsweetened iced tea in three new flavors, catering to health-conscious consumers.
Strategic RTD Tea Market in Africa Market Outlook
The African RTD tea market presents significant growth opportunities. Further expansion is expected, driven by increasing consumer demand for convenient and healthy beverages. Strategic opportunities exist in product innovation, tapping into emerging markets, and enhancing distribution networks to reach underserved areas. Companies focusing on local preferences, sustainable practices, and value-added offerings are likely to gain a competitive advantage. The market's continued growth will be shaped by the interplay of economic development, evolving consumer tastes, and technological advancements.
RTD Tea Market in Africa Segmentation
-
1. Soft Drink Type
- 1.1. Green Tea
- 1.2. Herbal Tea
- 1.3. Iced Tea
- 1.4. Other RTD Tea
-
2. Packaging Type
- 2.1. Aseptic packages
- 2.2. Glass Bottles
- 2.3. Metal Can
- 2.4. PET Bottles
-
3. Distribution Channel
-
3.1. Off-trade
- 3.1.1. Convenience Stores
- 3.1.2. Online Retail
- 3.1.3. Supermarket/Hypermarket
- 3.1.4. Others
- 3.2. On-trade
-
3.1. Off-trade
RTD Tea Market in Africa Segmentation By Geography
-
1. North America
- 1.1. United States
- 1.2. Canada
- 1.3. Mexico
-
2. South America
- 2.1. Brazil
- 2.2. Argentina
- 2.3. Rest of South America
-
3. Europe
- 3.1. United Kingdom
- 3.2. Germany
- 3.3. France
- 3.4. Italy
- 3.5. Spain
- 3.6. Russia
- 3.7. Benelux
- 3.8. Nordics
- 3.9. Rest of Europe
-
4. Middle East & Africa
- 4.1. Turkey
- 4.2. Israel
- 4.3. GCC
- 4.4. North Africa
- 4.5. South Africa
- 4.6. Rest of Middle East & Africa
-
5. Asia Pacific
- 5.1. China
- 5.2. India
- 5.3. Japan
- 5.4. South Korea
- 5.5. ASEAN
- 5.6. Oceania
- 5.7. Rest of Asia Pacific
RTD Tea Market in Africa REPORT HIGHLIGHTS
| Aspects | Details |
|---|---|
| Study Period | 2019-2033 |
| Base Year | 2024 |
| Estimated Year | 2025 |
| Forecast Period | 2025-2033 |
| Historical Period | 2019-2024 |
| Growth Rate | CAGR of 11.55% from 2019-2033 |
| Segmentation |
|
Table of Contents
- 1. Introduction
- 1.1. Research Scope
- 1.2. Market Segmentation
- 1.3. Research Methodology
- 1.4. Definitions and Assumptions
- 2. Executive Summary
- 2.1. Introduction
- 3. Market Dynamics
- 3.1. Introduction
- 3.2. Market Drivers
- 3.2.1. Increasing Demand for Protein-Rich Food; Increasing Demand for Plant-Based and Organic Ingredients
- 3.3. Market Restrains
- 3.3.1. Presence of Counterfeit Products
- 3.4. Market Trends
- 3.4.1. OTHER KEY INDUSTRY TRENDS COVERED IN THE REPORT
- 4. Market Factor Analysis
- 4.1. Porters Five Forces
- 4.2. Supply/Value Chain
- 4.3. PESTEL analysis
- 4.4. Market Entropy
- 4.5. Patent/Trademark Analysis
- 5. Global RTD Tea Market in Africa Analysis, Insights and Forecast, 2019-2031
- 5.1. Market Analysis, Insights and Forecast - by Soft Drink Type
- 5.1.1. Green Tea
- 5.1.2. Herbal Tea
- 5.1.3. Iced Tea
- 5.1.4. Other RTD Tea
- 5.2. Market Analysis, Insights and Forecast - by Packaging Type
- 5.2.1. Aseptic packages
- 5.2.2. Glass Bottles
- 5.2.3. Metal Can
- 5.2.4. PET Bottles
- 5.3. Market Analysis, Insights and Forecast - by Distribution Channel
- 5.3.1. Off-trade
- 5.3.1.1. Convenience Stores
- 5.3.1.2. Online Retail
- 5.3.1.3. Supermarket/Hypermarket
- 5.3.1.4. Others
- 5.3.2. On-trade
- 5.3.1. Off-trade
- 5.4. Market Analysis, Insights and Forecast - by Region
- 5.4.1. North America
- 5.4.2. South America
- 5.4.3. Europe
- 5.4.4. Middle East & Africa
- 5.4.5. Asia Pacific
- 5.1. Market Analysis, Insights and Forecast - by Soft Drink Type
- 6. North America RTD Tea Market in Africa Analysis, Insights and Forecast, 2019-2031
- 6.1. Market Analysis, Insights and Forecast - by Soft Drink Type
- 6.1.1. Green Tea
- 6.1.2. Herbal Tea
- 6.1.3. Iced Tea
- 6.1.4. Other RTD Tea
- 6.2. Market Analysis, Insights and Forecast - by Packaging Type
- 6.2.1. Aseptic packages
- 6.2.2. Glass Bottles
- 6.2.3. Metal Can
- 6.2.4. PET Bottles
- 6.3. Market Analysis, Insights and Forecast - by Distribution Channel
- 6.3.1. Off-trade
- 6.3.1.1. Convenience Stores
- 6.3.1.2. Online Retail
- 6.3.1.3. Supermarket/Hypermarket
- 6.3.1.4. Others
- 6.3.2. On-trade
- 6.3.1. Off-trade
- 6.1. Market Analysis, Insights and Forecast - by Soft Drink Type
- 7. South America RTD Tea Market in Africa Analysis, Insights and Forecast, 2019-2031
- 7.1. Market Analysis, Insights and Forecast - by Soft Drink Type
- 7.1.1. Green Tea
- 7.1.2. Herbal Tea
- 7.1.3. Iced Tea
- 7.1.4. Other RTD Tea
- 7.2. Market Analysis, Insights and Forecast - by Packaging Type
- 7.2.1. Aseptic packages
- 7.2.2. Glass Bottles
- 7.2.3. Metal Can
- 7.2.4. PET Bottles
- 7.3. Market Analysis, Insights and Forecast - by Distribution Channel
- 7.3.1. Off-trade
- 7.3.1.1. Convenience Stores
- 7.3.1.2. Online Retail
- 7.3.1.3. Supermarket/Hypermarket
- 7.3.1.4. Others
- 7.3.2. On-trade
- 7.3.1. Off-trade
- 7.1. Market Analysis, Insights and Forecast - by Soft Drink Type
- 8. Europe RTD Tea Market in Africa Analysis, Insights and Forecast, 2019-2031
- 8.1. Market Analysis, Insights and Forecast - by Soft Drink Type
- 8.1.1. Green Tea
- 8.1.2. Herbal Tea
- 8.1.3. Iced Tea
- 8.1.4. Other RTD Tea
- 8.2. Market Analysis, Insights and Forecast - by Packaging Type
- 8.2.1. Aseptic packages
- 8.2.2. Glass Bottles
- 8.2.3. Metal Can
- 8.2.4. PET Bottles
- 8.3. Market Analysis, Insights and Forecast - by Distribution Channel
- 8.3.1. Off-trade
- 8.3.1.1. Convenience Stores
- 8.3.1.2. Online Retail
- 8.3.1.3. Supermarket/Hypermarket
- 8.3.1.4. Others
- 8.3.2. On-trade
- 8.3.1. Off-trade
- 8.1. Market Analysis, Insights and Forecast - by Soft Drink Type
- 9. Middle East & Africa RTD Tea Market in Africa Analysis, Insights and Forecast, 2019-2031
- 9.1. Market Analysis, Insights and Forecast - by Soft Drink Type
- 9.1.1. Green Tea
- 9.1.2. Herbal Tea
- 9.1.3. Iced Tea
- 9.1.4. Other RTD Tea
- 9.2. Market Analysis, Insights and Forecast - by Packaging Type
- 9.2.1. Aseptic packages
- 9.2.2. Glass Bottles
- 9.2.3. Metal Can
- 9.2.4. PET Bottles
- 9.3. Market Analysis, Insights and Forecast - by Distribution Channel
- 9.3.1. Off-trade
- 9.3.1.1. Convenience Stores
- 9.3.1.2. Online Retail
- 9.3.1.3. Supermarket/Hypermarket
- 9.3.1.4. Others
- 9.3.2. On-trade
- 9.3.1. Off-trade
- 9.1. Market Analysis, Insights and Forecast - by Soft Drink Type
- 10. Asia Pacific RTD Tea Market in Africa Analysis, Insights and Forecast, 2019-2031
- 10.1. Market Analysis, Insights and Forecast - by Soft Drink Type
- 10.1.1. Green Tea
- 10.1.2. Herbal Tea
- 10.1.3. Iced Tea
- 10.1.4. Other RTD Tea
- 10.2. Market Analysis, Insights and Forecast - by Packaging Type
- 10.2.1. Aseptic packages
- 10.2.2. Glass Bottles
- 10.2.3. Metal Can
- 10.2.4. PET Bottles
- 10.3. Market Analysis, Insights and Forecast - by Distribution Channel
- 10.3.1. Off-trade
- 10.3.1.1. Convenience Stores
- 10.3.1.2. Online Retail
- 10.3.1.3. Supermarket/Hypermarket
- 10.3.1.4. Others
- 10.3.2. On-trade
- 10.3.1. Off-trade
- 10.1. Market Analysis, Insights and Forecast - by Soft Drink Type
- 11. South Africa RTD Tea Market in Africa Analysis, Insights and Forecast, 2019-2031
- 12. Sudan RTD Tea Market in Africa Analysis, Insights and Forecast, 2019-2031
- 13. Uganda RTD Tea Market in Africa Analysis, Insights and Forecast, 2019-2031
- 14. Tanzania RTD Tea Market in Africa Analysis, Insights and Forecast, 2019-2031
- 15. Kenya RTD Tea Market in Africa Analysis, Insights and Forecast, 2019-2031
- 16. Rest of Africa RTD Tea Market in Africa Analysis, Insights and Forecast, 2019-2031
- 17. Competitive Analysis
- 17.1. Global Market Share Analysis 2024
- 17.2. Company Profiles
- 17.2.1 PepsiCo Inc
- 17.2.1.1. Overview
- 17.2.1.2. Products
- 17.2.1.3. SWOT Analysis
- 17.2.1.4. Recent Developments
- 17.2.1.5. Financials (Based on Availability)
- 17.2.2 Tata Consumer Products Ltd
- 17.2.2.1. Overview
- 17.2.2.2. Products
- 17.2.2.3. SWOT Analysis
- 17.2.2.4. Recent Developments
- 17.2.2.5. Financials (Based on Availability)
- 17.2.3 The Coca-Cola Compan
- 17.2.3.1. Overview
- 17.2.3.2. Products
- 17.2.3.3. SWOT Analysis
- 17.2.3.4. Recent Developments
- 17.2.3.5. Financials (Based on Availability)
- 17.2.4 CWAY Group
- 17.2.4.1. Overview
- 17.2.4.2. Products
- 17.2.4.3. SWOT Analysis
- 17.2.4.4. Recent Developments
- 17.2.4.5. Financials (Based on Availability)
- 17.2.5 Dynamic Brands Manufacturing (Pty) Ltd
- 17.2.5.1. Overview
- 17.2.5.2. Products
- 17.2.5.3. SWOT Analysis
- 17.2.5.4. Recent Developments
- 17.2.5.5. Financials (Based on Availability)
- 17.2.6 Clover S A (Pty) Ltd
- 17.2.6.1. Overview
- 17.2.6.2. Products
- 17.2.6.3. SWOT Analysis
- 17.2.6.4. Recent Developments
- 17.2.6.5. Financials (Based on Availability)
- 17.2.7 BOS Brands (Pty) Ltd
- 17.2.7.1. Overview
- 17.2.7.2. Products
- 17.2.7.3. SWOT Analysis
- 17.2.7.4. Recent Developments
- 17.2.7.5. Financials (Based on Availability)
- 17.2.1 PepsiCo Inc
List of Figures
- Figure 1: Global RTD Tea Market in Africa Revenue Breakdown (Million, %) by Region 2024 & 2032
- Figure 2: Global RTD Tea Market in Africa Volume Breakdown (K Tons, %) by Region 2024 & 2032
- Figure 3: Africa RTD Tea Market in Africa Revenue (Million), by Country 2024 & 2032
- Figure 4: Africa RTD Tea Market in Africa Volume (K Tons), by Country 2024 & 2032
- Figure 5: Africa RTD Tea Market in Africa Revenue Share (%), by Country 2024 & 2032
- Figure 6: Africa RTD Tea Market in Africa Volume Share (%), by Country 2024 & 2032
- Figure 7: North America RTD Tea Market in Africa Revenue (Million), by Soft Drink Type 2024 & 2032
- Figure 8: North America RTD Tea Market in Africa Volume (K Tons), by Soft Drink Type 2024 & 2032
- Figure 9: North America RTD Tea Market in Africa Revenue Share (%), by Soft Drink Type 2024 & 2032
- Figure 10: North America RTD Tea Market in Africa Volume Share (%), by Soft Drink Type 2024 & 2032
- Figure 11: North America RTD Tea Market in Africa Revenue (Million), by Packaging Type 2024 & 2032
- Figure 12: North America RTD Tea Market in Africa Volume (K Tons), by Packaging Type 2024 & 2032
- Figure 13: North America RTD Tea Market in Africa Revenue Share (%), by Packaging Type 2024 & 2032
- Figure 14: North America RTD Tea Market in Africa Volume Share (%), by Packaging Type 2024 & 2032
- Figure 15: North America RTD Tea Market in Africa Revenue (Million), by Distribution Channel 2024 & 2032
- Figure 16: North America RTD Tea Market in Africa Volume (K Tons), by Distribution Channel 2024 & 2032
- Figure 17: North America RTD Tea Market in Africa Revenue Share (%), by Distribution Channel 2024 & 2032
- Figure 18: North America RTD Tea Market in Africa Volume Share (%), by Distribution Channel 2024 & 2032
- Figure 19: North America RTD Tea Market in Africa Revenue (Million), by Country 2024 & 2032
- Figure 20: North America RTD Tea Market in Africa Volume (K Tons), by Country 2024 & 2032
- Figure 21: North America RTD Tea Market in Africa Revenue Share (%), by Country 2024 & 2032
- Figure 22: North America RTD Tea Market in Africa Volume Share (%), by Country 2024 & 2032
- Figure 23: South America RTD Tea Market in Africa Revenue (Million), by Soft Drink Type 2024 & 2032
- Figure 24: South America RTD Tea Market in Africa Volume (K Tons), by Soft Drink Type 2024 & 2032
- Figure 25: South America RTD Tea Market in Africa Revenue Share (%), by Soft Drink Type 2024 & 2032
- Figure 26: South America RTD Tea Market in Africa Volume Share (%), by Soft Drink Type 2024 & 2032
- Figure 27: South America RTD Tea Market in Africa Revenue (Million), by Packaging Type 2024 & 2032
- Figure 28: South America RTD Tea Market in Africa Volume (K Tons), by Packaging Type 2024 & 2032
- Figure 29: South America RTD Tea Market in Africa Revenue Share (%), by Packaging Type 2024 & 2032
- Figure 30: South America RTD Tea Market in Africa Volume Share (%), by Packaging Type 2024 & 2032
- Figure 31: South America RTD Tea Market in Africa Revenue (Million), by Distribution Channel 2024 & 2032
- Figure 32: South America RTD Tea Market in Africa Volume (K Tons), by Distribution Channel 2024 & 2032
- Figure 33: South America RTD Tea Market in Africa Revenue Share (%), by Distribution Channel 2024 & 2032
- Figure 34: South America RTD Tea Market in Africa Volume Share (%), by Distribution Channel 2024 & 2032
- Figure 35: South America RTD Tea Market in Africa Revenue (Million), by Country 2024 & 2032
- Figure 36: South America RTD Tea Market in Africa Volume (K Tons), by Country 2024 & 2032
- Figure 37: South America RTD Tea Market in Africa Revenue Share (%), by Country 2024 & 2032
- Figure 38: South America RTD Tea Market in Africa Volume Share (%), by Country 2024 & 2032
- Figure 39: Europe RTD Tea Market in Africa Revenue (Million), by Soft Drink Type 2024 & 2032
- Figure 40: Europe RTD Tea Market in Africa Volume (K Tons), by Soft Drink Type 2024 & 2032
- Figure 41: Europe RTD Tea Market in Africa Revenue Share (%), by Soft Drink Type 2024 & 2032
- Figure 42: Europe RTD Tea Market in Africa Volume Share (%), by Soft Drink Type 2024 & 2032
- Figure 43: Europe RTD Tea Market in Africa Revenue (Million), by Packaging Type 2024 & 2032
- Figure 44: Europe RTD Tea Market in Africa Volume (K Tons), by Packaging Type 2024 & 2032
- Figure 45: Europe RTD Tea Market in Africa Revenue Share (%), by Packaging Type 2024 & 2032
- Figure 46: Europe RTD Tea Market in Africa Volume Share (%), by Packaging Type 2024 & 2032
- Figure 47: Europe RTD Tea Market in Africa Revenue (Million), by Distribution Channel 2024 & 2032
- Figure 48: Europe RTD Tea Market in Africa Volume (K Tons), by Distribution Channel 2024 & 2032
- Figure 49: Europe RTD Tea Market in Africa Revenue Share (%), by Distribution Channel 2024 & 2032
- Figure 50: Europe RTD Tea Market in Africa Volume Share (%), by Distribution Channel 2024 & 2032
- Figure 51: Europe RTD Tea Market in Africa Revenue (Million), by Country 2024 & 2032
- Figure 52: Europe RTD Tea Market in Africa Volume (K Tons), by Country 2024 & 2032
- Figure 53: Europe RTD Tea Market in Africa Revenue Share (%), by Country 2024 & 2032
- Figure 54: Europe RTD Tea Market in Africa Volume Share (%), by Country 2024 & 2032
- Figure 55: Middle East & Africa RTD Tea Market in Africa Revenue (Million), by Soft Drink Type 2024 & 2032
- Figure 56: Middle East & Africa RTD Tea Market in Africa Volume (K Tons), by Soft Drink Type 2024 & 2032
- Figure 57: Middle East & Africa RTD Tea Market in Africa Revenue Share (%), by Soft Drink Type 2024 & 2032
- Figure 58: Middle East & Africa RTD Tea Market in Africa Volume Share (%), by Soft Drink Type 2024 & 2032
- Figure 59: Middle East & Africa RTD Tea Market in Africa Revenue (Million), by Packaging Type 2024 & 2032
- Figure 60: Middle East & Africa RTD Tea Market in Africa Volume (K Tons), by Packaging Type 2024 & 2032
- Figure 61: Middle East & Africa RTD Tea Market in Africa Revenue Share (%), by Packaging Type 2024 & 2032
- Figure 62: Middle East & Africa RTD Tea Market in Africa Volume Share (%), by Packaging Type 2024 & 2032
- Figure 63: Middle East & Africa RTD Tea Market in Africa Revenue (Million), by Distribution Channel 2024 & 2032
- Figure 64: Middle East & Africa RTD Tea Market in Africa Volume (K Tons), by Distribution Channel 2024 & 2032
- Figure 65: Middle East & Africa RTD Tea Market in Africa Revenue Share (%), by Distribution Channel 2024 & 2032
- Figure 66: Middle East & Africa RTD Tea Market in Africa Volume Share (%), by Distribution Channel 2024 & 2032
- Figure 67: Middle East & Africa RTD Tea Market in Africa Revenue (Million), by Country 2024 & 2032
- Figure 68: Middle East & Africa RTD Tea Market in Africa Volume (K Tons), by Country 2024 & 2032
- Figure 69: Middle East & Africa RTD Tea Market in Africa Revenue Share (%), by Country 2024 & 2032
- Figure 70: Middle East & Africa RTD Tea Market in Africa Volume Share (%), by Country 2024 & 2032
- Figure 71: Asia Pacific RTD Tea Market in Africa Revenue (Million), by Soft Drink Type 2024 & 2032
- Figure 72: Asia Pacific RTD Tea Market in Africa Volume (K Tons), by Soft Drink Type 2024 & 2032
- Figure 73: Asia Pacific RTD Tea Market in Africa Revenue Share (%), by Soft Drink Type 2024 & 2032
- Figure 74: Asia Pacific RTD Tea Market in Africa Volume Share (%), by Soft Drink Type 2024 & 2032
- Figure 75: Asia Pacific RTD Tea Market in Africa Revenue (Million), by Packaging Type 2024 & 2032
- Figure 76: Asia Pacific RTD Tea Market in Africa Volume (K Tons), by Packaging Type 2024 & 2032
- Figure 77: Asia Pacific RTD Tea Market in Africa Revenue Share (%), by Packaging Type 2024 & 2032
- Figure 78: Asia Pacific RTD Tea Market in Africa Volume Share (%), by Packaging Type 2024 & 2032
- Figure 79: Asia Pacific RTD Tea Market in Africa Revenue (Million), by Distribution Channel 2024 & 2032
- Figure 80: Asia Pacific RTD Tea Market in Africa Volume (K Tons), by Distribution Channel 2024 & 2032
- Figure 81: Asia Pacific RTD Tea Market in Africa Revenue Share (%), by Distribution Channel 2024 & 2032
- Figure 82: Asia Pacific RTD Tea Market in Africa Volume Share (%), by Distribution Channel 2024 & 2032
- Figure 83: Asia Pacific RTD Tea Market in Africa Revenue (Million), by Country 2024 & 2032
- Figure 84: Asia Pacific RTD Tea Market in Africa Volume (K Tons), by Country 2024 & 2032
- Figure 85: Asia Pacific RTD Tea Market in Africa Revenue Share (%), by Country 2024 & 2032
- Figure 86: Asia Pacific RTD Tea Market in Africa Volume Share (%), by Country 2024 & 2032
List of Tables
- Table 1: Global RTD Tea Market in Africa Revenue Million Forecast, by Region 2019 & 2032
- Table 2: Global RTD Tea Market in Africa Volume K Tons Forecast, by Region 2019 & 2032
- Table 3: Global RTD Tea Market in Africa Revenue Million Forecast, by Soft Drink Type 2019 & 2032
- Table 4: Global RTD Tea Market in Africa Volume K Tons Forecast, by Soft Drink Type 2019 & 2032
- Table 5: Global RTD Tea Market in Africa Revenue Million Forecast, by Packaging Type 2019 & 2032
- Table 6: Global RTD Tea Market in Africa Volume K Tons Forecast, by Packaging Type 2019 & 2032
- Table 7: Global RTD Tea Market in Africa Revenue Million Forecast, by Distribution Channel 2019 & 2032
- Table 8: Global RTD Tea Market in Africa Volume K Tons Forecast, by Distribution Channel 2019 & 2032
- Table 9: Global RTD Tea Market in Africa Revenue Million Forecast, by Region 2019 & 2032
- Table 10: Global RTD Tea Market in Africa Volume K Tons Forecast, by Region 2019 & 2032
- Table 11: Global RTD Tea Market in Africa Revenue Million Forecast, by Country 2019 & 2032
- Table 12: Global RTD Tea Market in Africa Volume K Tons Forecast, by Country 2019 & 2032
- Table 13: South Africa RTD Tea Market in Africa Revenue (Million) Forecast, by Application 2019 & 2032
- Table 14: South Africa RTD Tea Market in Africa Volume (K Tons) Forecast, by Application 2019 & 2032
- Table 15: Sudan RTD Tea Market in Africa Revenue (Million) Forecast, by Application 2019 & 2032
- Table 16: Sudan RTD Tea Market in Africa Volume (K Tons) Forecast, by Application 2019 & 2032
- Table 17: Uganda RTD Tea Market in Africa Revenue (Million) Forecast, by Application 2019 & 2032
- Table 18: Uganda RTD Tea Market in Africa Volume (K Tons) Forecast, by Application 2019 & 2032
- Table 19: Tanzania RTD Tea Market in Africa Revenue (Million) Forecast, by Application 2019 & 2032
- Table 20: Tanzania RTD Tea Market in Africa Volume (K Tons) Forecast, by Application 2019 & 2032
- Table 21: Kenya RTD Tea Market in Africa Revenue (Million) Forecast, by Application 2019 & 2032
- Table 22: Kenya RTD Tea Market in Africa Volume (K Tons) Forecast, by Application 2019 & 2032
- Table 23: Rest of Africa RTD Tea Market in Africa Revenue (Million) Forecast, by Application 2019 & 2032
- Table 24: Rest of Africa RTD Tea Market in Africa Volume (K Tons) Forecast, by Application 2019 & 2032
- Table 25: Global RTD Tea Market in Africa Revenue Million Forecast, by Soft Drink Type 2019 & 2032
- Table 26: Global RTD Tea Market in Africa Volume K Tons Forecast, by Soft Drink Type 2019 & 2032
- Table 27: Global RTD Tea Market in Africa Revenue Million Forecast, by Packaging Type 2019 & 2032
- Table 28: Global RTD Tea Market in Africa Volume K Tons Forecast, by Packaging Type 2019 & 2032
- Table 29: Global RTD Tea Market in Africa Revenue Million Forecast, by Distribution Channel 2019 & 2032
- Table 30: Global RTD Tea Market in Africa Volume K Tons Forecast, by Distribution Channel 2019 & 2032
- Table 31: Global RTD Tea Market in Africa Revenue Million Forecast, by Country 2019 & 2032
- Table 32: Global RTD Tea Market in Africa Volume K Tons Forecast, by Country 2019 & 2032
- Table 33: United States RTD Tea Market in Africa Revenue (Million) Forecast, by Application 2019 & 2032
- Table 34: United States RTD Tea Market in Africa Volume (K Tons) Forecast, by Application 2019 & 2032
- Table 35: Canada RTD Tea Market in Africa Revenue (Million) Forecast, by Application 2019 & 2032
- Table 36: Canada RTD Tea Market in Africa Volume (K Tons) Forecast, by Application 2019 & 2032
- Table 37: Mexico RTD Tea Market in Africa Revenue (Million) Forecast, by Application 2019 & 2032
- Table 38: Mexico RTD Tea Market in Africa Volume (K Tons) Forecast, by Application 2019 & 2032
- Table 39: Global RTD Tea Market in Africa Revenue Million Forecast, by Soft Drink Type 2019 & 2032
- Table 40: Global RTD Tea Market in Africa Volume K Tons Forecast, by Soft Drink Type 2019 & 2032
- Table 41: Global RTD Tea Market in Africa Revenue Million Forecast, by Packaging Type 2019 & 2032
- Table 42: Global RTD Tea Market in Africa Volume K Tons Forecast, by Packaging Type 2019 & 2032
- Table 43: Global RTD Tea Market in Africa Revenue Million Forecast, by Distribution Channel 2019 & 2032
- Table 44: Global RTD Tea Market in Africa Volume K Tons Forecast, by Distribution Channel 2019 & 2032
- Table 45: Global RTD Tea Market in Africa Revenue Million Forecast, by Country 2019 & 2032
- Table 46: Global RTD Tea Market in Africa Volume K Tons Forecast, by Country 2019 & 2032
- Table 47: Brazil RTD Tea Market in Africa Revenue (Million) Forecast, by Application 2019 & 2032
- Table 48: Brazil RTD Tea Market in Africa Volume (K Tons) Forecast, by Application 2019 & 2032
- Table 49: Argentina RTD Tea Market in Africa Revenue (Million) Forecast, by Application 2019 & 2032
- Table 50: Argentina RTD Tea Market in Africa Volume (K Tons) Forecast, by Application 2019 & 2032
- Table 51: Rest of South America RTD Tea Market in Africa Revenue (Million) Forecast, by Application 2019 & 2032
- Table 52: Rest of South America RTD Tea Market in Africa Volume (K Tons) Forecast, by Application 2019 & 2032
- Table 53: Global RTD Tea Market in Africa Revenue Million Forecast, by Soft Drink Type 2019 & 2032
- Table 54: Global RTD Tea Market in Africa Volume K Tons Forecast, by Soft Drink Type 2019 & 2032
- Table 55: Global RTD Tea Market in Africa Revenue Million Forecast, by Packaging Type 2019 & 2032
- Table 56: Global RTD Tea Market in Africa Volume K Tons Forecast, by Packaging Type 2019 & 2032
- Table 57: Global RTD Tea Market in Africa Revenue Million Forecast, by Distribution Channel 2019 & 2032
- Table 58: Global RTD Tea Market in Africa Volume K Tons Forecast, by Distribution Channel 2019 & 2032
- Table 59: Global RTD Tea Market in Africa Revenue Million Forecast, by Country 2019 & 2032
- Table 60: Global RTD Tea Market in Africa Volume K Tons Forecast, by Country 2019 & 2032
- Table 61: United Kingdom RTD Tea Market in Africa Revenue (Million) Forecast, by Application 2019 & 2032
- Table 62: United Kingdom RTD Tea Market in Africa Volume (K Tons) Forecast, by Application 2019 & 2032
- Table 63: Germany RTD Tea Market in Africa Revenue (Million) Forecast, by Application 2019 & 2032
- Table 64: Germany RTD Tea Market in Africa Volume (K Tons) Forecast, by Application 2019 & 2032
- Table 65: France RTD Tea Market in Africa Revenue (Million) Forecast, by Application 2019 & 2032
- Table 66: France RTD Tea Market in Africa Volume (K Tons) Forecast, by Application 2019 & 2032
- Table 67: Italy RTD Tea Market in Africa Revenue (Million) Forecast, by Application 2019 & 2032
- Table 68: Italy RTD Tea Market in Africa Volume (K Tons) Forecast, by Application 2019 & 2032
- Table 69: Spain RTD Tea Market in Africa Revenue (Million) Forecast, by Application 2019 & 2032
- Table 70: Spain RTD Tea Market in Africa Volume (K Tons) Forecast, by Application 2019 & 2032
- Table 71: Russia RTD Tea Market in Africa Revenue (Million) Forecast, by Application 2019 & 2032
- Table 72: Russia RTD Tea Market in Africa Volume (K Tons) Forecast, by Application 2019 & 2032
- Table 73: Benelux RTD Tea Market in Africa Revenue (Million) Forecast, by Application 2019 & 2032
- Table 74: Benelux RTD Tea Market in Africa Volume (K Tons) Forecast, by Application 2019 & 2032
- Table 75: Nordics RTD Tea Market in Africa Revenue (Million) Forecast, by Application 2019 & 2032
- Table 76: Nordics RTD Tea Market in Africa Volume (K Tons) Forecast, by Application 2019 & 2032
- Table 77: Rest of Europe RTD Tea Market in Africa Revenue (Million) Forecast, by Application 2019 & 2032
- Table 78: Rest of Europe RTD Tea Market in Africa Volume (K Tons) Forecast, by Application 2019 & 2032
- Table 79: Global RTD Tea Market in Africa Revenue Million Forecast, by Soft Drink Type 2019 & 2032
- Table 80: Global RTD Tea Market in Africa Volume K Tons Forecast, by Soft Drink Type 2019 & 2032
- Table 81: Global RTD Tea Market in Africa Revenue Million Forecast, by Packaging Type 2019 & 2032
- Table 82: Global RTD Tea Market in Africa Volume K Tons Forecast, by Packaging Type 2019 & 2032
- Table 83: Global RTD Tea Market in Africa Revenue Million Forecast, by Distribution Channel 2019 & 2032
- Table 84: Global RTD Tea Market in Africa Volume K Tons Forecast, by Distribution Channel 2019 & 2032
- Table 85: Global RTD Tea Market in Africa Revenue Million Forecast, by Country 2019 & 2032
- Table 86: Global RTD Tea Market in Africa Volume K Tons Forecast, by Country 2019 & 2032
- Table 87: Turkey RTD Tea Market in Africa Revenue (Million) Forecast, by Application 2019 & 2032
- Table 88: Turkey RTD Tea Market in Africa Volume (K Tons) Forecast, by Application 2019 & 2032
- Table 89: Israel RTD Tea Market in Africa Revenue (Million) Forecast, by Application 2019 & 2032
- Table 90: Israel RTD Tea Market in Africa Volume (K Tons) Forecast, by Application 2019 & 2032
- Table 91: GCC RTD Tea Market in Africa Revenue (Million) Forecast, by Application 2019 & 2032
- Table 92: GCC RTD Tea Market in Africa Volume (K Tons) Forecast, by Application 2019 & 2032
- Table 93: North Africa RTD Tea Market in Africa Revenue (Million) Forecast, by Application 2019 & 2032
- Table 94: North Africa RTD Tea Market in Africa Volume (K Tons) Forecast, by Application 2019 & 2032
- Table 95: South Africa RTD Tea Market in Africa Revenue (Million) Forecast, by Application 2019 & 2032
- Table 96: South Africa RTD Tea Market in Africa Volume (K Tons) Forecast, by Application 2019 & 2032
- Table 97: Rest of Middle East & Africa RTD Tea Market in Africa Revenue (Million) Forecast, by Application 2019 & 2032
- Table 98: Rest of Middle East & Africa RTD Tea Market in Africa Volume (K Tons) Forecast, by Application 2019 & 2032
- Table 99: Global RTD Tea Market in Africa Revenue Million Forecast, by Soft Drink Type 2019 & 2032
- Table 100: Global RTD Tea Market in Africa Volume K Tons Forecast, by Soft Drink Type 2019 & 2032
- Table 101: Global RTD Tea Market in Africa Revenue Million Forecast, by Packaging Type 2019 & 2032
- Table 102: Global RTD Tea Market in Africa Volume K Tons Forecast, by Packaging Type 2019 & 2032
- Table 103: Global RTD Tea Market in Africa Revenue Million Forecast, by Distribution Channel 2019 & 2032
- Table 104: Global RTD Tea Market in Africa Volume K Tons Forecast, by Distribution Channel 2019 & 2032
- Table 105: Global RTD Tea Market in Africa Revenue Million Forecast, by Country 2019 & 2032
- Table 106: Global RTD Tea Market in Africa Volume K Tons Forecast, by Country 2019 & 2032
- Table 107: China RTD Tea Market in Africa Revenue (Million) Forecast, by Application 2019 & 2032
- Table 108: China RTD Tea Market in Africa Volume (K Tons) Forecast, by Application 2019 & 2032
- Table 109: India RTD Tea Market in Africa Revenue (Million) Forecast, by Application 2019 & 2032
- Table 110: India RTD Tea Market in Africa Volume (K Tons) Forecast, by Application 2019 & 2032
- Table 111: Japan RTD Tea Market in Africa Revenue (Million) Forecast, by Application 2019 & 2032
- Table 112: Japan RTD Tea Market in Africa Volume (K Tons) Forecast, by Application 2019 & 2032
- Table 113: South Korea RTD Tea Market in Africa Revenue (Million) Forecast, by Application 2019 & 2032
- Table 114: South Korea RTD Tea Market in Africa Volume (K Tons) Forecast, by Application 2019 & 2032
- Table 115: ASEAN RTD Tea Market in Africa Revenue (Million) Forecast, by Application 2019 & 2032
- Table 116: ASEAN RTD Tea Market in Africa Volume (K Tons) Forecast, by Application 2019 & 2032
- Table 117: Oceania RTD Tea Market in Africa Revenue (Million) Forecast, by Application 2019 & 2032
- Table 118: Oceania RTD Tea Market in Africa Volume (K Tons) Forecast, by Application 2019 & 2032
- Table 119: Rest of Asia Pacific RTD Tea Market in Africa Revenue (Million) Forecast, by Application 2019 & 2032
- Table 120: Rest of Asia Pacific RTD Tea Market in Africa Volume (K Tons) Forecast, by Application 2019 & 2032
Frequently Asked Questions
1. What is the projected Compound Annual Growth Rate (CAGR) of the RTD Tea Market in Africa?
The projected CAGR is approximately 11.55%.
2. Which companies are prominent players in the RTD Tea Market in Africa?
Key companies in the market include PepsiCo Inc, Tata Consumer Products Ltd, The Coca-Cola Compan, CWAY Group, Dynamic Brands Manufacturing (Pty) Ltd, Clover S A (Pty) Ltd, BOS Brands (Pty) Ltd.
3. What are the main segments of the RTD Tea Market in Africa?
The market segments include Soft Drink Type, Packaging Type, Distribution Channel.
4. Can you provide details about the market size?
The market size is estimated to be USD XX Million as of 2022.
5. What are some drivers contributing to market growth?
Increasing Demand for Protein-Rich Food; Increasing Demand for Plant-Based and Organic Ingredients.
6. What are the notable trends driving market growth?
OTHER KEY INDUSTRY TRENDS COVERED IN THE REPORT.
7. Are there any restraints impacting market growth?
Presence of Counterfeit Products.
8. Can you provide examples of recent developments in the market?
February 2021: BOS Brands ramped up its direct-toconsumer offerings, through a new subscription service. This service makes BOS products available to consumers directly from the brand, and at a discounted rate for monthly orders.January 2021: Manhattan Ice Tea, a brand under Clover S.A. launched a new range of Rooibos RTD Tea products. This new range includes two new rooibos RTD Tea products, which are available in Lemon and Mixed Berry flavours.These products contain mineral water, fructose, sugar, citric acid, rooibos tea extract, acidity regulators, flavouring, preservatives, and colourants, as well sweeteners.February 2019: BOS Brands (Pty) Ltd launched unsweetened iced tea in three flavors such as blueberry and jasmine, white peach and elderflower, and pineapple and coconut.
9. What pricing options are available for accessing the report?
Pricing options include single-user, multi-user, and enterprise licenses priced at USD 3800, USD 4500, and USD 5800 respectively.
10. Is the market size provided in terms of value or volume?
The market size is provided in terms of value, measured in Million and volume, measured in K Tons.
11. Are there any specific market keywords associated with the report?
Yes, the market keyword associated with the report is "RTD Tea Market in Africa," which aids in identifying and referencing the specific market segment covered.
12. How do I determine which pricing option suits my needs best?
The pricing options vary based on user requirements and access needs. Individual users may opt for single-user licenses, while businesses requiring broader access may choose multi-user or enterprise licenses for cost-effective access to the report.
13. Are there any additional resources or data provided in the RTD Tea Market in Africa report?
While the report offers comprehensive insights, it's advisable to review the specific contents or supplementary materials provided to ascertain if additional resources or data are available.
14. How can I stay updated on further developments or reports in the RTD Tea Market in Africa?
To stay informed about further developments, trends, and reports in the RTD Tea Market in Africa, consider subscribing to industry newsletters, following relevant companies and organizations, or regularly checking reputable industry news sources and publications.
Methodology
Step 1 - Identification of Relevant Samples Size from Population Database


Step 2 - Approaches for Defining Global Market Size (Value, Volume* & Price*)

Note*: In applicable scenarios
Step 3 - Data Sources
Primary Research
- Web Analytics
- Survey Reports
- Research Institute
- Latest Research Reports
- Opinion Leaders
Secondary Research
- Annual Reports
- White Paper
- Latest Press Release
- Industry Association
- Paid Database
- Investor Presentations

Step 4 - Data Triangulation
Involves using different sources of information in order to increase the validity of a study
These sources are likely to be stakeholders in a program - participants, other researchers, program staff, other community members, and so on.
Then we put all data in single framework & apply various statistical tools to find out the dynamic on the market.
During the analysis stage, feedback from the stakeholder groups would be compared to determine areas of agreement as well as areas of divergence


