
Key Insights
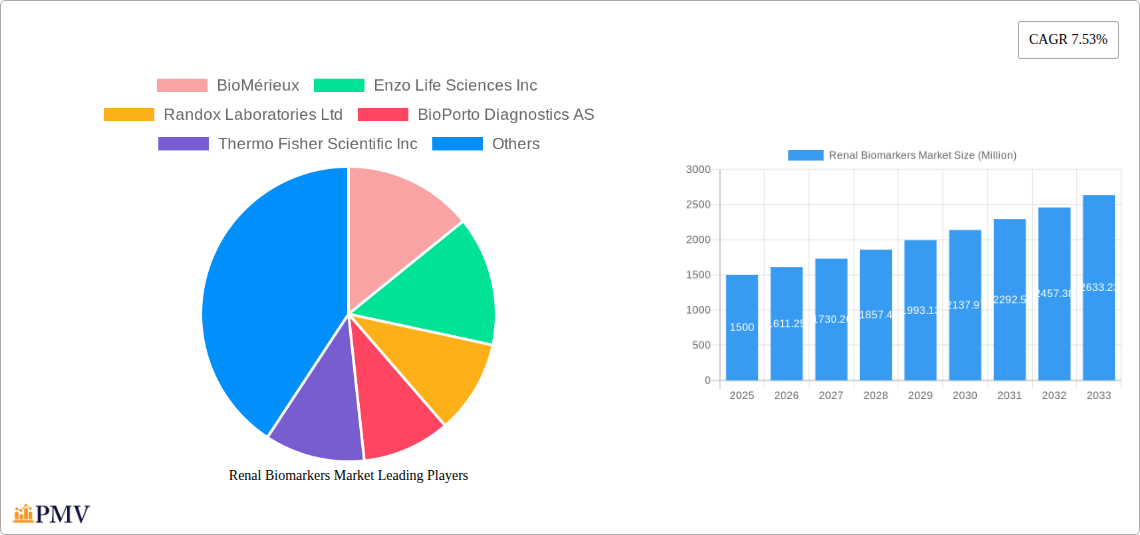
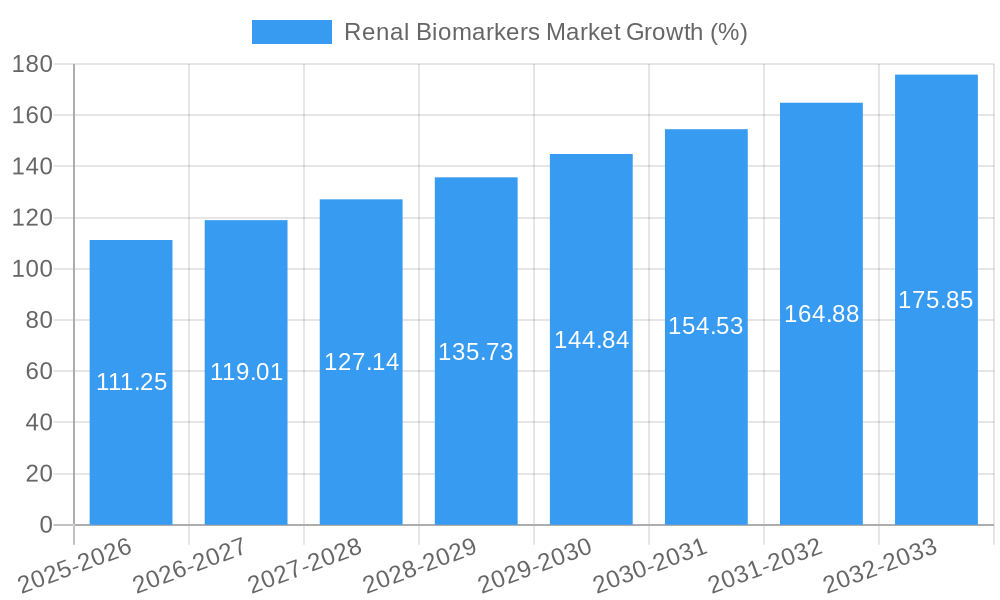
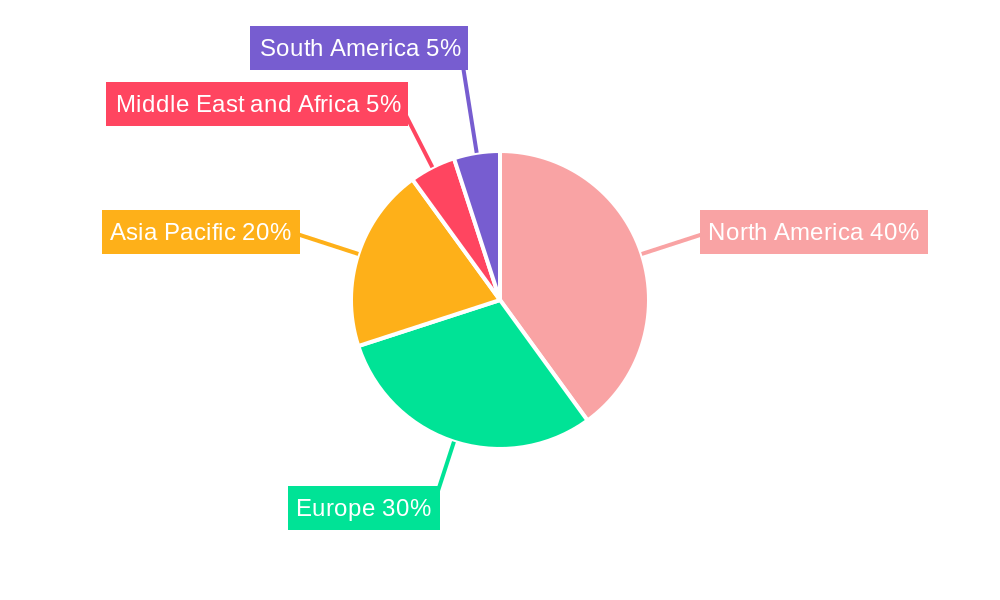
The global renal biomarkers market, valued at $1.5 billion in 2025, is projected to experience robust growth, driven by a 7.53% CAGR from 2025 to 2033. This expansion is fueled by several key factors. The increasing prevalence of chronic kidney disease (CKD) and other renal disorders globally is a major driver, necessitating more accurate and timely diagnostic tools. Advancements in biomarker technology, particularly in areas like liquid chromatography-mass spectrometry (LC-MS) and enzyme-linked immunosorbent assays (ELISA), are leading to more sensitive and specific tests, improving early detection and personalized treatment strategies. Furthermore, the rising adoption of point-of-care diagnostics and the growing demand for improved patient outcomes are contributing to market growth. The market is segmented by biomarker type (functional biomarkers, urine albumin, interleukins, and others), diagnostic technique (ELISA, PETIA, colorimetric assays, CLIA, LC-MS), and end-user (hospitals, diagnostic laboratories, and others). North America currently holds a significant market share due to advanced healthcare infrastructure and high adoption rates of new technologies, but the Asia-Pacific region is expected to witness substantial growth in the coming years, driven by increasing healthcare expenditure and rising prevalence of CKD in developing nations.
The competitive landscape is characterized by the presence of both large multinational corporations like BioMérieux, Thermo Fisher Scientific, and Roche, and smaller specialized companies. These players are engaged in ongoing research and development to introduce innovative renal biomarkers and diagnostic assays. Strategic partnerships, mergers and acquisitions, and the development of novel diagnostic platforms are key strategies employed by market participants to maintain a competitive edge. However, challenges such as the high cost of advanced diagnostic techniques and the need for skilled professionals to operate and interpret results may hinder market growth to some extent. Nevertheless, the overall market outlook remains positive, driven by technological advancements, rising disease prevalence, and a growing focus on early diagnosis and personalized medicine in renal care.
Renal Biomarkers Market: Comprehensive Report 2019-2033
This in-depth report provides a comprehensive analysis of the Renal Biomarkers Market, covering the period 2019-2033. It offers actionable insights into market dynamics, competitive landscape, and future growth prospects, incorporating key trends and developments impacting this rapidly evolving sector. The report segments the market by biomarker type, diagnostic technique, and end-user, providing granular data and forecasts for informed decision-making. The study period is 2019-2033, with 2025 as the base and estimated year. The forecast period is 2025-2033, and the historical period is 2019-2024. The market size is expected to reach xx Million by 2033.
Renal Biomarkers Market Structure & Competitive Dynamics
The Renal Biomarkers Market exhibits a moderately concentrated structure, with key players like BioMérieux, Enzo Life Sciences Inc, Randox Laboratories Ltd, BioPorto Diagnostics AS, Thermo Fisher Scientific Inc, Abbott Laboratories, Siemens Healthineers AG, F Hoffmann-La Roche AG, SEKISUI MEDICAL CO LTD, and Sphingotec GmbH holding significant market shares. The market is characterized by ongoing innovation, driven by advancements in diagnostic techniques and the discovery of novel biomarkers. Regulatory frameworks, particularly those concerning diagnostic approvals and reimbursement policies, play a crucial role in shaping market dynamics. Existing diagnostic tests face competition from newer, more sensitive and specific assays. End-user preferences are shifting towards faster, more accurate, and cost-effective testing solutions. M&A activity within the sector is relatively frequent, with deal values averaging xx Million per transaction in the last five years, contributing to market consolidation and expansion of product portfolios. For instance, larger players often acquire smaller companies with innovative technologies or established distribution networks, bolstering their market presence. The market is also influenced by the increasing prevalence of chronic kidney disease (CKD) globally, driving demand for accurate and timely diagnosis.
- Market Concentration: Moderately concentrated, with top 10 players holding approximately xx% market share.
- Innovation Ecosystems: Strong emphasis on R&D, with continuous development of novel biomarkers and diagnostic techniques.
- Regulatory Frameworks: Stringent regulatory pathways impact market entry and product approvals.
- Product Substitutes: Competition arises from alternative diagnostic methods and technologies.
- End-User Trends: Growing preference for point-of-care testing and personalized medicine.
- M&A Activity: Frequent mergers and acquisitions, driving market consolidation.
Renal Biomarkers Market Industry Trends & Insights
The Renal Biomarkers Market is experiencing significant growth, propelled by factors such as the rising prevalence of chronic kidney disease (CKD), advancements in diagnostic technologies, and increasing healthcare expenditure globally. The market is projected to witness a Compound Annual Growth Rate (CAGR) of xx% during the forecast period (2025-2033). Technological advancements, particularly in areas like liquid chromatography-mass spectrometry (LC-MS) and AI-driven diagnostics, are transforming the landscape. Consumer preferences are trending towards more convenient, rapid, and precise diagnostic tests. Furthermore, an increased focus on early disease detection and personalized medicine drives growth. The market is also witnessing increased competition among players, leading to pricing pressures and a focus on innovation to gain a competitive advantage. Market penetration of advanced diagnostic techniques, like LC-MS, remains relatively low, presenting substantial growth potential.
Dominant Markets & Segments in Renal Biomarkers Market
Leading Region/Country: North America currently holds the largest market share, driven by high healthcare expenditure and technological advancements. However, Asia-Pacific is projected to experience significant growth in the coming years due to rising prevalence of CKD and increasing healthcare infrastructure.
Dominant Biomarker Types:
- Functional Biomarker: This segment is experiencing rapid growth due to the increasing understanding of their role in kidney function assessment.
- Urine Albumin (Up-regulated Protein): This biomarker remains a cornerstone of CKD diagnosis, fueling consistent market demand.
- INTERLEUKIN- and Other Biomarker Types: This segment demonstrates promising growth potential as research expands understanding and clinical applications of novel biomarkers.
Dominant Diagnostic Techniques:
- Enzyme-linked Immunosorbent Assay (ELISA): Widely used due to its simplicity and cost-effectiveness.
- Particle-enhanced Turbidimetric Immunoassay (PETIA): Offers improved sensitivity and automation capabilities.
- Chemiluminescent Enzyme Immunoassay (CLIA): Provides high sensitivity and dynamic range, driving its adoption in advanced diagnostic settings.
- Liquid Chromatography Mass Spectrometry (LC-MS): Emerges as a key driver of future growth, offering high-throughput and comprehensive biomarker profiling.
- Colorimetric Assay: A cost-effective and easy-to-use technique, particularly relevant in resource-constrained settings.
Dominant End-Users:
- Hospitals: The largest end-user segment due to high patient volume and advanced diagnostic capabilities.
- Diagnostic Laboratories: Plays a crucial role in providing renal biomarker testing services.
- Other End Users: This segment includes research institutions, pharmaceutical companies, and other specialized healthcare providers.
Key Drivers:
- Technological advancements in diagnostic techniques, driving higher sensitivity, specificity, and automation.
- Increasing prevalence of chronic kidney disease (CKD) globally fueling demand for early diagnosis.
- Government initiatives and funding supporting research and development in renal biomarker diagnostics.
- Growing focus on personalized medicine in kidney disease management.
- Improved reimbursement policies for advanced diagnostic techniques.
Renal Biomarkers Market Product Innovations
Recent innovations focus on developing highly sensitive and specific assays for early detection of CKD. The integration of AI and machine learning into diagnostic platforms is accelerating the development of predictive models for disease progression and treatment response. Miniaturization and point-of-care testing technologies aim to improve accessibility and convenience. These innovations offer improved diagnostic accuracy, faster turnaround times, and reduced healthcare costs, driving market growth and shaping competitive advantages.
Report Segmentation & Scope
This report meticulously segments the renal biomarkers market across various parameters:
Biomarker Type: Functional Biomarkers, Urine Albumin, INTERLEUKIN-, and Other Biomarker Types. Each segment's growth trajectory is analyzed, considering factors like sensitivity, specificity, and clinical utility.
Diagnostic Technique: ELISA, PETIA, Colorimetric Assay, CLIA, and LC-MS. Market size, growth projections, and competitive intensity within each segment are detailed.
End User: Hospitals, Diagnostic Laboratories, and Other End Users. Analysis considers the specific needs and preferences of each segment.
Growth projections for each segment are provided, along with an assessment of market size and competitive dynamics.
Key Drivers of Renal Biomarkers Market Growth
The increasing prevalence of chronic kidney disease (CKD) globally is a primary driver. Technological advancements, particularly in mass spectrometry and immunoassay techniques, enable more sensitive and specific biomarker detection. Government initiatives promoting early disease detection and improved healthcare infrastructure contribute significantly. Growing investments in R&D by both public and private sectors further propel market growth.
Challenges in the Renal Biomarkers Market Sector
Regulatory hurdles in obtaining approvals for new diagnostic tests pose a challenge. High development and manufacturing costs can limit market access. The need for skilled personnel to operate sophisticated diagnostic equipment may restrict market penetration in some regions. Competitive pressures from established players and the emergence of new entrants also present obstacles.
Leading Players in the Renal Biomarkers Market Market
- BioMérieux
- Enzo Life Sciences Inc
- Randox Laboratories Ltd
- BioPorto Diagnostics AS
- Thermo Fisher Scientific Inc
- Abbott Laboratories
- Siemens Healthineers AG
- F Hoffmann-La Roche AG
- SEKISUI MEDICAL CO LTD
- Sphingotec GmbH
Key Developments in Renal Biomarkers Market Sector
- January 2024: LifeLabs partnered with Klinrisk to improve early CKD detection using AI-based analysis of blood and urine samples.
- January 2023: Renalytix PLC launched PRIME-CKD, a novel biomarker-based test for predicting drug response in CKD patients.
Strategic Renal Biomarkers Market Market Outlook
The Renal Biomarkers Market holds significant growth potential, driven by the increasing prevalence of CKD and continuous technological advancements. Strategic opportunities lie in developing point-of-care diagnostics, integrating AI and machine learning for improved diagnostics and personalized medicine, and expanding into emerging markets. Focusing on cost-effective solutions and partnerships will be crucial for market success.
Renal Biomarkers Market Segmentation
-
1. Biomarker Type
-
1.1. Functional Biomarker
- 1.1.1. Serum Creatinine
- 1.1.2. Serum Cystatin C
- 1.1.3. Urine Albumin
-
1.2. Up-regulated Protein
- 1.2.1. Neutrophil Gelatinase-Associated Lipocalin (NGAL)
- 1.2.2. Kidney Injury Molecule-1
- 1.2.3. INTERLEUKIN-18
- 1.3. Other Biomarker Types
-
1.1. Functional Biomarker
-
2. Diagnostic Technique
- 2.1. Enzyme-linked Immunosorbent Assay
- 2.2. Particle
- 2.3. Colorimetric Assay
- 2.4. Chemiluminescent Enzyme Immunoassay (CLIA)
- 2.5. Liquid Chromatography Mass Spectrometry (LS-MS)
-
3. End User
- 3.1. Hospitals
- 3.2. Diagnostic Laboratories
- 3.3. Other End Users
Renal Biomarkers Market Segmentation By Geography
-
1. North America
- 1.1. United States
- 1.2. Canada
- 1.3. Mexico
-
2. Europe
- 2.1. Germany
- 2.2. United Kingdom
- 2.3. France
- 2.4. Italy
- 2.5. Spain
- 2.6. Rest of Europe
-
3. Asia Pacific
- 3.1. China
- 3.2. Japan
- 3.3. India
- 3.4. Australia
- 3.5. South Korea
- 3.6. Rest of Asia Pacific
-
4. Middle East and Africa
- 4.1. GCC
- 4.2. South Africa
- 4.3. Rest of Middle East and Africa
-
5. South America
- 5.1. Brazil
- 5.2. Argentina
- 5.3. Rest of South America
Renal Biomarkers Market REPORT HIGHLIGHTS
| Aspects | Details |
|---|---|
| Study Period | 2019-2033 |
| Base Year | 2024 |
| Estimated Year | 2025 |
| Forecast Period | 2025-2033 |
| Historical Period | 2019-2024 |
| Growth Rate | CAGR of 7.53% from 2019-2033 |
| Segmentation |
|
Table of Contents
- 1. Introduction
- 1.1. Research Scope
- 1.2. Market Segmentation
- 1.3. Research Methodology
- 1.4. Definitions and Assumptions
- 2. Executive Summary
- 2.1. Introduction
- 3. Market Dynamics
- 3.1. Introduction
- 3.2. Market Drivers
- 3.2.1 Rising Prevalence of Various Kidney-related Diseases; High Prevalence of Diabetes and High Blood Pressure
- 3.2.2 the Leading Cause of Renal Diseases; Rapid Technological Advances in the Field of Genetics
- 3.3. Market Restrains
- 3.3.1. Issues Related to Regulatory and Reimbursement Systems
- 3.4. Market Trends
- 3.4.1. Neutrophil Gelatinase-Associated Lipocalin (NGAL) is Expected to Project Significant Growth Over the Forecast Period
- 4. Market Factor Analysis
- 4.1. Porters Five Forces
- 4.2. Supply/Value Chain
- 4.3. PESTEL analysis
- 4.4. Market Entropy
- 4.5. Patent/Trademark Analysis
- 5. Global Renal Biomarkers Market Analysis, Insights and Forecast, 2019-2031
- 5.1. Market Analysis, Insights and Forecast - by Biomarker Type
- 5.1.1. Functional Biomarker
- 5.1.1.1. Serum Creatinine
- 5.1.1.2. Serum Cystatin C
- 5.1.1.3. Urine Albumin
- 5.1.2. Up-regulated Protein
- 5.1.2.1. Neutrophil Gelatinase-Associated Lipocalin (NGAL)
- 5.1.2.2. Kidney Injury Molecule-1
- 5.1.2.3. INTERLEUKIN-18
- 5.1.3. Other Biomarker Types
- 5.1.1. Functional Biomarker
- 5.2. Market Analysis, Insights and Forecast - by Diagnostic Technique
- 5.2.1. Enzyme-linked Immunosorbent Assay
- 5.2.2. Particle
- 5.2.3. Colorimetric Assay
- 5.2.4. Chemiluminescent Enzyme Immunoassay (CLIA)
- 5.2.5. Liquid Chromatography Mass Spectrometry (LS-MS)
- 5.3. Market Analysis, Insights and Forecast - by End User
- 5.3.1. Hospitals
- 5.3.2. Diagnostic Laboratories
- 5.3.3. Other End Users
- 5.4. Market Analysis, Insights and Forecast - by Region
- 5.4.1. North America
- 5.4.2. Europe
- 5.4.3. Asia Pacific
- 5.4.4. Middle East and Africa
- 5.4.5. South America
- 5.1. Market Analysis, Insights and Forecast - by Biomarker Type
- 6. North America Renal Biomarkers Market Analysis, Insights and Forecast, 2019-2031
- 6.1. Market Analysis, Insights and Forecast - by Biomarker Type
- 6.1.1. Functional Biomarker
- 6.1.1.1. Serum Creatinine
- 6.1.1.2. Serum Cystatin C
- 6.1.1.3. Urine Albumin
- 6.1.2. Up-regulated Protein
- 6.1.2.1. Neutrophil Gelatinase-Associated Lipocalin (NGAL)
- 6.1.2.2. Kidney Injury Molecule-1
- 6.1.2.3. INTERLEUKIN-18
- 6.1.3. Other Biomarker Types
- 6.1.1. Functional Biomarker
- 6.2. Market Analysis, Insights and Forecast - by Diagnostic Technique
- 6.2.1. Enzyme-linked Immunosorbent Assay
- 6.2.2. Particle
- 6.2.3. Colorimetric Assay
- 6.2.4. Chemiluminescent Enzyme Immunoassay (CLIA)
- 6.2.5. Liquid Chromatography Mass Spectrometry (LS-MS)
- 6.3. Market Analysis, Insights and Forecast - by End User
- 6.3.1. Hospitals
- 6.3.2. Diagnostic Laboratories
- 6.3.3. Other End Users
- 6.1. Market Analysis, Insights and Forecast - by Biomarker Type
- 7. Europe Renal Biomarkers Market Analysis, Insights and Forecast, 2019-2031
- 7.1. Market Analysis, Insights and Forecast - by Biomarker Type
- 7.1.1. Functional Biomarker
- 7.1.1.1. Serum Creatinine
- 7.1.1.2. Serum Cystatin C
- 7.1.1.3. Urine Albumin
- 7.1.2. Up-regulated Protein
- 7.1.2.1. Neutrophil Gelatinase-Associated Lipocalin (NGAL)
- 7.1.2.2. Kidney Injury Molecule-1
- 7.1.2.3. INTERLEUKIN-18
- 7.1.3. Other Biomarker Types
- 7.1.1. Functional Biomarker
- 7.2. Market Analysis, Insights and Forecast - by Diagnostic Technique
- 7.2.1. Enzyme-linked Immunosorbent Assay
- 7.2.2. Particle
- 7.2.3. Colorimetric Assay
- 7.2.4. Chemiluminescent Enzyme Immunoassay (CLIA)
- 7.2.5. Liquid Chromatography Mass Spectrometry (LS-MS)
- 7.3. Market Analysis, Insights and Forecast - by End User
- 7.3.1. Hospitals
- 7.3.2. Diagnostic Laboratories
- 7.3.3. Other End Users
- 7.1. Market Analysis, Insights and Forecast - by Biomarker Type
- 8. Asia Pacific Renal Biomarkers Market Analysis, Insights and Forecast, 2019-2031
- 8.1. Market Analysis, Insights and Forecast - by Biomarker Type
- 8.1.1. Functional Biomarker
- 8.1.1.1. Serum Creatinine
- 8.1.1.2. Serum Cystatin C
- 8.1.1.3. Urine Albumin
- 8.1.2. Up-regulated Protein
- 8.1.2.1. Neutrophil Gelatinase-Associated Lipocalin (NGAL)
- 8.1.2.2. Kidney Injury Molecule-1
- 8.1.2.3. INTERLEUKIN-18
- 8.1.3. Other Biomarker Types
- 8.1.1. Functional Biomarker
- 8.2. Market Analysis, Insights and Forecast - by Diagnostic Technique
- 8.2.1. Enzyme-linked Immunosorbent Assay
- 8.2.2. Particle
- 8.2.3. Colorimetric Assay
- 8.2.4. Chemiluminescent Enzyme Immunoassay (CLIA)
- 8.2.5. Liquid Chromatography Mass Spectrometry (LS-MS)
- 8.3. Market Analysis, Insights and Forecast - by End User
- 8.3.1. Hospitals
- 8.3.2. Diagnostic Laboratories
- 8.3.3. Other End Users
- 8.1. Market Analysis, Insights and Forecast - by Biomarker Type
- 9. Middle East and Africa Renal Biomarkers Market Analysis, Insights and Forecast, 2019-2031
- 9.1. Market Analysis, Insights and Forecast - by Biomarker Type
- 9.1.1. Functional Biomarker
- 9.1.1.1. Serum Creatinine
- 9.1.1.2. Serum Cystatin C
- 9.1.1.3. Urine Albumin
- 9.1.2. Up-regulated Protein
- 9.1.2.1. Neutrophil Gelatinase-Associated Lipocalin (NGAL)
- 9.1.2.2. Kidney Injury Molecule-1
- 9.1.2.3. INTERLEUKIN-18
- 9.1.3. Other Biomarker Types
- 9.1.1. Functional Biomarker
- 9.2. Market Analysis, Insights and Forecast - by Diagnostic Technique
- 9.2.1. Enzyme-linked Immunosorbent Assay
- 9.2.2. Particle
- 9.2.3. Colorimetric Assay
- 9.2.4. Chemiluminescent Enzyme Immunoassay (CLIA)
- 9.2.5. Liquid Chromatography Mass Spectrometry (LS-MS)
- 9.3. Market Analysis, Insights and Forecast - by End User
- 9.3.1. Hospitals
- 9.3.2. Diagnostic Laboratories
- 9.3.3. Other End Users
- 9.1. Market Analysis, Insights and Forecast - by Biomarker Type
- 10. South America Renal Biomarkers Market Analysis, Insights and Forecast, 2019-2031
- 10.1. Market Analysis, Insights and Forecast - by Biomarker Type
- 10.1.1. Functional Biomarker
- 10.1.1.1. Serum Creatinine
- 10.1.1.2. Serum Cystatin C
- 10.1.1.3. Urine Albumin
- 10.1.2. Up-regulated Protein
- 10.1.2.1. Neutrophil Gelatinase-Associated Lipocalin (NGAL)
- 10.1.2.2. Kidney Injury Molecule-1
- 10.1.2.3. INTERLEUKIN-18
- 10.1.3. Other Biomarker Types
- 10.1.1. Functional Biomarker
- 10.2. Market Analysis, Insights and Forecast - by Diagnostic Technique
- 10.2.1. Enzyme-linked Immunosorbent Assay
- 10.2.2. Particle
- 10.2.3. Colorimetric Assay
- 10.2.4. Chemiluminescent Enzyme Immunoassay (CLIA)
- 10.2.5. Liquid Chromatography Mass Spectrometry (LS-MS)
- 10.3. Market Analysis, Insights and Forecast - by End User
- 10.3.1. Hospitals
- 10.3.2. Diagnostic Laboratories
- 10.3.3. Other End Users
- 10.1. Market Analysis, Insights and Forecast - by Biomarker Type
- 11. North America Renal Biomarkers Market Analysis, Insights and Forecast, 2019-2031
- 11.1. Market Analysis, Insights and Forecast - By Country/Sub-region
- 11.1.1 United States
- 11.1.2 Canada
- 11.1.3 Mexico
- 12. Europe Renal Biomarkers Market Analysis, Insights and Forecast, 2019-2031
- 12.1. Market Analysis, Insights and Forecast - By Country/Sub-region
- 12.1.1 Germany
- 12.1.2 United Kingdom
- 12.1.3 France
- 12.1.4 Italy
- 12.1.5 Spain
- 12.1.6 Rest of Europe
- 13. Asia Pacific Renal Biomarkers Market Analysis, Insights and Forecast, 2019-2031
- 13.1. Market Analysis, Insights and Forecast - By Country/Sub-region
- 13.1.1 China
- 13.1.2 Japan
- 13.1.3 India
- 13.1.4 Australia
- 13.1.5 South Korea
- 13.1.6 Rest of Asia Pacific
- 14. Middle East and Africa Renal Biomarkers Market Analysis, Insights and Forecast, 2019-2031
- 14.1. Market Analysis, Insights and Forecast - By Country/Sub-region
- 14.1.1 GCC
- 14.1.2 South Africa
- 14.1.3 Rest of Middle East and Africa
- 15. South America Renal Biomarkers Market Analysis, Insights and Forecast, 2019-2031
- 15.1. Market Analysis, Insights and Forecast - By Country/Sub-region
- 15.1.1 Brazil
- 15.1.2 Argentina
- 15.1.3 Rest of South America
- 16. Competitive Analysis
- 16.1. Global Market Share Analysis 2024
- 16.2. Company Profiles
- 16.2.1 BioMérieux
- 16.2.1.1. Overview
- 16.2.1.2. Products
- 16.2.1.3. SWOT Analysis
- 16.2.1.4. Recent Developments
- 16.2.1.5. Financials (Based on Availability)
- 16.2.2 Enzo Life Sciences Inc
- 16.2.2.1. Overview
- 16.2.2.2. Products
- 16.2.2.3. SWOT Analysis
- 16.2.2.4. Recent Developments
- 16.2.2.5. Financials (Based on Availability)
- 16.2.3 Randox Laboratories Ltd
- 16.2.3.1. Overview
- 16.2.3.2. Products
- 16.2.3.3. SWOT Analysis
- 16.2.3.4. Recent Developments
- 16.2.3.5. Financials (Based on Availability)
- 16.2.4 BioPorto Diagnostics AS
- 16.2.4.1. Overview
- 16.2.4.2. Products
- 16.2.4.3. SWOT Analysis
- 16.2.4.4. Recent Developments
- 16.2.4.5. Financials (Based on Availability)
- 16.2.5 Thermo Fisher Scientific Inc
- 16.2.5.1. Overview
- 16.2.5.2. Products
- 16.2.5.3. SWOT Analysis
- 16.2.5.4. Recent Developments
- 16.2.5.5. Financials (Based on Availability)
- 16.2.6 Abbott Laboratories
- 16.2.6.1. Overview
- 16.2.6.2. Products
- 16.2.6.3. SWOT Analysis
- 16.2.6.4. Recent Developments
- 16.2.6.5. Financials (Based on Availability)
- 16.2.7 Siemens Healthineers AG
- 16.2.7.1. Overview
- 16.2.7.2. Products
- 16.2.7.3. SWOT Analysis
- 16.2.7.4. Recent Developments
- 16.2.7.5. Financials (Based on Availability)
- 16.2.8 F Hoffmann-La Roche AG
- 16.2.8.1. Overview
- 16.2.8.2. Products
- 16.2.8.3. SWOT Analysis
- 16.2.8.4. Recent Developments
- 16.2.8.5. Financials (Based on Availability)
- 16.2.9 SEKISUI MEDICAL CO LTD
- 16.2.9.1. Overview
- 16.2.9.2. Products
- 16.2.9.3. SWOT Analysis
- 16.2.9.4. Recent Developments
- 16.2.9.5. Financials (Based on Availability)
- 16.2.10 Sphingotec GmbH
- 16.2.10.1. Overview
- 16.2.10.2. Products
- 16.2.10.3. SWOT Analysis
- 16.2.10.4. Recent Developments
- 16.2.10.5. Financials (Based on Availability)
- 16.2.1 BioMérieux
List of Figures
- Figure 1: Global Renal Biomarkers Market Revenue Breakdown (Million, %) by Region 2024 & 2032
- Figure 2: Global Renal Biomarkers Market Volume Breakdown (K Unit, %) by Region 2024 & 2032
- Figure 3: North America Renal Biomarkers Market Revenue (Million), by Country 2024 & 2032
- Figure 4: North America Renal Biomarkers Market Volume (K Unit), by Country 2024 & 2032
- Figure 5: North America Renal Biomarkers Market Revenue Share (%), by Country 2024 & 2032
- Figure 6: North America Renal Biomarkers Market Volume Share (%), by Country 2024 & 2032
- Figure 7: Europe Renal Biomarkers Market Revenue (Million), by Country 2024 & 2032
- Figure 8: Europe Renal Biomarkers Market Volume (K Unit), by Country 2024 & 2032
- Figure 9: Europe Renal Biomarkers Market Revenue Share (%), by Country 2024 & 2032
- Figure 10: Europe Renal Biomarkers Market Volume Share (%), by Country 2024 & 2032
- Figure 11: Asia Pacific Renal Biomarkers Market Revenue (Million), by Country 2024 & 2032
- Figure 12: Asia Pacific Renal Biomarkers Market Volume (K Unit), by Country 2024 & 2032
- Figure 13: Asia Pacific Renal Biomarkers Market Revenue Share (%), by Country 2024 & 2032
- Figure 14: Asia Pacific Renal Biomarkers Market Volume Share (%), by Country 2024 & 2032
- Figure 15: Middle East and Africa Renal Biomarkers Market Revenue (Million), by Country 2024 & 2032
- Figure 16: Middle East and Africa Renal Biomarkers Market Volume (K Unit), by Country 2024 & 2032
- Figure 17: Middle East and Africa Renal Biomarkers Market Revenue Share (%), by Country 2024 & 2032
- Figure 18: Middle East and Africa Renal Biomarkers Market Volume Share (%), by Country 2024 & 2032
- Figure 19: South America Renal Biomarkers Market Revenue (Million), by Country 2024 & 2032
- Figure 20: South America Renal Biomarkers Market Volume (K Unit), by Country 2024 & 2032
- Figure 21: South America Renal Biomarkers Market Revenue Share (%), by Country 2024 & 2032
- Figure 22: South America Renal Biomarkers Market Volume Share (%), by Country 2024 & 2032
- Figure 23: North America Renal Biomarkers Market Revenue (Million), by Biomarker Type 2024 & 2032
- Figure 24: North America Renal Biomarkers Market Volume (K Unit), by Biomarker Type 2024 & 2032
- Figure 25: North America Renal Biomarkers Market Revenue Share (%), by Biomarker Type 2024 & 2032
- Figure 26: North America Renal Biomarkers Market Volume Share (%), by Biomarker Type 2024 & 2032
- Figure 27: North America Renal Biomarkers Market Revenue (Million), by Diagnostic Technique 2024 & 2032
- Figure 28: North America Renal Biomarkers Market Volume (K Unit), by Diagnostic Technique 2024 & 2032
- Figure 29: North America Renal Biomarkers Market Revenue Share (%), by Diagnostic Technique 2024 & 2032
- Figure 30: North America Renal Biomarkers Market Volume Share (%), by Diagnostic Technique 2024 & 2032
- Figure 31: North America Renal Biomarkers Market Revenue (Million), by End User 2024 & 2032
- Figure 32: North America Renal Biomarkers Market Volume (K Unit), by End User 2024 & 2032
- Figure 33: North America Renal Biomarkers Market Revenue Share (%), by End User 2024 & 2032
- Figure 34: North America Renal Biomarkers Market Volume Share (%), by End User 2024 & 2032
- Figure 35: North America Renal Biomarkers Market Revenue (Million), by Country 2024 & 2032
- Figure 36: North America Renal Biomarkers Market Volume (K Unit), by Country 2024 & 2032
- Figure 37: North America Renal Biomarkers Market Revenue Share (%), by Country 2024 & 2032
- Figure 38: North America Renal Biomarkers Market Volume Share (%), by Country 2024 & 2032
- Figure 39: Europe Renal Biomarkers Market Revenue (Million), by Biomarker Type 2024 & 2032
- Figure 40: Europe Renal Biomarkers Market Volume (K Unit), by Biomarker Type 2024 & 2032
- Figure 41: Europe Renal Biomarkers Market Revenue Share (%), by Biomarker Type 2024 & 2032
- Figure 42: Europe Renal Biomarkers Market Volume Share (%), by Biomarker Type 2024 & 2032
- Figure 43: Europe Renal Biomarkers Market Revenue (Million), by Diagnostic Technique 2024 & 2032
- Figure 44: Europe Renal Biomarkers Market Volume (K Unit), by Diagnostic Technique 2024 & 2032
- Figure 45: Europe Renal Biomarkers Market Revenue Share (%), by Diagnostic Technique 2024 & 2032
- Figure 46: Europe Renal Biomarkers Market Volume Share (%), by Diagnostic Technique 2024 & 2032
- Figure 47: Europe Renal Biomarkers Market Revenue (Million), by End User 2024 & 2032
- Figure 48: Europe Renal Biomarkers Market Volume (K Unit), by End User 2024 & 2032
- Figure 49: Europe Renal Biomarkers Market Revenue Share (%), by End User 2024 & 2032
- Figure 50: Europe Renal Biomarkers Market Volume Share (%), by End User 2024 & 2032
- Figure 51: Europe Renal Biomarkers Market Revenue (Million), by Country 2024 & 2032
- Figure 52: Europe Renal Biomarkers Market Volume (K Unit), by Country 2024 & 2032
- Figure 53: Europe Renal Biomarkers Market Revenue Share (%), by Country 2024 & 2032
- Figure 54: Europe Renal Biomarkers Market Volume Share (%), by Country 2024 & 2032
- Figure 55: Asia Pacific Renal Biomarkers Market Revenue (Million), by Biomarker Type 2024 & 2032
- Figure 56: Asia Pacific Renal Biomarkers Market Volume (K Unit), by Biomarker Type 2024 & 2032
- Figure 57: Asia Pacific Renal Biomarkers Market Revenue Share (%), by Biomarker Type 2024 & 2032
- Figure 58: Asia Pacific Renal Biomarkers Market Volume Share (%), by Biomarker Type 2024 & 2032
- Figure 59: Asia Pacific Renal Biomarkers Market Revenue (Million), by Diagnostic Technique 2024 & 2032
- Figure 60: Asia Pacific Renal Biomarkers Market Volume (K Unit), by Diagnostic Technique 2024 & 2032
- Figure 61: Asia Pacific Renal Biomarkers Market Revenue Share (%), by Diagnostic Technique 2024 & 2032
- Figure 62: Asia Pacific Renal Biomarkers Market Volume Share (%), by Diagnostic Technique 2024 & 2032
- Figure 63: Asia Pacific Renal Biomarkers Market Revenue (Million), by End User 2024 & 2032
- Figure 64: Asia Pacific Renal Biomarkers Market Volume (K Unit), by End User 2024 & 2032
- Figure 65: Asia Pacific Renal Biomarkers Market Revenue Share (%), by End User 2024 & 2032
- Figure 66: Asia Pacific Renal Biomarkers Market Volume Share (%), by End User 2024 & 2032
- Figure 67: Asia Pacific Renal Biomarkers Market Revenue (Million), by Country 2024 & 2032
- Figure 68: Asia Pacific Renal Biomarkers Market Volume (K Unit), by Country 2024 & 2032
- Figure 69: Asia Pacific Renal Biomarkers Market Revenue Share (%), by Country 2024 & 2032
- Figure 70: Asia Pacific Renal Biomarkers Market Volume Share (%), by Country 2024 & 2032
- Figure 71: Middle East and Africa Renal Biomarkers Market Revenue (Million), by Biomarker Type 2024 & 2032
- Figure 72: Middle East and Africa Renal Biomarkers Market Volume (K Unit), by Biomarker Type 2024 & 2032
- Figure 73: Middle East and Africa Renal Biomarkers Market Revenue Share (%), by Biomarker Type 2024 & 2032
- Figure 74: Middle East and Africa Renal Biomarkers Market Volume Share (%), by Biomarker Type 2024 & 2032
- Figure 75: Middle East and Africa Renal Biomarkers Market Revenue (Million), by Diagnostic Technique 2024 & 2032
- Figure 76: Middle East and Africa Renal Biomarkers Market Volume (K Unit), by Diagnostic Technique 2024 & 2032
- Figure 77: Middle East and Africa Renal Biomarkers Market Revenue Share (%), by Diagnostic Technique 2024 & 2032
- Figure 78: Middle East and Africa Renal Biomarkers Market Volume Share (%), by Diagnostic Technique 2024 & 2032
- Figure 79: Middle East and Africa Renal Biomarkers Market Revenue (Million), by End User 2024 & 2032
- Figure 80: Middle East and Africa Renal Biomarkers Market Volume (K Unit), by End User 2024 & 2032
- Figure 81: Middle East and Africa Renal Biomarkers Market Revenue Share (%), by End User 2024 & 2032
- Figure 82: Middle East and Africa Renal Biomarkers Market Volume Share (%), by End User 2024 & 2032
- Figure 83: Middle East and Africa Renal Biomarkers Market Revenue (Million), by Country 2024 & 2032
- Figure 84: Middle East and Africa Renal Biomarkers Market Volume (K Unit), by Country 2024 & 2032
- Figure 85: Middle East and Africa Renal Biomarkers Market Revenue Share (%), by Country 2024 & 2032
- Figure 86: Middle East and Africa Renal Biomarkers Market Volume Share (%), by Country 2024 & 2032
- Figure 87: South America Renal Biomarkers Market Revenue (Million), by Biomarker Type 2024 & 2032
- Figure 88: South America Renal Biomarkers Market Volume (K Unit), by Biomarker Type 2024 & 2032
- Figure 89: South America Renal Biomarkers Market Revenue Share (%), by Biomarker Type 2024 & 2032
- Figure 90: South America Renal Biomarkers Market Volume Share (%), by Biomarker Type 2024 & 2032
- Figure 91: South America Renal Biomarkers Market Revenue (Million), by Diagnostic Technique 2024 & 2032
- Figure 92: South America Renal Biomarkers Market Volume (K Unit), by Diagnostic Technique 2024 & 2032
- Figure 93: South America Renal Biomarkers Market Revenue Share (%), by Diagnostic Technique 2024 & 2032
- Figure 94: South America Renal Biomarkers Market Volume Share (%), by Diagnostic Technique 2024 & 2032
- Figure 95: South America Renal Biomarkers Market Revenue (Million), by End User 2024 & 2032
- Figure 96: South America Renal Biomarkers Market Volume (K Unit), by End User 2024 & 2032
- Figure 97: South America Renal Biomarkers Market Revenue Share (%), by End User 2024 & 2032
- Figure 98: South America Renal Biomarkers Market Volume Share (%), by End User 2024 & 2032
- Figure 99: South America Renal Biomarkers Market Revenue (Million), by Country 2024 & 2032
- Figure 100: South America Renal Biomarkers Market Volume (K Unit), by Country 2024 & 2032
- Figure 101: South America Renal Biomarkers Market Revenue Share (%), by Country 2024 & 2032
- Figure 102: South America Renal Biomarkers Market Volume Share (%), by Country 2024 & 2032
List of Tables
- Table 1: Global Renal Biomarkers Market Revenue Million Forecast, by Region 2019 & 2032
- Table 2: Global Renal Biomarkers Market Volume K Unit Forecast, by Region 2019 & 2032
- Table 3: Global Renal Biomarkers Market Revenue Million Forecast, by Biomarker Type 2019 & 2032
- Table 4: Global Renal Biomarkers Market Volume K Unit Forecast, by Biomarker Type 2019 & 2032
- Table 5: Global Renal Biomarkers Market Revenue Million Forecast, by Diagnostic Technique 2019 & 2032
- Table 6: Global Renal Biomarkers Market Volume K Unit Forecast, by Diagnostic Technique 2019 & 2032
- Table 7: Global Renal Biomarkers Market Revenue Million Forecast, by End User 2019 & 2032
- Table 8: Global Renal Biomarkers Market Volume K Unit Forecast, by End User 2019 & 2032
- Table 9: Global Renal Biomarkers Market Revenue Million Forecast, by Region 2019 & 2032
- Table 10: Global Renal Biomarkers Market Volume K Unit Forecast, by Region 2019 & 2032
- Table 11: Global Renal Biomarkers Market Revenue Million Forecast, by Country 2019 & 2032
- Table 12: Global Renal Biomarkers Market Volume K Unit Forecast, by Country 2019 & 2032
- Table 13: United States Renal Biomarkers Market Revenue (Million) Forecast, by Application 2019 & 2032
- Table 14: United States Renal Biomarkers Market Volume (K Unit) Forecast, by Application 2019 & 2032
- Table 15: Canada Renal Biomarkers Market Revenue (Million) Forecast, by Application 2019 & 2032
- Table 16: Canada Renal Biomarkers Market Volume (K Unit) Forecast, by Application 2019 & 2032
- Table 17: Mexico Renal Biomarkers Market Revenue (Million) Forecast, by Application 2019 & 2032
- Table 18: Mexico Renal Biomarkers Market Volume (K Unit) Forecast, by Application 2019 & 2032
- Table 19: Global Renal Biomarkers Market Revenue Million Forecast, by Country 2019 & 2032
- Table 20: Global Renal Biomarkers Market Volume K Unit Forecast, by Country 2019 & 2032
- Table 21: Germany Renal Biomarkers Market Revenue (Million) Forecast, by Application 2019 & 2032
- Table 22: Germany Renal Biomarkers Market Volume (K Unit) Forecast, by Application 2019 & 2032
- Table 23: United Kingdom Renal Biomarkers Market Revenue (Million) Forecast, by Application 2019 & 2032
- Table 24: United Kingdom Renal Biomarkers Market Volume (K Unit) Forecast, by Application 2019 & 2032
- Table 25: France Renal Biomarkers Market Revenue (Million) Forecast, by Application 2019 & 2032
- Table 26: France Renal Biomarkers Market Volume (K Unit) Forecast, by Application 2019 & 2032
- Table 27: Italy Renal Biomarkers Market Revenue (Million) Forecast, by Application 2019 & 2032
- Table 28: Italy Renal Biomarkers Market Volume (K Unit) Forecast, by Application 2019 & 2032
- Table 29: Spain Renal Biomarkers Market Revenue (Million) Forecast, by Application 2019 & 2032
- Table 30: Spain Renal Biomarkers Market Volume (K Unit) Forecast, by Application 2019 & 2032
- Table 31: Rest of Europe Renal Biomarkers Market Revenue (Million) Forecast, by Application 2019 & 2032
- Table 32: Rest of Europe Renal Biomarkers Market Volume (K Unit) Forecast, by Application 2019 & 2032
- Table 33: Global Renal Biomarkers Market Revenue Million Forecast, by Country 2019 & 2032
- Table 34: Global Renal Biomarkers Market Volume K Unit Forecast, by Country 2019 & 2032
- Table 35: China Renal Biomarkers Market Revenue (Million) Forecast, by Application 2019 & 2032
- Table 36: China Renal Biomarkers Market Volume (K Unit) Forecast, by Application 2019 & 2032
- Table 37: Japan Renal Biomarkers Market Revenue (Million) Forecast, by Application 2019 & 2032
- Table 38: Japan Renal Biomarkers Market Volume (K Unit) Forecast, by Application 2019 & 2032
- Table 39: India Renal Biomarkers Market Revenue (Million) Forecast, by Application 2019 & 2032
- Table 40: India Renal Biomarkers Market Volume (K Unit) Forecast, by Application 2019 & 2032
- Table 41: Australia Renal Biomarkers Market Revenue (Million) Forecast, by Application 2019 & 2032
- Table 42: Australia Renal Biomarkers Market Volume (K Unit) Forecast, by Application 2019 & 2032
- Table 43: South Korea Renal Biomarkers Market Revenue (Million) Forecast, by Application 2019 & 2032
- Table 44: South Korea Renal Biomarkers Market Volume (K Unit) Forecast, by Application 2019 & 2032
- Table 45: Rest of Asia Pacific Renal Biomarkers Market Revenue (Million) Forecast, by Application 2019 & 2032
- Table 46: Rest of Asia Pacific Renal Biomarkers Market Volume (K Unit) Forecast, by Application 2019 & 2032
- Table 47: Global Renal Biomarkers Market Revenue Million Forecast, by Country 2019 & 2032
- Table 48: Global Renal Biomarkers Market Volume K Unit Forecast, by Country 2019 & 2032
- Table 49: GCC Renal Biomarkers Market Revenue (Million) Forecast, by Application 2019 & 2032
- Table 50: GCC Renal Biomarkers Market Volume (K Unit) Forecast, by Application 2019 & 2032
- Table 51: South Africa Renal Biomarkers Market Revenue (Million) Forecast, by Application 2019 & 2032
- Table 52: South Africa Renal Biomarkers Market Volume (K Unit) Forecast, by Application 2019 & 2032
- Table 53: Rest of Middle East and Africa Renal Biomarkers Market Revenue (Million) Forecast, by Application 2019 & 2032
- Table 54: Rest of Middle East and Africa Renal Biomarkers Market Volume (K Unit) Forecast, by Application 2019 & 2032
- Table 55: Global Renal Biomarkers Market Revenue Million Forecast, by Country 2019 & 2032
- Table 56: Global Renal Biomarkers Market Volume K Unit Forecast, by Country 2019 & 2032
- Table 57: Brazil Renal Biomarkers Market Revenue (Million) Forecast, by Application 2019 & 2032
- Table 58: Brazil Renal Biomarkers Market Volume (K Unit) Forecast, by Application 2019 & 2032
- Table 59: Argentina Renal Biomarkers Market Revenue (Million) Forecast, by Application 2019 & 2032
- Table 60: Argentina Renal Biomarkers Market Volume (K Unit) Forecast, by Application 2019 & 2032
- Table 61: Rest of South America Renal Biomarkers Market Revenue (Million) Forecast, by Application 2019 & 2032
- Table 62: Rest of South America Renal Biomarkers Market Volume (K Unit) Forecast, by Application 2019 & 2032
- Table 63: Global Renal Biomarkers Market Revenue Million Forecast, by Biomarker Type 2019 & 2032
- Table 64: Global Renal Biomarkers Market Volume K Unit Forecast, by Biomarker Type 2019 & 2032
- Table 65: Global Renal Biomarkers Market Revenue Million Forecast, by Diagnostic Technique 2019 & 2032
- Table 66: Global Renal Biomarkers Market Volume K Unit Forecast, by Diagnostic Technique 2019 & 2032
- Table 67: Global Renal Biomarkers Market Revenue Million Forecast, by End User 2019 & 2032
- Table 68: Global Renal Biomarkers Market Volume K Unit Forecast, by End User 2019 & 2032
- Table 69: Global Renal Biomarkers Market Revenue Million Forecast, by Country 2019 & 2032
- Table 70: Global Renal Biomarkers Market Volume K Unit Forecast, by Country 2019 & 2032
- Table 71: United States Renal Biomarkers Market Revenue (Million) Forecast, by Application 2019 & 2032
- Table 72: United States Renal Biomarkers Market Volume (K Unit) Forecast, by Application 2019 & 2032
- Table 73: Canada Renal Biomarkers Market Revenue (Million) Forecast, by Application 2019 & 2032
- Table 74: Canada Renal Biomarkers Market Volume (K Unit) Forecast, by Application 2019 & 2032
- Table 75: Mexico Renal Biomarkers Market Revenue (Million) Forecast, by Application 2019 & 2032
- Table 76: Mexico Renal Biomarkers Market Volume (K Unit) Forecast, by Application 2019 & 2032
- Table 77: Global Renal Biomarkers Market Revenue Million Forecast, by Biomarker Type 2019 & 2032
- Table 78: Global Renal Biomarkers Market Volume K Unit Forecast, by Biomarker Type 2019 & 2032
- Table 79: Global Renal Biomarkers Market Revenue Million Forecast, by Diagnostic Technique 2019 & 2032
- Table 80: Global Renal Biomarkers Market Volume K Unit Forecast, by Diagnostic Technique 2019 & 2032
- Table 81: Global Renal Biomarkers Market Revenue Million Forecast, by End User 2019 & 2032
- Table 82: Global Renal Biomarkers Market Volume K Unit Forecast, by End User 2019 & 2032
- Table 83: Global Renal Biomarkers Market Revenue Million Forecast, by Country 2019 & 2032
- Table 84: Global Renal Biomarkers Market Volume K Unit Forecast, by Country 2019 & 2032
- Table 85: Germany Renal Biomarkers Market Revenue (Million) Forecast, by Application 2019 & 2032
- Table 86: Germany Renal Biomarkers Market Volume (K Unit) Forecast, by Application 2019 & 2032
- Table 87: United Kingdom Renal Biomarkers Market Revenue (Million) Forecast, by Application 2019 & 2032
- Table 88: United Kingdom Renal Biomarkers Market Volume (K Unit) Forecast, by Application 2019 & 2032
- Table 89: France Renal Biomarkers Market Revenue (Million) Forecast, by Application 2019 & 2032
- Table 90: France Renal Biomarkers Market Volume (K Unit) Forecast, by Application 2019 & 2032
- Table 91: Italy Renal Biomarkers Market Revenue (Million) Forecast, by Application 2019 & 2032
- Table 92: Italy Renal Biomarkers Market Volume (K Unit) Forecast, by Application 2019 & 2032
- Table 93: Spain Renal Biomarkers Market Revenue (Million) Forecast, by Application 2019 & 2032
- Table 94: Spain Renal Biomarkers Market Volume (K Unit) Forecast, by Application 2019 & 2032
- Table 95: Rest of Europe Renal Biomarkers Market Revenue (Million) Forecast, by Application 2019 & 2032
- Table 96: Rest of Europe Renal Biomarkers Market Volume (K Unit) Forecast, by Application 2019 & 2032
- Table 97: Global Renal Biomarkers Market Revenue Million Forecast, by Biomarker Type 2019 & 2032
- Table 98: Global Renal Biomarkers Market Volume K Unit Forecast, by Biomarker Type 2019 & 2032
- Table 99: Global Renal Biomarkers Market Revenue Million Forecast, by Diagnostic Technique 2019 & 2032
- Table 100: Global Renal Biomarkers Market Volume K Unit Forecast, by Diagnostic Technique 2019 & 2032
- Table 101: Global Renal Biomarkers Market Revenue Million Forecast, by End User 2019 & 2032
- Table 102: Global Renal Biomarkers Market Volume K Unit Forecast, by End User 2019 & 2032
- Table 103: Global Renal Biomarkers Market Revenue Million Forecast, by Country 2019 & 2032
- Table 104: Global Renal Biomarkers Market Volume K Unit Forecast, by Country 2019 & 2032
- Table 105: China Renal Biomarkers Market Revenue (Million) Forecast, by Application 2019 & 2032
- Table 106: China Renal Biomarkers Market Volume (K Unit) Forecast, by Application 2019 & 2032
- Table 107: Japan Renal Biomarkers Market Revenue (Million) Forecast, by Application 2019 & 2032
- Table 108: Japan Renal Biomarkers Market Volume (K Unit) Forecast, by Application 2019 & 2032
- Table 109: India Renal Biomarkers Market Revenue (Million) Forecast, by Application 2019 & 2032
- Table 110: India Renal Biomarkers Market Volume (K Unit) Forecast, by Application 2019 & 2032
- Table 111: Australia Renal Biomarkers Market Revenue (Million) Forecast, by Application 2019 & 2032
- Table 112: Australia Renal Biomarkers Market Volume (K Unit) Forecast, by Application 2019 & 2032
- Table 113: South Korea Renal Biomarkers Market Revenue (Million) Forecast, by Application 2019 & 2032
- Table 114: South Korea Renal Biomarkers Market Volume (K Unit) Forecast, by Application 2019 & 2032
- Table 115: Rest of Asia Pacific Renal Biomarkers Market Revenue (Million) Forecast, by Application 2019 & 2032
- Table 116: Rest of Asia Pacific Renal Biomarkers Market Volume (K Unit) Forecast, by Application 2019 & 2032
- Table 117: Global Renal Biomarkers Market Revenue Million Forecast, by Biomarker Type 2019 & 2032
- Table 118: Global Renal Biomarkers Market Volume K Unit Forecast, by Biomarker Type 2019 & 2032
- Table 119: Global Renal Biomarkers Market Revenue Million Forecast, by Diagnostic Technique 2019 & 2032
- Table 120: Global Renal Biomarkers Market Volume K Unit Forecast, by Diagnostic Technique 2019 & 2032
- Table 121: Global Renal Biomarkers Market Revenue Million Forecast, by End User 2019 & 2032
- Table 122: Global Renal Biomarkers Market Volume K Unit Forecast, by End User 2019 & 2032
- Table 123: Global Renal Biomarkers Market Revenue Million Forecast, by Country 2019 & 2032
- Table 124: Global Renal Biomarkers Market Volume K Unit Forecast, by Country 2019 & 2032
- Table 125: GCC Renal Biomarkers Market Revenue (Million) Forecast, by Application 2019 & 2032
- Table 126: GCC Renal Biomarkers Market Volume (K Unit) Forecast, by Application 2019 & 2032
- Table 127: South Africa Renal Biomarkers Market Revenue (Million) Forecast, by Application 2019 & 2032
- Table 128: South Africa Renal Biomarkers Market Volume (K Unit) Forecast, by Application 2019 & 2032
- Table 129: Rest of Middle East and Africa Renal Biomarkers Market Revenue (Million) Forecast, by Application 2019 & 2032
- Table 130: Rest of Middle East and Africa Renal Biomarkers Market Volume (K Unit) Forecast, by Application 2019 & 2032
- Table 131: Global Renal Biomarkers Market Revenue Million Forecast, by Biomarker Type 2019 & 2032
- Table 132: Global Renal Biomarkers Market Volume K Unit Forecast, by Biomarker Type 2019 & 2032
- Table 133: Global Renal Biomarkers Market Revenue Million Forecast, by Diagnostic Technique 2019 & 2032
- Table 134: Global Renal Biomarkers Market Volume K Unit Forecast, by Diagnostic Technique 2019 & 2032
- Table 135: Global Renal Biomarkers Market Revenue Million Forecast, by End User 2019 & 2032
- Table 136: Global Renal Biomarkers Market Volume K Unit Forecast, by End User 2019 & 2032
- Table 137: Global Renal Biomarkers Market Revenue Million Forecast, by Country 2019 & 2032
- Table 138: Global Renal Biomarkers Market Volume K Unit Forecast, by Country 2019 & 2032
- Table 139: Brazil Renal Biomarkers Market Revenue (Million) Forecast, by Application 2019 & 2032
- Table 140: Brazil Renal Biomarkers Market Volume (K Unit) Forecast, by Application 2019 & 2032
- Table 141: Argentina Renal Biomarkers Market Revenue (Million) Forecast, by Application 2019 & 2032
- Table 142: Argentina Renal Biomarkers Market Volume (K Unit) Forecast, by Application 2019 & 2032
- Table 143: Rest of South America Renal Biomarkers Market Revenue (Million) Forecast, by Application 2019 & 2032
- Table 144: Rest of South America Renal Biomarkers Market Volume (K Unit) Forecast, by Application 2019 & 2032
Frequently Asked Questions
1. What is the projected Compound Annual Growth Rate (CAGR) of the Renal Biomarkers Market?
The projected CAGR is approximately 7.53%.
2. Which companies are prominent players in the Renal Biomarkers Market?
Key companies in the market include BioMérieux, Enzo Life Sciences Inc , Randox Laboratories Ltd, BioPorto Diagnostics AS, Thermo Fisher Scientific Inc, Abbott Laboratories, Siemens Healthineers AG, F Hoffmann-La Roche AG, SEKISUI MEDICAL CO LTD, Sphingotec GmbH.
3. What are the main segments of the Renal Biomarkers Market?
The market segments include Biomarker Type, Diagnostic Technique, End User.
4. Can you provide details about the market size?
The market size is estimated to be USD 1.5 Million as of 2022.
5. What are some drivers contributing to market growth?
Rising Prevalence of Various Kidney-related Diseases; High Prevalence of Diabetes and High Blood Pressure. the Leading Cause of Renal Diseases; Rapid Technological Advances in the Field of Genetics.
6. What are the notable trends driving market growth?
Neutrophil Gelatinase-Associated Lipocalin (NGAL) is Expected to Project Significant Growth Over the Forecast Period.
7. Are there any restraints impacting market growth?
Issues Related to Regulatory and Reimbursement Systems.
8. Can you provide examples of recent developments in the market?
In January 2024, LifeLabs, a Canada-based healthcare management and laboratory services provider, partnered with Klinrisk, a Canadian AI-based medical device company focused on improving the early detection and treatment of chronic kidney disease (CKD) through the groundbreaking Klinrisk Score. Klinrisk test analyzes routine blood and urine samples.
9. What pricing options are available for accessing the report?
Pricing options include single-user, multi-user, and enterprise licenses priced at USD 4750, USD 5250, and USD 8750 respectively.
10. Is the market size provided in terms of value or volume?
The market size is provided in terms of value, measured in Million and volume, measured in K Unit.
11. Are there any specific market keywords associated with the report?
Yes, the market keyword associated with the report is "Renal Biomarkers Market," which aids in identifying and referencing the specific market segment covered.
12. How do I determine which pricing option suits my needs best?
The pricing options vary based on user requirements and access needs. Individual users may opt for single-user licenses, while businesses requiring broader access may choose multi-user or enterprise licenses for cost-effective access to the report.
13. Are there any additional resources or data provided in the Renal Biomarkers Market report?
While the report offers comprehensive insights, it's advisable to review the specific contents or supplementary materials provided to ascertain if additional resources or data are available.
14. How can I stay updated on further developments or reports in the Renal Biomarkers Market?
To stay informed about further developments, trends, and reports in the Renal Biomarkers Market, consider subscribing to industry newsletters, following relevant companies and organizations, or regularly checking reputable industry news sources and publications.
Methodology
Step 1 - Identification of Relevant Samples Size from Population Database


Step 2 - Approaches for Defining Global Market Size (Value, Volume* & Price*)

Note*: In applicable scenarios
Step 3 - Data Sources
Primary Research
- Web Analytics
- Survey Reports
- Research Institute
- Latest Research Reports
- Opinion Leaders
Secondary Research
- Annual Reports
- White Paper
- Latest Press Release
- Industry Association
- Paid Database
- Investor Presentations

Step 4 - Data Triangulation
Involves using different sources of information in order to increase the validity of a study
These sources are likely to be stakeholders in a program - participants, other researchers, program staff, other community members, and so on.
Then we put all data in single framework & apply various statistical tools to find out the dynamic on the market.
During the analysis stage, feedback from the stakeholder groups would be compared to determine areas of agreement as well as areas of divergence


