
Key Insights
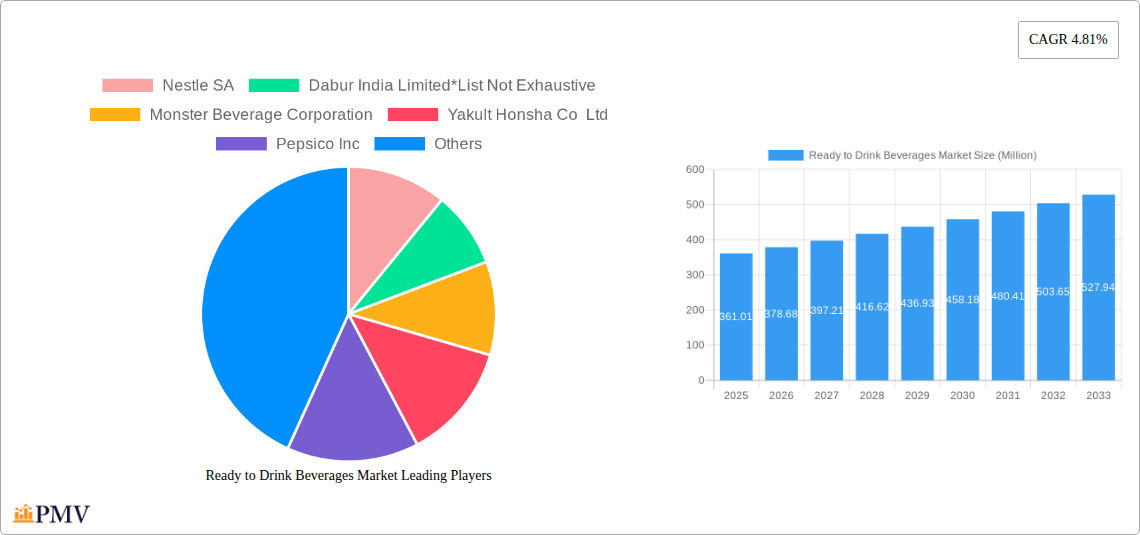
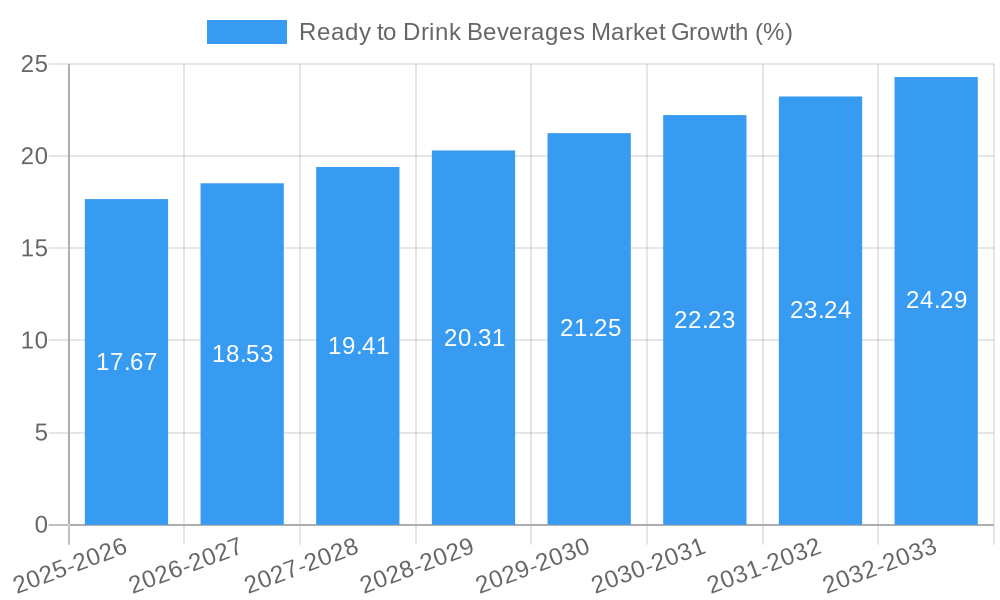
The Ready-to-Drink (RTD) beverages market, valued at $361.01 million in 2025, exhibits robust growth potential, projected to expand at a Compound Annual Growth Rate (CAGR) of 4.81% from 2025 to 2033. This growth is fueled by several key drivers. The increasing demand for convenient and on-the-go consumption options, particularly among younger demographics, significantly boosts market expansion. Furthermore, the rising disposable incomes in developing economies and the proliferation of health-conscious beverage choices, such as functional drinks and enhanced waters, are contributing to market expansion. The market is segmented by distribution channels (supermarkets/hypermarkets, convenience/grocery stores, online, specialty retail, and others) and product types (tea, coffee, energy drinks, yogurt drinks, dairy & dairy alternatives, flavored/fortified water, and others). Competition is fierce, with major players like Nestle, PepsiCo, Coca-Cola, and Red Bull vying for market share through product innovation and strategic partnerships. The shift towards online sales channels presents both opportunities and challenges as companies adapt to evolving consumer preferences and e-commerce logistics. Regional variations exist, with North America and Asia Pacific expected to be key contributors to market growth, driven by distinct consumer trends and market dynamics. Growth in these regions will also be affected by factors such as increasing health awareness and changing lifestyles.
The market's growth trajectory is, however, influenced by certain restraints. Fluctuating raw material prices and stringent regulatory environments in some regions can pose challenges. Furthermore, consumer concerns surrounding sugar content and artificial additives in certain beverage categories necessitate a shift towards healthier alternatives. Companies are actively addressing these concerns by introducing low-sugar and organic options to cater to the growing demand for healthier RTD beverages. This necessitates adaptation and innovation within the industry to maintain a competitive edge in a rapidly evolving market landscape. Success will hinge on responding to shifting consumer preferences by introducing healthier product choices, effective marketing strategies, and efficient distribution networks. Companies prioritizing sustainability and ethically sourced ingredients will likely gain a competitive advantage.
Ready to Drink Beverages Market: A Comprehensive Market Report (2019-2033)
This detailed report provides a comprehensive analysis of the Ready to Drink Beverages market, offering invaluable insights for businesses and investors seeking to navigate this dynamic sector. With a study period spanning 2019-2033, a base year of 2025, and a forecast period of 2025-2033, this report leverages historical data (2019-2024) to provide accurate and actionable predictions. The market is segmented by distribution channel and product type, allowing for a granular understanding of current trends and future growth potential. The report values are expressed in Millions.
Ready to Drink Beverages Market Structure & Competitive Dynamics
The Ready to Drink Beverages market exhibits a moderately concentrated structure, with a few major players holding significant market share. However, the market also features numerous smaller players, particularly in niche segments like specialty beverages. The competitive landscape is characterized by intense innovation, particularly in product development and packaging, to appeal to evolving consumer preferences. Regulatory frameworks, including those related to labeling, ingredients, and sustainability, significantly influence market dynamics. Product substitution, particularly from healthier alternatives like infused waters and functional beverages, poses a challenge for traditional players. The market also witnesses frequent mergers and acquisitions (M&A) activities, with deal values varying significantly depending on the size and target of the acquisition. For instance, xx Million worth of M&A deals were recorded in 2024. Key factors driving M&A activity include expansion into new geographic markets and acquisition of innovative product portfolios.
- Market Concentration: Moderately concentrated, with significant players holding xx% market share in 2024.
- Innovation Ecosystems: Strong focus on product diversification, functional benefits, and sustainable packaging.
- Regulatory Frameworks: Significant impact on product formulation, labeling, and marketing.
- Product Substitutes: Growing competition from healthier and functional beverage alternatives.
- End-User Trends: Increasing demand for convenience, health and wellness, and sustainable products.
- M&A Activity: Frequent acquisitions driving market consolidation and expansion.
Ready to Drink Beverages Market Industry Trends & Insights
The Ready to Drink Beverages market demonstrates robust growth, driven by several key factors. Rising disposable incomes, especially in emerging economies, coupled with changing lifestyles and increased demand for convenience, fuel market expansion. Technological advancements in processing, packaging, and distribution are enhancing efficiency and expanding market reach. Consumer preferences are shifting toward healthier and functional beverages, with a growing demand for low-sugar, organic, and naturally flavored options. Competitive dynamics are intensifying, with established players and new entrants constantly innovating to capture market share. The market is projected to witness a CAGR of xx% during the forecast period (2025-2033), with market penetration rates for specific product categories showing significant increases. For example, the market penetration of functional beverages is anticipated to increase by xx% by 2033.
Dominant Markets & Segments in Ready to Drink Beverages Market
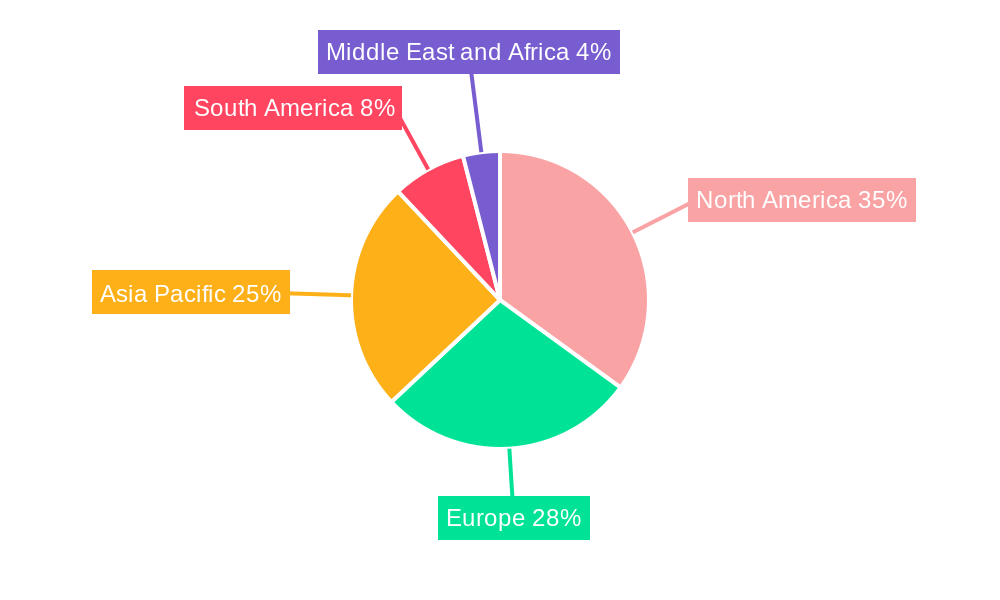
The North American region currently dominates the Ready to Drink Beverages market, driven by high consumption levels and established distribution networks. Within this region, the United States holds the largest market share, fueled by strong consumer demand and the presence of major players. However, emerging markets in Asia-Pacific are demonstrating rapid growth potential.
Dominant Segments:
Distribution Channel: Supermarkets/Hypermarkets remain the leading distribution channel, due to their wide reach and established infrastructure. However, online stores are experiencing rapid growth, driven by increasing e-commerce penetration.
Product Type: Energy drinks and flavored/fortified water are currently high-growth segments. The demand for energy drinks is propelled by changing lifestyles and growing work pressures, while the preference for healthier hydration choices supports the growth of flavored/fortified waters. The dairy and dairy alternative segment is also experiencing significant expansion, driven by increased health consciousness.
Key Drivers:
- Economic policies: Favorable economic conditions in key regions drive increased disposable income and consumer spending.
- Infrastructure: Well-developed infrastructure in North America and parts of Europe facilitates efficient distribution and retail operations.
Ready to Drink Beverages Market Product Innovations
The Ready to Drink Beverages market is witnessing a wave of product innovations, driven by consumer demand for healthier, functional, and convenient options. This includes the introduction of organic and natural ingredients, low-sugar formulations, functional additions like vitamins and probiotics, and innovative packaging to enhance shelf life and consumer experience. Technological advancements such as high-pressure processing and aseptic packaging are enabling the development of longer-lasting, healthier products. These innovations cater to the evolving needs and preferences of health-conscious consumers, providing a competitive edge to companies that can effectively integrate these trends into their product portfolios.
Report Segmentation & Scope
This report segments the Ready to Drink Beverages market based on distribution channels and product types, offering a detailed analysis of each segment.
Distribution Channels: Supermarkets/Hypermarkets, Convenience/Grocery Stores, Online Stores, Specialty Retail Stores, and Other Distribution Channels. Each channel segment will include market size, growth projections, and competitive analysis.
Product Types: Tea, Coffee, Energy Drinks, Yogurt Drinks, Dairy and Dairy Alternative Beverages, Flavored & Fortified Water, and Other Product Types. Growth forecasts and competitive landscapes are provided for each product type, reflecting evolving consumer preferences and competitive dynamics.
Key Drivers of Ready to Drink Beverages Market Growth
The Ready to Drink Beverages market's growth is fueled by several key factors, including rising disposable incomes, increasing health consciousness, and technological advancements in product development and packaging. The growing demand for convenient and healthier beverage options further bolsters market growth. Government regulations supporting sustainable practices also influence product innovation and market expansion.
Challenges in the Ready to Drink Beverages Market Sector
The Ready to Drink Beverages market faces several challenges, including intense competition, evolving consumer preferences, and fluctuating raw material prices. Stringent regulatory frameworks related to food safety and labeling pose another hurdle. Supply chain disruptions and increasing sustainability concerns add to the complexities faced by market players. These factors contribute to increased production costs and potential price fluctuations, impacting overall market profitability.
Leading Players in the Ready to Drink Beverages Market Market
- Nestle SA
- Dabur India Limited
- Monster Beverage Corporation
- Yakult Honsha Co Ltd
- Pepsico Inc
- Danone SA
- Suntory Holdings Limited
- Red Bull GmbH
- Blue Diamond Growers
- The Coca-Cola Company
Key Developments in Ready to Drink Beverages Market Sector
February 2023: PepsiCo launched a marshmallow-flavored cola, showcasing innovative product development and leveraging brand collaborations.
September 2022: Honest Tea launched Just Iced Tea, highlighting the growing consumer demand for organic and ethically sourced products.
March 2022: Nirvana Water Sciences Inc. introduced Nirvana HMB water, demonstrating the trend towards functional beverages with health benefits.
Strategic Ready to Drink Beverages Market Outlook
The Ready to Drink Beverages market presents significant future growth potential, driven by evolving consumer preferences and technological innovations. Strategic opportunities exist for companies to focus on developing healthier, functional, and sustainable products. Expanding into emerging markets and leveraging digital channels will be crucial for capturing market share. Companies that adapt to changing consumer demands and innovate effectively will be well-positioned for success in this dynamic market.
Ready to Drink Beverages Market Segmentation
-
1. Product Type
- 1.1. Tea
- 1.2. Coffee
- 1.3. Energy Drinks
- 1.4. Yogurt Drinks
- 1.5. Dairy and Dairy Alternative Beverages
- 1.6. Flavored and Fortified Water
- 1.7. Other Product Types
-
2. Distribution Channel
- 2.1. Supermarkets/Hypermarkets
- 2.2. Convenience/Grocery Stores
- 2.3. Online Stores
- 2.4. Specialty Retail Stores
- 2.5. Other Distribution Channels
Ready to Drink Beverages Market Segmentation By Geography
-
1. North America
- 1.1. United States
- 1.2. Canada
- 1.3. Mexico
- 1.4. Rest of North America
-
2. Europe
- 2.1. Germany
- 2.2. United Kingdom
- 2.3. Italy
- 2.4. Spain
- 2.5. France
- 2.6. Russia
- 2.7. Rest of Europe
-
3. Asia Pacific
- 3.1. China
- 3.2. Japan
- 3.3. India
- 3.4. Australia
- 3.5. Rest of Asia Pacific
-
4. South America
- 4.1. Brazil
- 4.2. Argentina
- 4.3. Rest of South America
-
5. Middle East and Africa
- 5.1. South Africa
- 5.2. Saudi Arabia
- 5.3. Rest of Middle East and Africa
Ready to Drink Beverages Market REPORT HIGHLIGHTS
| Aspects | Details |
|---|---|
| Study Period | 2019-2033 |
| Base Year | 2024 |
| Estimated Year | 2025 |
| Forecast Period | 2025-2033 |
| Historical Period | 2019-2024 |
| Growth Rate | CAGR of 4.81% from 2019-2033 |
| Segmentation |
|
Table of Contents
- 1. Introduction
- 1.1. Research Scope
- 1.2. Market Segmentation
- 1.3. Research Methodology
- 1.4. Definitions and Assumptions
- 2. Executive Summary
- 2.1. Introduction
- 3. Market Dynamics
- 3.1. Introduction
- 3.2. Market Drivers
- 3.2.1. Inclination Toward Low-Sugar/Sugar-free Beverages
- 3.3. Market Restrains
- 3.3.1. Concerns Over Health Issues Associated with Functional Beverages
- 3.4. Market Trends
- 3.4.1. Augmented Expenditure on Advertisement and Promotional Activities Impel Market Growth
- 4. Market Factor Analysis
- 4.1. Porters Five Forces
- 4.2. Supply/Value Chain
- 4.3. PESTEL analysis
- 4.4. Market Entropy
- 4.5. Patent/Trademark Analysis
- 5. Global Ready to Drink Beverages Market Analysis, Insights and Forecast, 2019-2031
- 5.1. Market Analysis, Insights and Forecast - by Product Type
- 5.1.1. Tea
- 5.1.2. Coffee
- 5.1.3. Energy Drinks
- 5.1.4. Yogurt Drinks
- 5.1.5. Dairy and Dairy Alternative Beverages
- 5.1.6. Flavored and Fortified Water
- 5.1.7. Other Product Types
- 5.2. Market Analysis, Insights and Forecast - by Distribution Channel
- 5.2.1. Supermarkets/Hypermarkets
- 5.2.2. Convenience/Grocery Stores
- 5.2.3. Online Stores
- 5.2.4. Specialty Retail Stores
- 5.2.5. Other Distribution Channels
- 5.3. Market Analysis, Insights and Forecast - by Region
- 5.3.1. North America
- 5.3.2. Europe
- 5.3.3. Asia Pacific
- 5.3.4. South America
- 5.3.5. Middle East and Africa
- 5.1. Market Analysis, Insights and Forecast - by Product Type
- 6. North America Ready to Drink Beverages Market Analysis, Insights and Forecast, 2019-2031
- 6.1. Market Analysis, Insights and Forecast - by Product Type
- 6.1.1. Tea
- 6.1.2. Coffee
- 6.1.3. Energy Drinks
- 6.1.4. Yogurt Drinks
- 6.1.5. Dairy and Dairy Alternative Beverages
- 6.1.6. Flavored and Fortified Water
- 6.1.7. Other Product Types
- 6.2. Market Analysis, Insights and Forecast - by Distribution Channel
- 6.2.1. Supermarkets/Hypermarkets
- 6.2.2. Convenience/Grocery Stores
- 6.2.3. Online Stores
- 6.2.4. Specialty Retail Stores
- 6.2.5. Other Distribution Channels
- 6.1. Market Analysis, Insights and Forecast - by Product Type
- 7. Europe Ready to Drink Beverages Market Analysis, Insights and Forecast, 2019-2031
- 7.1. Market Analysis, Insights and Forecast - by Product Type
- 7.1.1. Tea
- 7.1.2. Coffee
- 7.1.3. Energy Drinks
- 7.1.4. Yogurt Drinks
- 7.1.5. Dairy and Dairy Alternative Beverages
- 7.1.6. Flavored and Fortified Water
- 7.1.7. Other Product Types
- 7.2. Market Analysis, Insights and Forecast - by Distribution Channel
- 7.2.1. Supermarkets/Hypermarkets
- 7.2.2. Convenience/Grocery Stores
- 7.2.3. Online Stores
- 7.2.4. Specialty Retail Stores
- 7.2.5. Other Distribution Channels
- 7.1. Market Analysis, Insights and Forecast - by Product Type
- 8. Asia Pacific Ready to Drink Beverages Market Analysis, Insights and Forecast, 2019-2031
- 8.1. Market Analysis, Insights and Forecast - by Product Type
- 8.1.1. Tea
- 8.1.2. Coffee
- 8.1.3. Energy Drinks
- 8.1.4. Yogurt Drinks
- 8.1.5. Dairy and Dairy Alternative Beverages
- 8.1.6. Flavored and Fortified Water
- 8.1.7. Other Product Types
- 8.2. Market Analysis, Insights and Forecast - by Distribution Channel
- 8.2.1. Supermarkets/Hypermarkets
- 8.2.2. Convenience/Grocery Stores
- 8.2.3. Online Stores
- 8.2.4. Specialty Retail Stores
- 8.2.5. Other Distribution Channels
- 8.1. Market Analysis, Insights and Forecast - by Product Type
- 9. South America Ready to Drink Beverages Market Analysis, Insights and Forecast, 2019-2031
- 9.1. Market Analysis, Insights and Forecast - by Product Type
- 9.1.1. Tea
- 9.1.2. Coffee
- 9.1.3. Energy Drinks
- 9.1.4. Yogurt Drinks
- 9.1.5. Dairy and Dairy Alternative Beverages
- 9.1.6. Flavored and Fortified Water
- 9.1.7. Other Product Types
- 9.2. Market Analysis, Insights and Forecast - by Distribution Channel
- 9.2.1. Supermarkets/Hypermarkets
- 9.2.2. Convenience/Grocery Stores
- 9.2.3. Online Stores
- 9.2.4. Specialty Retail Stores
- 9.2.5. Other Distribution Channels
- 9.1. Market Analysis, Insights and Forecast - by Product Type
- 10. Middle East and Africa Ready to Drink Beverages Market Analysis, Insights and Forecast, 2019-2031
- 10.1. Market Analysis, Insights and Forecast - by Product Type
- 10.1.1. Tea
- 10.1.2. Coffee
- 10.1.3. Energy Drinks
- 10.1.4. Yogurt Drinks
- 10.1.5. Dairy and Dairy Alternative Beverages
- 10.1.6. Flavored and Fortified Water
- 10.1.7. Other Product Types
- 10.2. Market Analysis, Insights and Forecast - by Distribution Channel
- 10.2.1. Supermarkets/Hypermarkets
- 10.2.2. Convenience/Grocery Stores
- 10.2.3. Online Stores
- 10.2.4. Specialty Retail Stores
- 10.2.5. Other Distribution Channels
- 10.1. Market Analysis, Insights and Forecast - by Product Type
- 11. North America Ready to Drink Beverages Market Analysis, Insights and Forecast, 2019-2031
- 11.1. Market Analysis, Insights and Forecast - By Country/Sub-region
- 11.1.1 United States
- 11.1.2 Canada
- 11.1.3 Mexico
- 11.1.4 Rest of North America
- 12. Europe Ready to Drink Beverages Market Analysis, Insights and Forecast, 2019-2031
- 12.1. Market Analysis, Insights and Forecast - By Country/Sub-region
- 12.1.1 Germany
- 12.1.2 United Kingdom
- 12.1.3 Italy
- 12.1.4 Spain
- 12.1.5 France
- 12.1.6 Russia
- 12.1.7 Rest of Europe
- 13. Asia Pacific Ready to Drink Beverages Market Analysis, Insights and Forecast, 2019-2031
- 13.1. Market Analysis, Insights and Forecast - By Country/Sub-region
- 13.1.1 China
- 13.1.2 Japan
- 13.1.3 India
- 13.1.4 Australia
- 13.1.5 Rest of Asia Pacific
- 14. South America Ready to Drink Beverages Market Analysis, Insights and Forecast, 2019-2031
- 14.1. Market Analysis, Insights and Forecast - By Country/Sub-region
- 14.1.1 Brazil
- 14.1.2 Argentina
- 14.1.3 Rest of South America
- 15. Middle East and Africa Ready to Drink Beverages Market Analysis, Insights and Forecast, 2019-2031
- 15.1. Market Analysis, Insights and Forecast - By Country/Sub-region
- 15.1.1 South Africa
- 15.1.2 Saudi Arabia
- 15.1.3 Rest of Middle East and Africa
- 16. Competitive Analysis
- 16.1. Global Market Share Analysis 2024
- 16.2. Company Profiles
- 16.2.1 Nestle SA
- 16.2.1.1. Overview
- 16.2.1.2. Products
- 16.2.1.3. SWOT Analysis
- 16.2.1.4. Recent Developments
- 16.2.1.5. Financials (Based on Availability)
- 16.2.2 Dabur India Limited*List Not Exhaustive
- 16.2.2.1. Overview
- 16.2.2.2. Products
- 16.2.2.3. SWOT Analysis
- 16.2.2.4. Recent Developments
- 16.2.2.5. Financials (Based on Availability)
- 16.2.3 Monster Beverage Corporation
- 16.2.3.1. Overview
- 16.2.3.2. Products
- 16.2.3.3. SWOT Analysis
- 16.2.3.4. Recent Developments
- 16.2.3.5. Financials (Based on Availability)
- 16.2.4 Yakult Honsha Co Ltd
- 16.2.4.1. Overview
- 16.2.4.2. Products
- 16.2.4.3. SWOT Analysis
- 16.2.4.4. Recent Developments
- 16.2.4.5. Financials (Based on Availability)
- 16.2.5 Pepsico Inc
- 16.2.5.1. Overview
- 16.2.5.2. Products
- 16.2.5.3. SWOT Analysis
- 16.2.5.4. Recent Developments
- 16.2.5.5. Financials (Based on Availability)
- 16.2.6 Danone SA
- 16.2.6.1. Overview
- 16.2.6.2. Products
- 16.2.6.3. SWOT Analysis
- 16.2.6.4. Recent Developments
- 16.2.6.5. Financials (Based on Availability)
- 16.2.7 Suntory Holdings Limited
- 16.2.7.1. Overview
- 16.2.7.2. Products
- 16.2.7.3. SWOT Analysis
- 16.2.7.4. Recent Developments
- 16.2.7.5. Financials (Based on Availability)
- 16.2.8 Red Bull GmbH
- 16.2.8.1. Overview
- 16.2.8.2. Products
- 16.2.8.3. SWOT Analysis
- 16.2.8.4. Recent Developments
- 16.2.8.5. Financials (Based on Availability)
- 16.2.9 Blue Diamond Growers
- 16.2.9.1. Overview
- 16.2.9.2. Products
- 16.2.9.3. SWOT Analysis
- 16.2.9.4. Recent Developments
- 16.2.9.5. Financials (Based on Availability)
- 16.2.10 The Coca-Cola Company
- 16.2.10.1. Overview
- 16.2.10.2. Products
- 16.2.10.3. SWOT Analysis
- 16.2.10.4. Recent Developments
- 16.2.10.5. Financials (Based on Availability)
- 16.2.1 Nestle SA
List of Figures
- Figure 1: Global Ready to Drink Beverages Market Revenue Breakdown (Million, %) by Region 2024 & 2032
- Figure 2: North America Ready to Drink Beverages Market Revenue (Million), by Country 2024 & 2032
- Figure 3: North America Ready to Drink Beverages Market Revenue Share (%), by Country 2024 & 2032
- Figure 4: Europe Ready to Drink Beverages Market Revenue (Million), by Country 2024 & 2032
- Figure 5: Europe Ready to Drink Beverages Market Revenue Share (%), by Country 2024 & 2032
- Figure 6: Asia Pacific Ready to Drink Beverages Market Revenue (Million), by Country 2024 & 2032
- Figure 7: Asia Pacific Ready to Drink Beverages Market Revenue Share (%), by Country 2024 & 2032
- Figure 8: South America Ready to Drink Beverages Market Revenue (Million), by Country 2024 & 2032
- Figure 9: South America Ready to Drink Beverages Market Revenue Share (%), by Country 2024 & 2032
- Figure 10: Middle East and Africa Ready to Drink Beverages Market Revenue (Million), by Country 2024 & 2032
- Figure 11: Middle East and Africa Ready to Drink Beverages Market Revenue Share (%), by Country 2024 & 2032
- Figure 12: North America Ready to Drink Beverages Market Revenue (Million), by Product Type 2024 & 2032
- Figure 13: North America Ready to Drink Beverages Market Revenue Share (%), by Product Type 2024 & 2032
- Figure 14: North America Ready to Drink Beverages Market Revenue (Million), by Distribution Channel 2024 & 2032
- Figure 15: North America Ready to Drink Beverages Market Revenue Share (%), by Distribution Channel 2024 & 2032
- Figure 16: North America Ready to Drink Beverages Market Revenue (Million), by Country 2024 & 2032
- Figure 17: North America Ready to Drink Beverages Market Revenue Share (%), by Country 2024 & 2032
- Figure 18: Europe Ready to Drink Beverages Market Revenue (Million), by Product Type 2024 & 2032
- Figure 19: Europe Ready to Drink Beverages Market Revenue Share (%), by Product Type 2024 & 2032
- Figure 20: Europe Ready to Drink Beverages Market Revenue (Million), by Distribution Channel 2024 & 2032
- Figure 21: Europe Ready to Drink Beverages Market Revenue Share (%), by Distribution Channel 2024 & 2032
- Figure 22: Europe Ready to Drink Beverages Market Revenue (Million), by Country 2024 & 2032
- Figure 23: Europe Ready to Drink Beverages Market Revenue Share (%), by Country 2024 & 2032
- Figure 24: Asia Pacific Ready to Drink Beverages Market Revenue (Million), by Product Type 2024 & 2032
- Figure 25: Asia Pacific Ready to Drink Beverages Market Revenue Share (%), by Product Type 2024 & 2032
- Figure 26: Asia Pacific Ready to Drink Beverages Market Revenue (Million), by Distribution Channel 2024 & 2032
- Figure 27: Asia Pacific Ready to Drink Beverages Market Revenue Share (%), by Distribution Channel 2024 & 2032
- Figure 28: Asia Pacific Ready to Drink Beverages Market Revenue (Million), by Country 2024 & 2032
- Figure 29: Asia Pacific Ready to Drink Beverages Market Revenue Share (%), by Country 2024 & 2032
- Figure 30: South America Ready to Drink Beverages Market Revenue (Million), by Product Type 2024 & 2032
- Figure 31: South America Ready to Drink Beverages Market Revenue Share (%), by Product Type 2024 & 2032
- Figure 32: South America Ready to Drink Beverages Market Revenue (Million), by Distribution Channel 2024 & 2032
- Figure 33: South America Ready to Drink Beverages Market Revenue Share (%), by Distribution Channel 2024 & 2032
- Figure 34: South America Ready to Drink Beverages Market Revenue (Million), by Country 2024 & 2032
- Figure 35: South America Ready to Drink Beverages Market Revenue Share (%), by Country 2024 & 2032
- Figure 36: Middle East and Africa Ready to Drink Beverages Market Revenue (Million), by Product Type 2024 & 2032
- Figure 37: Middle East and Africa Ready to Drink Beverages Market Revenue Share (%), by Product Type 2024 & 2032
- Figure 38: Middle East and Africa Ready to Drink Beverages Market Revenue (Million), by Distribution Channel 2024 & 2032
- Figure 39: Middle East and Africa Ready to Drink Beverages Market Revenue Share (%), by Distribution Channel 2024 & 2032
- Figure 40: Middle East and Africa Ready to Drink Beverages Market Revenue (Million), by Country 2024 & 2032
- Figure 41: Middle East and Africa Ready to Drink Beverages Market Revenue Share (%), by Country 2024 & 2032
List of Tables
- Table 1: Global Ready to Drink Beverages Market Revenue Million Forecast, by Region 2019 & 2032
- Table 2: Global Ready to Drink Beverages Market Revenue Million Forecast, by Product Type 2019 & 2032
- Table 3: Global Ready to Drink Beverages Market Revenue Million Forecast, by Distribution Channel 2019 & 2032
- Table 4: Global Ready to Drink Beverages Market Revenue Million Forecast, by Region 2019 & 2032
- Table 5: Global Ready to Drink Beverages Market Revenue Million Forecast, by Country 2019 & 2032
- Table 6: United States Ready to Drink Beverages Market Revenue (Million) Forecast, by Application 2019 & 2032
- Table 7: Canada Ready to Drink Beverages Market Revenue (Million) Forecast, by Application 2019 & 2032
- Table 8: Mexico Ready to Drink Beverages Market Revenue (Million) Forecast, by Application 2019 & 2032
- Table 9: Rest of North America Ready to Drink Beverages Market Revenue (Million) Forecast, by Application 2019 & 2032
- Table 10: Global Ready to Drink Beverages Market Revenue Million Forecast, by Country 2019 & 2032
- Table 11: Germany Ready to Drink Beverages Market Revenue (Million) Forecast, by Application 2019 & 2032
- Table 12: United Kingdom Ready to Drink Beverages Market Revenue (Million) Forecast, by Application 2019 & 2032
- Table 13: Italy Ready to Drink Beverages Market Revenue (Million) Forecast, by Application 2019 & 2032
- Table 14: Spain Ready to Drink Beverages Market Revenue (Million) Forecast, by Application 2019 & 2032
- Table 15: France Ready to Drink Beverages Market Revenue (Million) Forecast, by Application 2019 & 2032
- Table 16: Russia Ready to Drink Beverages Market Revenue (Million) Forecast, by Application 2019 & 2032
- Table 17: Rest of Europe Ready to Drink Beverages Market Revenue (Million) Forecast, by Application 2019 & 2032
- Table 18: Global Ready to Drink Beverages Market Revenue Million Forecast, by Country 2019 & 2032
- Table 19: China Ready to Drink Beverages Market Revenue (Million) Forecast, by Application 2019 & 2032
- Table 20: Japan Ready to Drink Beverages Market Revenue (Million) Forecast, by Application 2019 & 2032
- Table 21: India Ready to Drink Beverages Market Revenue (Million) Forecast, by Application 2019 & 2032
- Table 22: Australia Ready to Drink Beverages Market Revenue (Million) Forecast, by Application 2019 & 2032
- Table 23: Rest of Asia Pacific Ready to Drink Beverages Market Revenue (Million) Forecast, by Application 2019 & 2032
- Table 24: Global Ready to Drink Beverages Market Revenue Million Forecast, by Country 2019 & 2032
- Table 25: Brazil Ready to Drink Beverages Market Revenue (Million) Forecast, by Application 2019 & 2032
- Table 26: Argentina Ready to Drink Beverages Market Revenue (Million) Forecast, by Application 2019 & 2032
- Table 27: Rest of South America Ready to Drink Beverages Market Revenue (Million) Forecast, by Application 2019 & 2032
- Table 28: Global Ready to Drink Beverages Market Revenue Million Forecast, by Country 2019 & 2032
- Table 29: South Africa Ready to Drink Beverages Market Revenue (Million) Forecast, by Application 2019 & 2032
- Table 30: Saudi Arabia Ready to Drink Beverages Market Revenue (Million) Forecast, by Application 2019 & 2032
- Table 31: Rest of Middle East and Africa Ready to Drink Beverages Market Revenue (Million) Forecast, by Application 2019 & 2032
- Table 32: Global Ready to Drink Beverages Market Revenue Million Forecast, by Product Type 2019 & 2032
- Table 33: Global Ready to Drink Beverages Market Revenue Million Forecast, by Distribution Channel 2019 & 2032
- Table 34: Global Ready to Drink Beverages Market Revenue Million Forecast, by Country 2019 & 2032
- Table 35: United States Ready to Drink Beverages Market Revenue (Million) Forecast, by Application 2019 & 2032
- Table 36: Canada Ready to Drink Beverages Market Revenue (Million) Forecast, by Application 2019 & 2032
- Table 37: Mexico Ready to Drink Beverages Market Revenue (Million) Forecast, by Application 2019 & 2032
- Table 38: Rest of North America Ready to Drink Beverages Market Revenue (Million) Forecast, by Application 2019 & 2032
- Table 39: Global Ready to Drink Beverages Market Revenue Million Forecast, by Product Type 2019 & 2032
- Table 40: Global Ready to Drink Beverages Market Revenue Million Forecast, by Distribution Channel 2019 & 2032
- Table 41: Global Ready to Drink Beverages Market Revenue Million Forecast, by Country 2019 & 2032
- Table 42: Germany Ready to Drink Beverages Market Revenue (Million) Forecast, by Application 2019 & 2032
- Table 43: United Kingdom Ready to Drink Beverages Market Revenue (Million) Forecast, by Application 2019 & 2032
- Table 44: Italy Ready to Drink Beverages Market Revenue (Million) Forecast, by Application 2019 & 2032
- Table 45: Spain Ready to Drink Beverages Market Revenue (Million) Forecast, by Application 2019 & 2032
- Table 46: France Ready to Drink Beverages Market Revenue (Million) Forecast, by Application 2019 & 2032
- Table 47: Russia Ready to Drink Beverages Market Revenue (Million) Forecast, by Application 2019 & 2032
- Table 48: Rest of Europe Ready to Drink Beverages Market Revenue (Million) Forecast, by Application 2019 & 2032
- Table 49: Global Ready to Drink Beverages Market Revenue Million Forecast, by Product Type 2019 & 2032
- Table 50: Global Ready to Drink Beverages Market Revenue Million Forecast, by Distribution Channel 2019 & 2032
- Table 51: Global Ready to Drink Beverages Market Revenue Million Forecast, by Country 2019 & 2032
- Table 52: China Ready to Drink Beverages Market Revenue (Million) Forecast, by Application 2019 & 2032
- Table 53: Japan Ready to Drink Beverages Market Revenue (Million) Forecast, by Application 2019 & 2032
- Table 54: India Ready to Drink Beverages Market Revenue (Million) Forecast, by Application 2019 & 2032
- Table 55: Australia Ready to Drink Beverages Market Revenue (Million) Forecast, by Application 2019 & 2032
- Table 56: Rest of Asia Pacific Ready to Drink Beverages Market Revenue (Million) Forecast, by Application 2019 & 2032
- Table 57: Global Ready to Drink Beverages Market Revenue Million Forecast, by Product Type 2019 & 2032
- Table 58: Global Ready to Drink Beverages Market Revenue Million Forecast, by Distribution Channel 2019 & 2032
- Table 59: Global Ready to Drink Beverages Market Revenue Million Forecast, by Country 2019 & 2032
- Table 60: Brazil Ready to Drink Beverages Market Revenue (Million) Forecast, by Application 2019 & 2032
- Table 61: Argentina Ready to Drink Beverages Market Revenue (Million) Forecast, by Application 2019 & 2032
- Table 62: Rest of South America Ready to Drink Beverages Market Revenue (Million) Forecast, by Application 2019 & 2032
- Table 63: Global Ready to Drink Beverages Market Revenue Million Forecast, by Product Type 2019 & 2032
- Table 64: Global Ready to Drink Beverages Market Revenue Million Forecast, by Distribution Channel 2019 & 2032
- Table 65: Global Ready to Drink Beverages Market Revenue Million Forecast, by Country 2019 & 2032
- Table 66: South Africa Ready to Drink Beverages Market Revenue (Million) Forecast, by Application 2019 & 2032
- Table 67: Saudi Arabia Ready to Drink Beverages Market Revenue (Million) Forecast, by Application 2019 & 2032
- Table 68: Rest of Middle East and Africa Ready to Drink Beverages Market Revenue (Million) Forecast, by Application 2019 & 2032
Frequently Asked Questions
1. What is the projected Compound Annual Growth Rate (CAGR) of the Ready to Drink Beverages Market?
The projected CAGR is approximately 4.81%.
2. Which companies are prominent players in the Ready to Drink Beverages Market?
Key companies in the market include Nestle SA, Dabur India Limited*List Not Exhaustive, Monster Beverage Corporation, Yakult Honsha Co Ltd, Pepsico Inc, Danone SA, Suntory Holdings Limited, Red Bull GmbH, Blue Diamond Growers, The Coca-Cola Company.
3. What are the main segments of the Ready to Drink Beverages Market?
The market segments include Product Type, Distribution Channel.
4. Can you provide details about the market size?
The market size is estimated to be USD 361.01 Million as of 2022.
5. What are some drivers contributing to market growth?
Inclination Toward Low-Sugar/Sugar-free Beverages.
6. What are the notable trends driving market growth?
Augmented Expenditure on Advertisement and Promotional Activities Impel Market Growth.
7. Are there any restraints impacting market growth?
Concerns Over Health Issues Associated with Functional Beverages.
8. Can you provide examples of recent developments in the market?
February 2023: Pepsi Co. launched marshmallow-flavored Cola in partnership with Peeps. The pillowy-soft marshmallow cola flavor, paired with the instantly recognizable PEEPS®, comes in vibrant yellow packaging.
9. What pricing options are available for accessing the report?
Pricing options include single-user, multi-user, and enterprise licenses priced at USD 4750, USD 5250, and USD 8750 respectively.
10. Is the market size provided in terms of value or volume?
The market size is provided in terms of value, measured in Million.
11. Are there any specific market keywords associated with the report?
Yes, the market keyword associated with the report is "Ready to Drink Beverages Market," which aids in identifying and referencing the specific market segment covered.
12. How do I determine which pricing option suits my needs best?
The pricing options vary based on user requirements and access needs. Individual users may opt for single-user licenses, while businesses requiring broader access may choose multi-user or enterprise licenses for cost-effective access to the report.
13. Are there any additional resources or data provided in the Ready to Drink Beverages Market report?
While the report offers comprehensive insights, it's advisable to review the specific contents or supplementary materials provided to ascertain if additional resources or data are available.
14. How can I stay updated on further developments or reports in the Ready to Drink Beverages Market?
To stay informed about further developments, trends, and reports in the Ready to Drink Beverages Market, consider subscribing to industry newsletters, following relevant companies and organizations, or regularly checking reputable industry news sources and publications.
Methodology
Step 1 - Identification of Relevant Samples Size from Population Database


Step 2 - Approaches for Defining Global Market Size (Value, Volume* & Price*)

Note*: In applicable scenarios
Step 3 - Data Sources
Primary Research
- Web Analytics
- Survey Reports
- Research Institute
- Latest Research Reports
- Opinion Leaders
Secondary Research
- Annual Reports
- White Paper
- Latest Press Release
- Industry Association
- Paid Database
- Investor Presentations

Step 4 - Data Triangulation
Involves using different sources of information in order to increase the validity of a study
These sources are likely to be stakeholders in a program - participants, other researchers, program staff, other community members, and so on.
Then we put all data in single framework & apply various statistical tools to find out the dynamic on the market.
During the analysis stage, feedback from the stakeholder groups would be compared to determine areas of agreement as well as areas of divergence


