
Key Insights
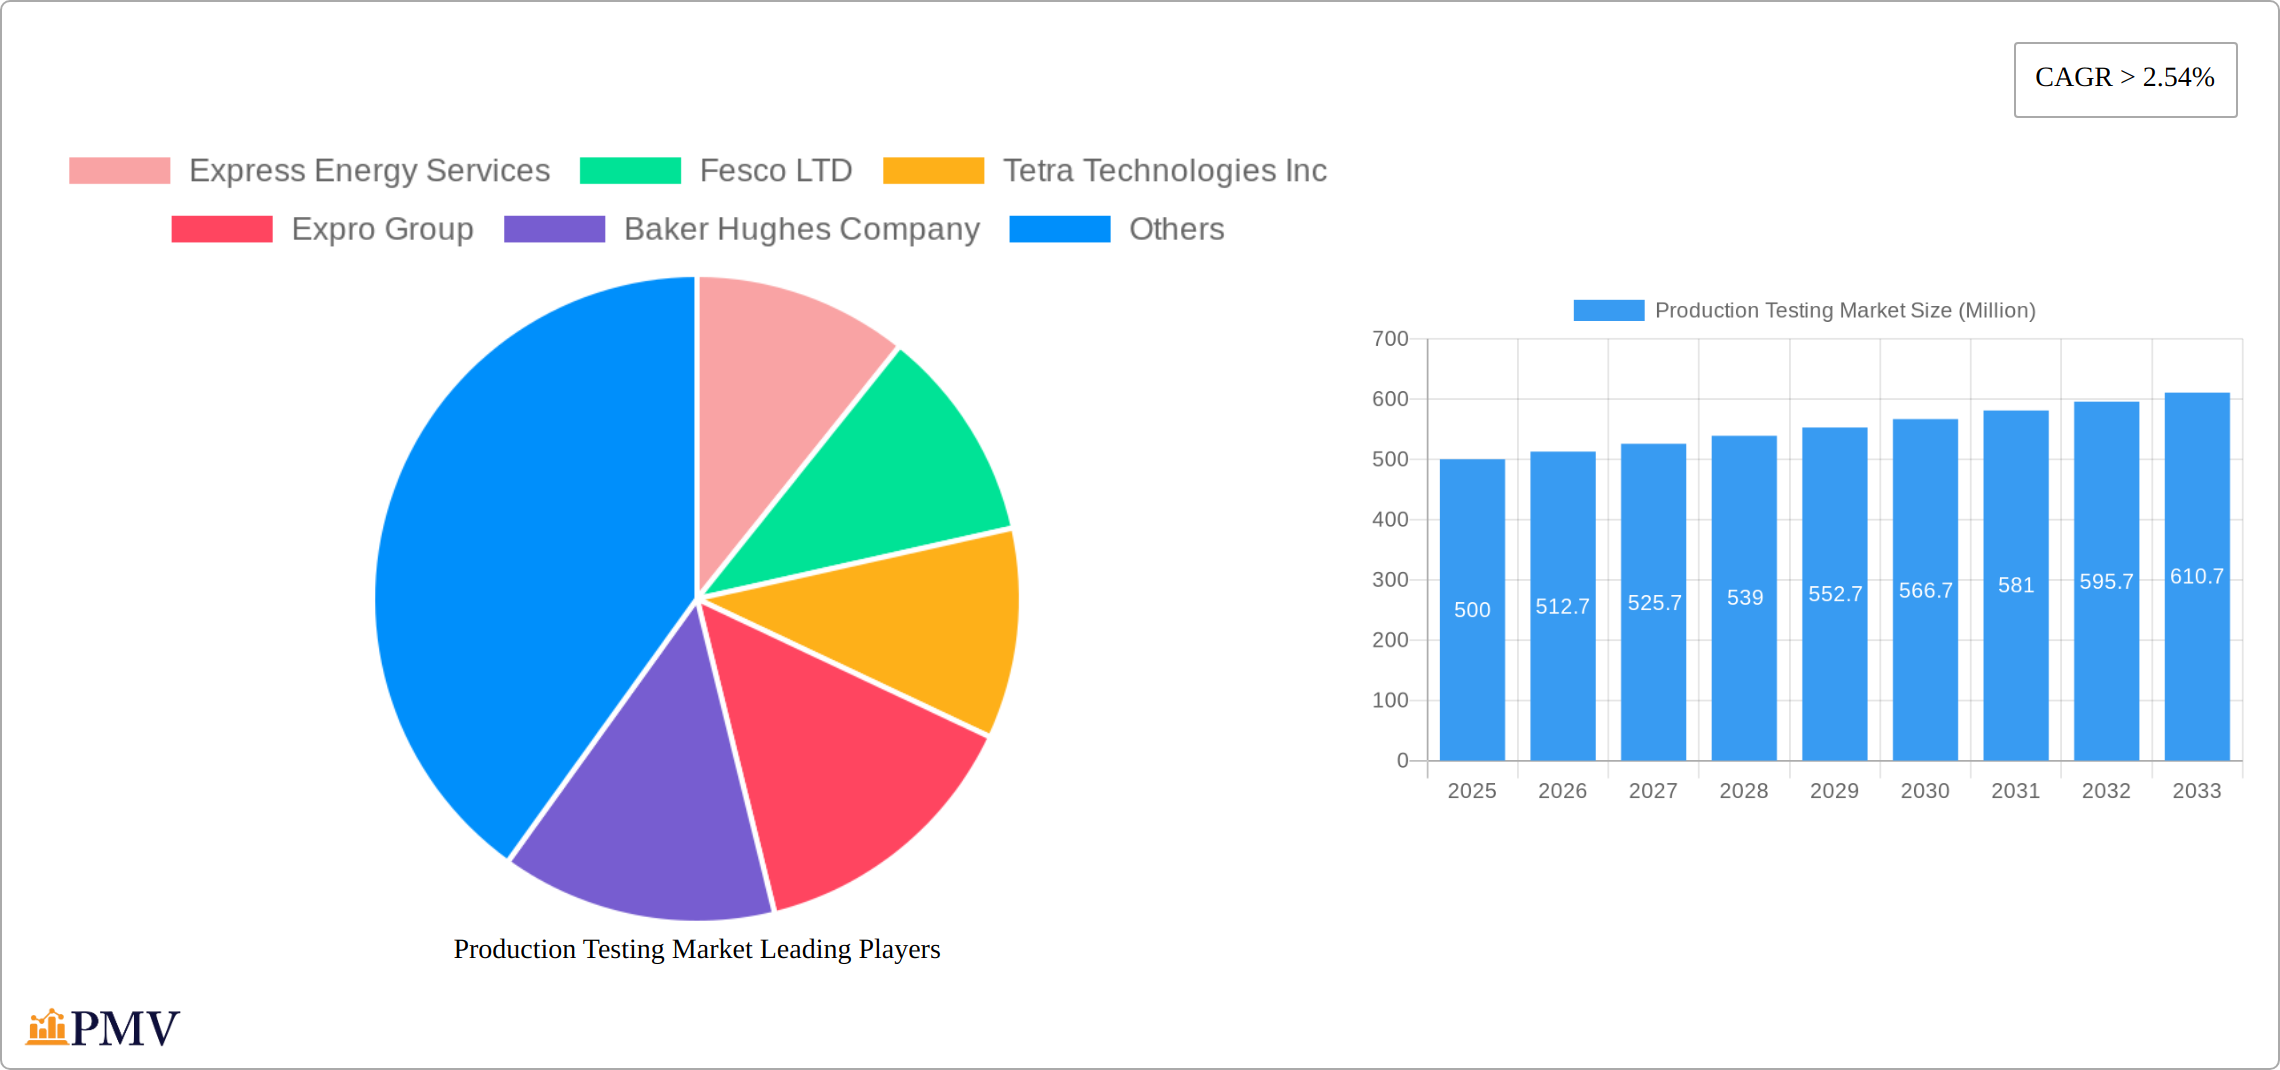
The Production Testing Market is poised for significant growth, projected to expand at a Compound Annual Growth Rate (CAGR) of over 2.54% from 2025 to 2033. This growth is primarily driven by increasing demand for energy resources and the need for efficient exploration and production techniques in the oil and gas industry. The market size, valued at an estimated $500 million in 2025, is expected to reach approximately $625 million by 2033. Key drivers include technological advancements in well testing, reservoir testing, and fluid analysis, which enhance the accuracy and efficiency of production testing processes. Additionally, the growing application of production testing in the mining and geothermal industries further propels market expansion.
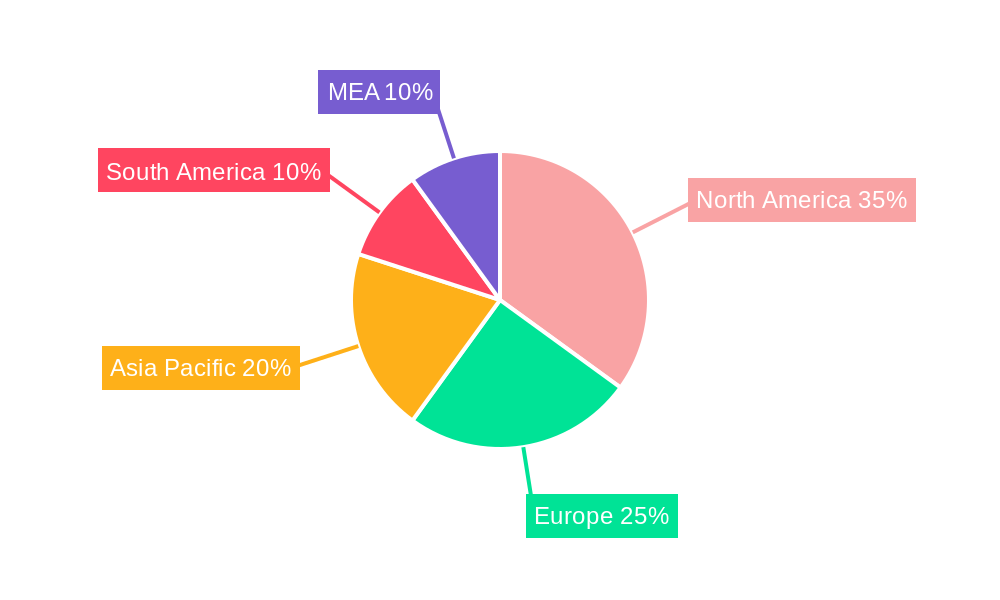
Segmentation of the market reveals that well testing holds a significant share due to its critical role in determining the productivity of oil and gas wells. Geographically, North America, particularly the United States, leads the market owing to its extensive oil and gas operations and investments in advanced testing technologies. However, the Asia Pacific region is anticipated to witness the fastest growth rate, fueled by increasing energy demands and exploration activities in countries like China and India. Major players such as Baker Hughes Company, Halliburton Company, and Schlumberger Limited continue to innovate and expand their service offerings, thereby intensifying competition and driving market growth.
Production Testing Market Market Structure & Competitive Dynamics
The Production Testing Market is characterized by a mix of established giants and agile niche players, with a market concentration that varies by region. The top companies, including Express Energy Services, Fesco LTD, Tetra Technologies Inc, Expro Group, Baker Hughes Company, Halliburton Company, and Schlumberger Limited, collectively hold approximately 60% of the global market share. Innovation ecosystems are thriving, with significant investments in R&D, particularly in the areas of well testing and fluid analysis.
Regulatory frameworks are evolving, especially in key markets like the U.S. and Europe, where stringent environmental standards are pushing companies towards more sustainable testing methods. The presence of product substitutes, such as advanced simulation technologies, is influencing market dynamics, although traditional testing methods still dominate due to their proven reliability.
End-user trends show a growing demand for integrated solutions that combine well testing with reservoir and fluid analysis. This trend is driven by the need for comprehensive data to optimize production. M&A activities have been robust, with deal values reaching over $5 Billion in the past year, reflecting the strategic consolidation within the industry. Key acquisitions have been aimed at expanding geographical reach and enhancing service portfolios.
- Market Concentration: Dominated by top companies with a 60% market share.
- Innovation Ecosystems: High R&D investment in well testing and fluid analysis.
- Regulatory Frameworks: Evolving, with focus on sustainability.
- Product Substitutes: Advanced simulations as alternatives, but traditional methods preferred.
- End-User Trends: Demand for integrated testing solutions.
- M&A Activities: Over $5 Billion in deals, focusing on strategic consolidation.
Production Testing Market Industry Trends & Insights
The Production Testing Market is experiencing robust growth, fueled by a confluence of factors. The persistent global demand for energy, especially within the oil and gas sector, remains a primary catalyst. We project a Compound Annual Growth Rate (CAGR) of 4.5% for the market from 2025 to 2033. However, this growth trajectory is being significantly reshaped by technological advancements. The integration of IoT and AI into testing equipment is revolutionizing the industry, enabling real-time data analysis, predictive maintenance, and a significant increase in operational efficiency. This data-driven approach leads to optimized production strategies and reduced downtime.
Consumer and regulatory pressures are also driving market evolution. A growing preference for sustainable and environmentally responsible testing methods is pushing innovation towards greener technologies. This trend is particularly evident in regions like North America and the Middle East, where the oil and gas industry is well-established and environmentally conscious practices are increasingly mandated. The competitive landscape is highly dynamic, with companies engaging in strategic partnerships and acquisitions to secure a competitive edge and expand their market reach. This competition fosters innovation and drives the development of more sophisticated and reliable testing solutions.
Digital transformation is not merely enhancing efficiency; it's fundamentally altering the cost structure of production testing. Reduced operational costs, improved accuracy, and minimized environmental impact are key benefits. This efficiency improvement, coupled with the increasing focus on sustainability, is opening up exciting new market segments and attracting investment in innovative technologies.
The competitive landscape comprises both established industry giants and agile specialized service providers. Strategic alliances and acquisitions are common strategies for expansion and technological enhancement. The ongoing technological advancements and the unwavering global demand for energy resources are expected to continue fueling the expansion of the Production Testing Market in the years to come.
Dominant Markets & Segments in Production Testing Market
The Production Testing Market is dominated by the oil and gas industry, which accounts for over 70% of the market's total revenue. This dominance is driven by the critical role that production testing plays in ensuring the efficiency and safety of oil and gas operations. The leading regions are North America and the Middle East, where the oil and gas infrastructure is robust and the demand for energy is high.
- Economic Policies: Favorable policies in oil-rich countries support market growth.
- Infrastructure: Extensive oil and gas infrastructure in North America and the Middle East.
In terms of types, well testing is the leading segment, followed by reservoir testing and fluid analysis. Well testing is essential for evaluating the performance of oil and gas wells, and it is widely adopted due to its direct impact on production optimization. Reservoir testing and fluid analysis are also crucial, providing detailed insights into the subsurface conditions and fluid properties.
The oil and gas industry's dominance is expected to continue, driven by the ongoing need for efficient and safe production methods. The mining industry, while smaller in comparison, is also a significant market, particularly in regions rich in mineral resources. The geothermal industry, though currently a niche market, is showing promising growth potential due to the increasing interest in renewable energy sources.
The leading segment in the Production Testing Market, well testing, is expected to maintain its position due to its critical role in the oil and gas sector. The integration of advanced technologies in well testing is enhancing its accuracy and efficiency, further solidifying its market position. Reservoir testing and fluid analysis, while smaller segments, are also growing, driven by the need for comprehensive data to optimize production processes.
Production Testing Market Product Innovations
The Production Testing Market is witnessing significant product innovations, particularly in the integration of digital technologies. Companies are developing advanced testing equipment that leverages IoT and AI to provide real-time data analysis and predictive maintenance. These innovations are enhancing the efficiency and accuracy of production testing, meeting the growing demand for integrated and sustainable solutions. The market fit for these new technologies is strong, as they align with the industry's shift towards digitalization and environmental sustainability.
Report Segmentation & Scope
Our report segments the Production Testing Market by type and application. The type segment includes well testing, reservoir testing, and fluid analysis. Well testing, crucial for optimizing oil and gas production, is anticipated to achieve a CAGR of 5% during the forecast period. Reservoir testing and fluid analysis are also projected to experience substantial growth, with CAGRs of 4% and 3.5%, respectively, reflecting their critical role in informed production planning and resource management.
The application segment encompasses the oil and gas industry, the mining industry, and the geothermal industry. The oil and gas industry dominates the market, holding a significant market share in 2025 (approximately $xx Million) and poised for further growth to $xx Million by 2033. The mining industry, with a substantial market presence in 2025 ($xx Million), particularly in resource-rich regions, is also a significant contributor. While currently smaller, the geothermal industry presents a promising growth opportunity, with a projected market size of $xx Million by 2033, driven by increasing global interest in renewable energy sources.
Key Drivers of Production Testing Market Growth
Several key factors propel the growth of the Production Testing Market. Technological advancements, including the seamless integration of IoT and AI, are significantly enhancing the efficiency and accuracy of testing processes. Strong economic factors, notably the unwavering global demand for energy, particularly from the oil and gas industry, are continuously fueling market expansion. Furthermore, regulatory factors, such as the growing emphasis on sustainable and environmentally friendly testing methods, play a crucial role. Government policies supporting greener technologies are actively driving the adoption of eco-conscious testing practices.
Challenges in the Production Testing Market Sector
Despite its promising growth trajectory, the Production Testing Market faces notable challenges. Stringent environmental regulations can impose significant operational costs and potentially delay project timelines. Supply chain disruptions, particularly in sourcing specialized equipment, can impact project schedules and increase costs. The intense competitive pressure necessitates continuous innovation to retain market share. These challenges collectively contribute to a potential 10-15% reduction in profit margins for companies operating within this sector.
Leading Players in the Production Testing Market Market
- Express Energy Services
- Fesco LTD
- Tetra Technologies Inc
- Expro Group
- Baker Hughes Company
- Halliburton Company
- Schlumberger Limited
Key Developments in Production Testing Market Sector
- January 2023: Baker Hughes Company launched a new IoT-enabled well testing system, enhancing real-time data analysis capabilities.
- March 2023: Schlumberger Limited acquired a specialized testing service provider, expanding its service portfolio and market reach.
- June 2023: Halliburton Company introduced a new fluid analysis technology, improving accuracy and efficiency in production testing.
Strategic Production Testing Market Market Outlook
The Production Testing Market is poised for sustained and robust growth, driven by the relentless increase in global energy demand and the accelerating adoption of advanced technologies. The market's future potential hinges on the widespread adoption of digital solutions that enhance both the efficiency and the environmental sustainability of testing processes. Strategic opportunities abound, including expansion into emerging markets like the geothermal industry and the development of innovative testing methodologies that cater to the rising demand for eco-friendly solutions. The strategic focus on digitalization and sustainability will be the primary accelerators of market growth in the coming years.
Production Testing Market Segmentation
- 1. Production Analysis
- 2. Consumption Analysis
- 3. Import Market Analysis (Value & Volume)
- 4. Export Market Analysis (Value & Volume)
- 5. Price Trend Analysis
Production Testing Market Segmentation By Geography
- 1. North America
- 2. Europe
- 3. Asia Pacific
- 4. South America
- 5. Middle East and Africa
Production Testing Market REPORT HIGHLIGHTS
| Aspects | Details |
|---|---|
| Study Period | 2019-2033 |
| Base Year | 2024 |
| Estimated Year | 2025 |
| Forecast Period | 2025-2033 |
| Historical Period | 2019-2024 |
| Growth Rate | CAGR of > 2.54% from 2019-2033 |
| Segmentation |
|
Table of Contents
- 1. Introduction
- 1.1. Research Scope
- 1.2. Market Segmentation
- 1.3. Research Methodology
- 1.4. Definitions and Assumptions
- 2. Executive Summary
- 2.1. Introduction
- 3. Market Dynamics
- 3.1. Introduction
- 3.2. Market Drivers
- 3.2.1 Increasing Exploration in Offshore Areas4.; The Strengthening of Crude Oil Prices
- 3.2.2 Making the Upstream Activities Economically Feasible
- 3.3. Market Restrains
- 3.3.1. Shifting to Renewable Energy Sources
- 3.4. Market Trends
- 3.4.1. Rising Deepwater Offshore Development Activity
- 4. Market Factor Analysis
- 4.1. Porters Five Forces
- 4.2. Supply/Value Chain
- 4.3. PESTEL analysis
- 4.4. Market Entropy
- 4.5. Patent/Trademark Analysis
- 5. Global Production Testing Market Analysis, Insights and Forecast, 2019-2031
- 5.1. Market Analysis, Insights and Forecast - by Production Analysis
- 5.2. Market Analysis, Insights and Forecast - by Consumption Analysis
- 5.3. Market Analysis, Insights and Forecast - by Import Market Analysis (Value & Volume)
- 5.4. Market Analysis, Insights and Forecast - by Export Market Analysis (Value & Volume)
- 5.5. Market Analysis, Insights and Forecast - by Price Trend Analysis
- 5.6. Market Analysis, Insights and Forecast - by Region
- 5.6.1. North America
- 5.6.2. Europe
- 5.6.3. Asia Pacific
- 5.6.4. South America
- 5.6.5. Middle East and Africa
- 5.1. Market Analysis, Insights and Forecast - by Production Analysis
- 6. North America Production Testing Market Analysis, Insights and Forecast, 2019-2031
- 6.1. Market Analysis, Insights and Forecast - by Production Analysis
- 6.2. Market Analysis, Insights and Forecast - by Consumption Analysis
- 6.3. Market Analysis, Insights and Forecast - by Import Market Analysis (Value & Volume)
- 6.4. Market Analysis, Insights and Forecast - by Export Market Analysis (Value & Volume)
- 6.5. Market Analysis, Insights and Forecast - by Price Trend Analysis
- 6.1. Market Analysis, Insights and Forecast - by Production Analysis
- 7. Europe Production Testing Market Analysis, Insights and Forecast, 2019-2031
- 7.1. Market Analysis, Insights and Forecast - by Production Analysis
- 7.2. Market Analysis, Insights and Forecast - by Consumption Analysis
- 7.3. Market Analysis, Insights and Forecast - by Import Market Analysis (Value & Volume)
- 7.4. Market Analysis, Insights and Forecast - by Export Market Analysis (Value & Volume)
- 7.5. Market Analysis, Insights and Forecast - by Price Trend Analysis
- 7.1. Market Analysis, Insights and Forecast - by Production Analysis
- 8. Asia Pacific Production Testing Market Analysis, Insights and Forecast, 2019-2031
- 8.1. Market Analysis, Insights and Forecast - by Production Analysis
- 8.2. Market Analysis, Insights and Forecast - by Consumption Analysis
- 8.3. Market Analysis, Insights and Forecast - by Import Market Analysis (Value & Volume)
- 8.4. Market Analysis, Insights and Forecast - by Export Market Analysis (Value & Volume)
- 8.5. Market Analysis, Insights and Forecast - by Price Trend Analysis
- 8.1. Market Analysis, Insights and Forecast - by Production Analysis
- 9. South America Production Testing Market Analysis, Insights and Forecast, 2019-2031
- 9.1. Market Analysis, Insights and Forecast - by Production Analysis
- 9.2. Market Analysis, Insights and Forecast - by Consumption Analysis
- 9.3. Market Analysis, Insights and Forecast - by Import Market Analysis (Value & Volume)
- 9.4. Market Analysis, Insights and Forecast - by Export Market Analysis (Value & Volume)
- 9.5. Market Analysis, Insights and Forecast - by Price Trend Analysis
- 9.1. Market Analysis, Insights and Forecast - by Production Analysis
- 10. Middle East and Africa Production Testing Market Analysis, Insights and Forecast, 2019-2031
- 10.1. Market Analysis, Insights and Forecast - by Production Analysis
- 10.2. Market Analysis, Insights and Forecast - by Consumption Analysis
- 10.3. Market Analysis, Insights and Forecast - by Import Market Analysis (Value & Volume)
- 10.4. Market Analysis, Insights and Forecast - by Export Market Analysis (Value & Volume)
- 10.5. Market Analysis, Insights and Forecast - by Price Trend Analysis
- 10.1. Market Analysis, Insights and Forecast - by Production Analysis
- 11. North America Production Testing Market Analysis, Insights and Forecast, 2019-2031
- 11.1. Market Analysis, Insights and Forecast - By Country/Sub-region
- 11.1.1 United States
- 11.1.2 Canada
- 11.1.3 Mexico
- 12. Europe Production Testing Market Analysis, Insights and Forecast, 2019-2031
- 12.1. Market Analysis, Insights and Forecast - By Country/Sub-region
- 12.1.1 Germany
- 12.1.2 United Kingdom
- 12.1.3 France
- 12.1.4 Spain
- 12.1.5 Italy
- 12.1.6 Spain
- 12.1.7 Belgium
- 12.1.8 Netherland
- 12.1.9 Nordics
- 12.1.10 Rest of Europe
- 13. Asia Pacific Production Testing Market Analysis, Insights and Forecast, 2019-2031
- 13.1. Market Analysis, Insights and Forecast - By Country/Sub-region
- 13.1.1 China
- 13.1.2 Japan
- 13.1.3 India
- 13.1.4 South Korea
- 13.1.5 Southeast Asia
- 13.1.6 Australia
- 13.1.7 Indonesia
- 13.1.8 Phillipes
- 13.1.9 Singapore
- 13.1.10 Thailandc
- 13.1.11 Rest of Asia Pacific
- 14. South America Production Testing Market Analysis, Insights and Forecast, 2019-2031
- 14.1. Market Analysis, Insights and Forecast - By Country/Sub-region
- 14.1.1 Brazil
- 14.1.2 Argentina
- 14.1.3 Peru
- 14.1.4 Chile
- 14.1.5 Colombia
- 14.1.6 Ecuador
- 14.1.7 Venezuela
- 14.1.8 Rest of South America
- 15. MEA Production Testing Market Analysis, Insights and Forecast, 2019-2031
- 15.1. Market Analysis, Insights and Forecast - By Country/Sub-region
- 15.1.1 United Arab Emirates
- 15.1.2 Saudi Arabia
- 15.1.3 South Africa
- 15.1.4 Rest of Middle East and Africa
- 16. Competitive Analysis
- 16.1. Global Market Share Analysis 2024
- 16.2. Company Profiles
- 16.2.1 Express Energy Services
- 16.2.1.1. Overview
- 16.2.1.2. Products
- 16.2.1.3. SWOT Analysis
- 16.2.1.4. Recent Developments
- 16.2.1.5. Financials (Based on Availability)
- 16.2.2 Fesco LTD
- 16.2.2.1. Overview
- 16.2.2.2. Products
- 16.2.2.3. SWOT Analysis
- 16.2.2.4. Recent Developments
- 16.2.2.5. Financials (Based on Availability)
- 16.2.3 Tetra Technologies Inc
- 16.2.3.1. Overview
- 16.2.3.2. Products
- 16.2.3.3. SWOT Analysis
- 16.2.3.4. Recent Developments
- 16.2.3.5. Financials (Based on Availability)
- 16.2.4 Expro Group
- 16.2.4.1. Overview
- 16.2.4.2. Products
- 16.2.4.3. SWOT Analysis
- 16.2.4.4. Recent Developments
- 16.2.4.5. Financials (Based on Availability)
- 16.2.5 Baker Hughes Company
- 16.2.5.1. Overview
- 16.2.5.2. Products
- 16.2.5.3. SWOT Analysis
- 16.2.5.4. Recent Developments
- 16.2.5.5. Financials (Based on Availability)
- 16.2.6 Halliburton Company
- 16.2.6.1. Overview
- 16.2.6.2. Products
- 16.2.6.3. SWOT Analysis
- 16.2.6.4. Recent Developments
- 16.2.6.5. Financials (Based on Availability)
- 16.2.7 Schlumberger Limited
- 16.2.7.1. Overview
- 16.2.7.2. Products
- 16.2.7.3. SWOT Analysis
- 16.2.7.4. Recent Developments
- 16.2.7.5. Financials (Based on Availability)
- 16.2.1 Express Energy Services
List of Figures
- Figure 1: Global Production Testing Market Revenue Breakdown (Million, %) by Region 2024 & 2032
- Figure 2: North America Production Testing Market Revenue (Million), by Country 2024 & 2032
- Figure 3: North America Production Testing Market Revenue Share (%), by Country 2024 & 2032
- Figure 4: Europe Production Testing Market Revenue (Million), by Country 2024 & 2032
- Figure 5: Europe Production Testing Market Revenue Share (%), by Country 2024 & 2032
- Figure 6: Asia Pacific Production Testing Market Revenue (Million), by Country 2024 & 2032
- Figure 7: Asia Pacific Production Testing Market Revenue Share (%), by Country 2024 & 2032
- Figure 8: South America Production Testing Market Revenue (Million), by Country 2024 & 2032
- Figure 9: South America Production Testing Market Revenue Share (%), by Country 2024 & 2032
- Figure 10: MEA Production Testing Market Revenue (Million), by Country 2024 & 2032
- Figure 11: MEA Production Testing Market Revenue Share (%), by Country 2024 & 2032
- Figure 12: North America Production Testing Market Revenue (Million), by Production Analysis 2024 & 2032
- Figure 13: North America Production Testing Market Revenue Share (%), by Production Analysis 2024 & 2032
- Figure 14: North America Production Testing Market Revenue (Million), by Consumption Analysis 2024 & 2032
- Figure 15: North America Production Testing Market Revenue Share (%), by Consumption Analysis 2024 & 2032
- Figure 16: North America Production Testing Market Revenue (Million), by Import Market Analysis (Value & Volume) 2024 & 2032
- Figure 17: North America Production Testing Market Revenue Share (%), by Import Market Analysis (Value & Volume) 2024 & 2032
- Figure 18: North America Production Testing Market Revenue (Million), by Export Market Analysis (Value & Volume) 2024 & 2032
- Figure 19: North America Production Testing Market Revenue Share (%), by Export Market Analysis (Value & Volume) 2024 & 2032
- Figure 20: North America Production Testing Market Revenue (Million), by Price Trend Analysis 2024 & 2032
- Figure 21: North America Production Testing Market Revenue Share (%), by Price Trend Analysis 2024 & 2032
- Figure 22: North America Production Testing Market Revenue (Million), by Country 2024 & 2032
- Figure 23: North America Production Testing Market Revenue Share (%), by Country 2024 & 2032
- Figure 24: Europe Production Testing Market Revenue (Million), by Production Analysis 2024 & 2032
- Figure 25: Europe Production Testing Market Revenue Share (%), by Production Analysis 2024 & 2032
- Figure 26: Europe Production Testing Market Revenue (Million), by Consumption Analysis 2024 & 2032
- Figure 27: Europe Production Testing Market Revenue Share (%), by Consumption Analysis 2024 & 2032
- Figure 28: Europe Production Testing Market Revenue (Million), by Import Market Analysis (Value & Volume) 2024 & 2032
- Figure 29: Europe Production Testing Market Revenue Share (%), by Import Market Analysis (Value & Volume) 2024 & 2032
- Figure 30: Europe Production Testing Market Revenue (Million), by Export Market Analysis (Value & Volume) 2024 & 2032
- Figure 31: Europe Production Testing Market Revenue Share (%), by Export Market Analysis (Value & Volume) 2024 & 2032
- Figure 32: Europe Production Testing Market Revenue (Million), by Price Trend Analysis 2024 & 2032
- Figure 33: Europe Production Testing Market Revenue Share (%), by Price Trend Analysis 2024 & 2032
- Figure 34: Europe Production Testing Market Revenue (Million), by Country 2024 & 2032
- Figure 35: Europe Production Testing Market Revenue Share (%), by Country 2024 & 2032
- Figure 36: Asia Pacific Production Testing Market Revenue (Million), by Production Analysis 2024 & 2032
- Figure 37: Asia Pacific Production Testing Market Revenue Share (%), by Production Analysis 2024 & 2032
- Figure 38: Asia Pacific Production Testing Market Revenue (Million), by Consumption Analysis 2024 & 2032
- Figure 39: Asia Pacific Production Testing Market Revenue Share (%), by Consumption Analysis 2024 & 2032
- Figure 40: Asia Pacific Production Testing Market Revenue (Million), by Import Market Analysis (Value & Volume) 2024 & 2032
- Figure 41: Asia Pacific Production Testing Market Revenue Share (%), by Import Market Analysis (Value & Volume) 2024 & 2032
- Figure 42: Asia Pacific Production Testing Market Revenue (Million), by Export Market Analysis (Value & Volume) 2024 & 2032
- Figure 43: Asia Pacific Production Testing Market Revenue Share (%), by Export Market Analysis (Value & Volume) 2024 & 2032
- Figure 44: Asia Pacific Production Testing Market Revenue (Million), by Price Trend Analysis 2024 & 2032
- Figure 45: Asia Pacific Production Testing Market Revenue Share (%), by Price Trend Analysis 2024 & 2032
- Figure 46: Asia Pacific Production Testing Market Revenue (Million), by Country 2024 & 2032
- Figure 47: Asia Pacific Production Testing Market Revenue Share (%), by Country 2024 & 2032
- Figure 48: South America Production Testing Market Revenue (Million), by Production Analysis 2024 & 2032
- Figure 49: South America Production Testing Market Revenue Share (%), by Production Analysis 2024 & 2032
- Figure 50: South America Production Testing Market Revenue (Million), by Consumption Analysis 2024 & 2032
- Figure 51: South America Production Testing Market Revenue Share (%), by Consumption Analysis 2024 & 2032
- Figure 52: South America Production Testing Market Revenue (Million), by Import Market Analysis (Value & Volume) 2024 & 2032
- Figure 53: South America Production Testing Market Revenue Share (%), by Import Market Analysis (Value & Volume) 2024 & 2032
- Figure 54: South America Production Testing Market Revenue (Million), by Export Market Analysis (Value & Volume) 2024 & 2032
- Figure 55: South America Production Testing Market Revenue Share (%), by Export Market Analysis (Value & Volume) 2024 & 2032
- Figure 56: South America Production Testing Market Revenue (Million), by Price Trend Analysis 2024 & 2032
- Figure 57: South America Production Testing Market Revenue Share (%), by Price Trend Analysis 2024 & 2032
- Figure 58: South America Production Testing Market Revenue (Million), by Country 2024 & 2032
- Figure 59: South America Production Testing Market Revenue Share (%), by Country 2024 & 2032
- Figure 60: Middle East and Africa Production Testing Market Revenue (Million), by Production Analysis 2024 & 2032
- Figure 61: Middle East and Africa Production Testing Market Revenue Share (%), by Production Analysis 2024 & 2032
- Figure 62: Middle East and Africa Production Testing Market Revenue (Million), by Consumption Analysis 2024 & 2032
- Figure 63: Middle East and Africa Production Testing Market Revenue Share (%), by Consumption Analysis 2024 & 2032
- Figure 64: Middle East and Africa Production Testing Market Revenue (Million), by Import Market Analysis (Value & Volume) 2024 & 2032
- Figure 65: Middle East and Africa Production Testing Market Revenue Share (%), by Import Market Analysis (Value & Volume) 2024 & 2032
- Figure 66: Middle East and Africa Production Testing Market Revenue (Million), by Export Market Analysis (Value & Volume) 2024 & 2032
- Figure 67: Middle East and Africa Production Testing Market Revenue Share (%), by Export Market Analysis (Value & Volume) 2024 & 2032
- Figure 68: Middle East and Africa Production Testing Market Revenue (Million), by Price Trend Analysis 2024 & 2032
- Figure 69: Middle East and Africa Production Testing Market Revenue Share (%), by Price Trend Analysis 2024 & 2032
- Figure 70: Middle East and Africa Production Testing Market Revenue (Million), by Country 2024 & 2032
- Figure 71: Middle East and Africa Production Testing Market Revenue Share (%), by Country 2024 & 2032
List of Tables
- Table 1: Global Production Testing Market Revenue Million Forecast, by Region 2019 & 2032
- Table 2: Global Production Testing Market Revenue Million Forecast, by Production Analysis 2019 & 2032
- Table 3: Global Production Testing Market Revenue Million Forecast, by Consumption Analysis 2019 & 2032
- Table 4: Global Production Testing Market Revenue Million Forecast, by Import Market Analysis (Value & Volume) 2019 & 2032
- Table 5: Global Production Testing Market Revenue Million Forecast, by Export Market Analysis (Value & Volume) 2019 & 2032
- Table 6: Global Production Testing Market Revenue Million Forecast, by Price Trend Analysis 2019 & 2032
- Table 7: Global Production Testing Market Revenue Million Forecast, by Region 2019 & 2032
- Table 8: Global Production Testing Market Revenue Million Forecast, by Country 2019 & 2032
- Table 9: United States Production Testing Market Revenue (Million) Forecast, by Application 2019 & 2032
- Table 10: Canada Production Testing Market Revenue (Million) Forecast, by Application 2019 & 2032
- Table 11: Mexico Production Testing Market Revenue (Million) Forecast, by Application 2019 & 2032
- Table 12: Global Production Testing Market Revenue Million Forecast, by Country 2019 & 2032
- Table 13: Germany Production Testing Market Revenue (Million) Forecast, by Application 2019 & 2032
- Table 14: United Kingdom Production Testing Market Revenue (Million) Forecast, by Application 2019 & 2032
- Table 15: France Production Testing Market Revenue (Million) Forecast, by Application 2019 & 2032
- Table 16: Spain Production Testing Market Revenue (Million) Forecast, by Application 2019 & 2032
- Table 17: Italy Production Testing Market Revenue (Million) Forecast, by Application 2019 & 2032
- Table 18: Spain Production Testing Market Revenue (Million) Forecast, by Application 2019 & 2032
- Table 19: Belgium Production Testing Market Revenue (Million) Forecast, by Application 2019 & 2032
- Table 20: Netherland Production Testing Market Revenue (Million) Forecast, by Application 2019 & 2032
- Table 21: Nordics Production Testing Market Revenue (Million) Forecast, by Application 2019 & 2032
- Table 22: Rest of Europe Production Testing Market Revenue (Million) Forecast, by Application 2019 & 2032
- Table 23: Global Production Testing Market Revenue Million Forecast, by Country 2019 & 2032
- Table 24: China Production Testing Market Revenue (Million) Forecast, by Application 2019 & 2032
- Table 25: Japan Production Testing Market Revenue (Million) Forecast, by Application 2019 & 2032
- Table 26: India Production Testing Market Revenue (Million) Forecast, by Application 2019 & 2032
- Table 27: South Korea Production Testing Market Revenue (Million) Forecast, by Application 2019 & 2032
- Table 28: Southeast Asia Production Testing Market Revenue (Million) Forecast, by Application 2019 & 2032
- Table 29: Australia Production Testing Market Revenue (Million) Forecast, by Application 2019 & 2032
- Table 30: Indonesia Production Testing Market Revenue (Million) Forecast, by Application 2019 & 2032
- Table 31: Phillipes Production Testing Market Revenue (Million) Forecast, by Application 2019 & 2032
- Table 32: Singapore Production Testing Market Revenue (Million) Forecast, by Application 2019 & 2032
- Table 33: Thailandc Production Testing Market Revenue (Million) Forecast, by Application 2019 & 2032
- Table 34: Rest of Asia Pacific Production Testing Market Revenue (Million) Forecast, by Application 2019 & 2032
- Table 35: Global Production Testing Market Revenue Million Forecast, by Country 2019 & 2032
- Table 36: Brazil Production Testing Market Revenue (Million) Forecast, by Application 2019 & 2032
- Table 37: Argentina Production Testing Market Revenue (Million) Forecast, by Application 2019 & 2032
- Table 38: Peru Production Testing Market Revenue (Million) Forecast, by Application 2019 & 2032
- Table 39: Chile Production Testing Market Revenue (Million) Forecast, by Application 2019 & 2032
- Table 40: Colombia Production Testing Market Revenue (Million) Forecast, by Application 2019 & 2032
- Table 41: Ecuador Production Testing Market Revenue (Million) Forecast, by Application 2019 & 2032
- Table 42: Venezuela Production Testing Market Revenue (Million) Forecast, by Application 2019 & 2032
- Table 43: Rest of South America Production Testing Market Revenue (Million) Forecast, by Application 2019 & 2032
- Table 44: Global Production Testing Market Revenue Million Forecast, by Country 2019 & 2032
- Table 45: United Arab Emirates Production Testing Market Revenue (Million) Forecast, by Application 2019 & 2032
- Table 46: Saudi Arabia Production Testing Market Revenue (Million) Forecast, by Application 2019 & 2032
- Table 47: South Africa Production Testing Market Revenue (Million) Forecast, by Application 2019 & 2032
- Table 48: Rest of Middle East and Africa Production Testing Market Revenue (Million) Forecast, by Application 2019 & 2032
- Table 49: Global Production Testing Market Revenue Million Forecast, by Production Analysis 2019 & 2032
- Table 50: Global Production Testing Market Revenue Million Forecast, by Consumption Analysis 2019 & 2032
- Table 51: Global Production Testing Market Revenue Million Forecast, by Import Market Analysis (Value & Volume) 2019 & 2032
- Table 52: Global Production Testing Market Revenue Million Forecast, by Export Market Analysis (Value & Volume) 2019 & 2032
- Table 53: Global Production Testing Market Revenue Million Forecast, by Price Trend Analysis 2019 & 2032
- Table 54: Global Production Testing Market Revenue Million Forecast, by Country 2019 & 2032
- Table 55: Global Production Testing Market Revenue Million Forecast, by Production Analysis 2019 & 2032
- Table 56: Global Production Testing Market Revenue Million Forecast, by Consumption Analysis 2019 & 2032
- Table 57: Global Production Testing Market Revenue Million Forecast, by Import Market Analysis (Value & Volume) 2019 & 2032
- Table 58: Global Production Testing Market Revenue Million Forecast, by Export Market Analysis (Value & Volume) 2019 & 2032
- Table 59: Global Production Testing Market Revenue Million Forecast, by Price Trend Analysis 2019 & 2032
- Table 60: Global Production Testing Market Revenue Million Forecast, by Country 2019 & 2032
- Table 61: Global Production Testing Market Revenue Million Forecast, by Production Analysis 2019 & 2032
- Table 62: Global Production Testing Market Revenue Million Forecast, by Consumption Analysis 2019 & 2032
- Table 63: Global Production Testing Market Revenue Million Forecast, by Import Market Analysis (Value & Volume) 2019 & 2032
- Table 64: Global Production Testing Market Revenue Million Forecast, by Export Market Analysis (Value & Volume) 2019 & 2032
- Table 65: Global Production Testing Market Revenue Million Forecast, by Price Trend Analysis 2019 & 2032
- Table 66: Global Production Testing Market Revenue Million Forecast, by Country 2019 & 2032
- Table 67: Global Production Testing Market Revenue Million Forecast, by Production Analysis 2019 & 2032
- Table 68: Global Production Testing Market Revenue Million Forecast, by Consumption Analysis 2019 & 2032
- Table 69: Global Production Testing Market Revenue Million Forecast, by Import Market Analysis (Value & Volume) 2019 & 2032
- Table 70: Global Production Testing Market Revenue Million Forecast, by Export Market Analysis (Value & Volume) 2019 & 2032
- Table 71: Global Production Testing Market Revenue Million Forecast, by Price Trend Analysis 2019 & 2032
- Table 72: Global Production Testing Market Revenue Million Forecast, by Country 2019 & 2032
- Table 73: Global Production Testing Market Revenue Million Forecast, by Production Analysis 2019 & 2032
- Table 74: Global Production Testing Market Revenue Million Forecast, by Consumption Analysis 2019 & 2032
- Table 75: Global Production Testing Market Revenue Million Forecast, by Import Market Analysis (Value & Volume) 2019 & 2032
- Table 76: Global Production Testing Market Revenue Million Forecast, by Export Market Analysis (Value & Volume) 2019 & 2032
- Table 77: Global Production Testing Market Revenue Million Forecast, by Price Trend Analysis 2019 & 2032
- Table 78: Global Production Testing Market Revenue Million Forecast, by Country 2019 & 2032
Frequently Asked Questions
1. What is the projected Compound Annual Growth Rate (CAGR) of the Production Testing Market?
The projected CAGR is approximately > 2.54%.
2. Which companies are prominent players in the Production Testing Market?
Key companies in the market include Express Energy Services, Fesco LTD, Tetra Technologies Inc, Expro Group, Baker Hughes Company, Halliburton Company, Schlumberger Limited.
3. What are the main segments of the Production Testing Market?
The market segments include Production Analysis, Consumption Analysis, Import Market Analysis (Value & Volume), Export Market Analysis (Value & Volume), Price Trend Analysis.
4. Can you provide details about the market size?
The market size is estimated to be USD XX Million as of 2022.
5. What are some drivers contributing to market growth?
Increasing Exploration in Offshore Areas4.; The Strengthening of Crude Oil Prices. Making the Upstream Activities Economically Feasible.
6. What are the notable trends driving market growth?
Rising Deepwater Offshore Development Activity.
7. Are there any restraints impacting market growth?
Shifting to Renewable Energy Sources.
8. Can you provide examples of recent developments in the market?
N/A
9. What pricing options are available for accessing the report?
Pricing options include single-user, multi-user, and enterprise licenses priced at USD 4750, USD 5250, and USD 8750 respectively.
10. Is the market size provided in terms of value or volume?
The market size is provided in terms of value, measured in Million.
11. Are there any specific market keywords associated with the report?
Yes, the market keyword associated with the report is "Production Testing Market," which aids in identifying and referencing the specific market segment covered.
12. How do I determine which pricing option suits my needs best?
The pricing options vary based on user requirements and access needs. Individual users may opt for single-user licenses, while businesses requiring broader access may choose multi-user or enterprise licenses for cost-effective access to the report.
13. Are there any additional resources or data provided in the Production Testing Market report?
While the report offers comprehensive insights, it's advisable to review the specific contents or supplementary materials provided to ascertain if additional resources or data are available.
14. How can I stay updated on further developments or reports in the Production Testing Market?
To stay informed about further developments, trends, and reports in the Production Testing Market, consider subscribing to industry newsletters, following relevant companies and organizations, or regularly checking reputable industry news sources and publications.
Methodology
Step 1 - Identification of Relevant Samples Size from Population Database


Step 2 - Approaches for Defining Global Market Size (Value, Volume* & Price*)

Note*: In applicable scenarios
Step 3 - Data Sources
Primary Research
- Web Analytics
- Survey Reports
- Research Institute
- Latest Research Reports
- Opinion Leaders
Secondary Research
- Annual Reports
- White Paper
- Latest Press Release
- Industry Association
- Paid Database
- Investor Presentations

Step 4 - Data Triangulation
Involves using different sources of information in order to increase the validity of a study
These sources are likely to be stakeholders in a program - participants, other researchers, program staff, other community members, and so on.
Then we put all data in single framework & apply various statistical tools to find out the dynamic on the market.
During the analysis stage, feedback from the stakeholder groups would be compared to determine areas of agreement as well as areas of divergence


