
Key Insights
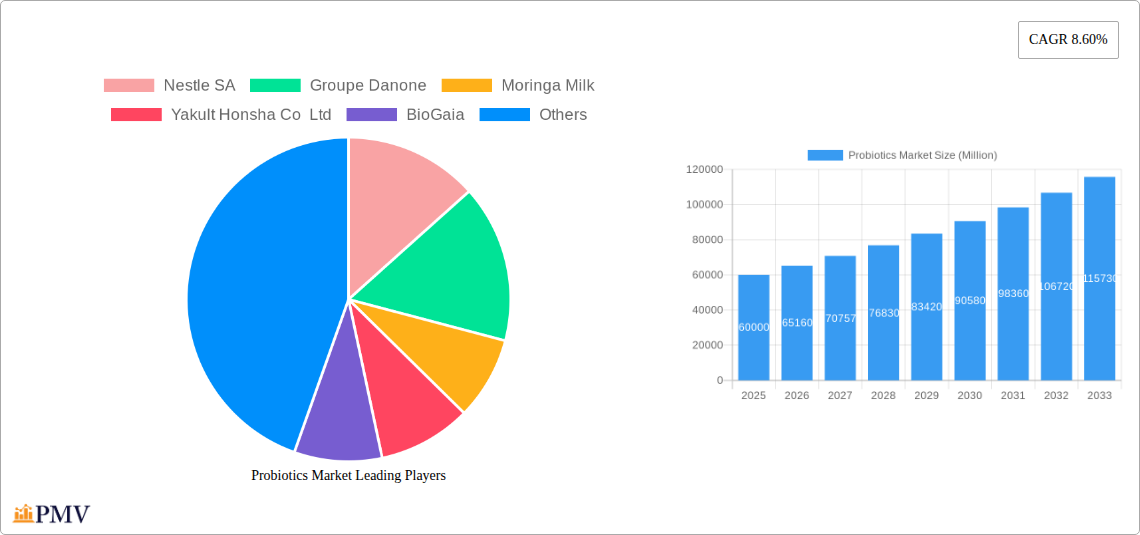
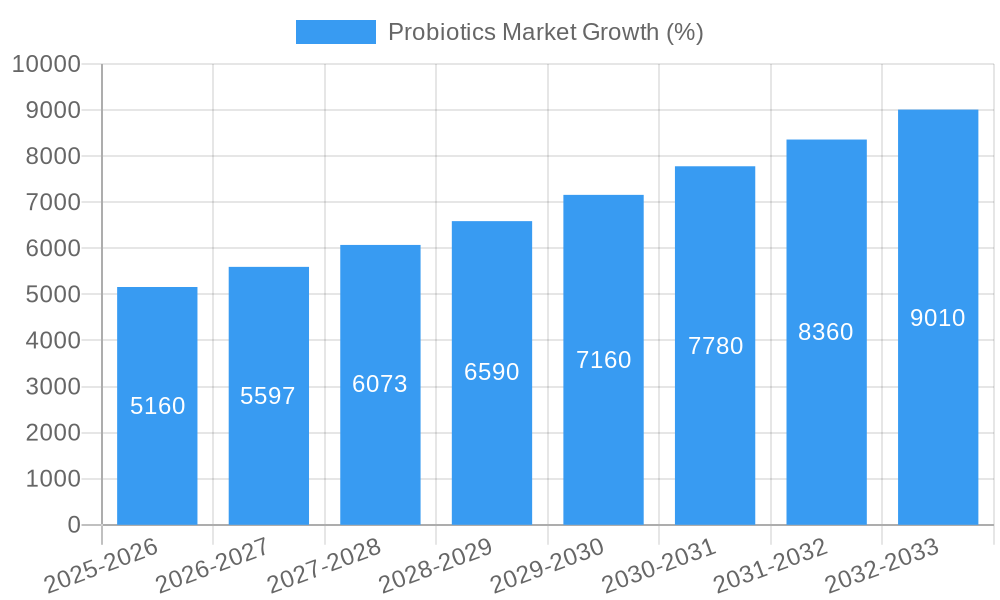
The global probiotics market, valued at approximately $60 billion in 2025, is projected to experience robust growth, exhibiting a compound annual growth rate (CAGR) of 8.60% from 2025 to 2033. This expansion is driven by several key factors. Increasing consumer awareness of gut health and its connection to overall well-being fuels demand for probiotic-rich foods and supplements. The rising prevalence of digestive disorders and the growing adoption of functional foods are significant contributors to market growth. Furthermore, advancements in probiotic research and the development of novel probiotic strains tailored for specific health benefits are propelling market innovation. The market segmentation reveals a strong presence of functional food and beverages, followed by dietary supplements and animal feed, reflecting the diverse applications of probiotics. Distribution channels are primarily supermarkets/hypermarkets and pharmacies/health stores, indicating strong retail penetration. Key players like Nestle SA, Groupe Danone, and Yakult Honsha Co Ltd are leveraging their established market presence and R&D capabilities to capture significant market share. Competition is expected to intensify as smaller players introduce innovative probiotic products and explore niche market segments.
Geographic expansion is a crucial aspect of market growth. While specific regional data for Africa is limited, the emerging markets of Egypt and South Africa are expected to demonstrate significant growth potential due to rising disposable incomes and increased health awareness. This presents opportunities for both established international players and local companies to expand their reach within the region. The forecast period, 2025-2033, suggests continued market expansion driven by the aforementioned factors, with further segmentation opportunities emerging as research progresses and consumer preferences evolve. The market's evolution will likely be shaped by the ongoing development of personalized probiotic solutions and the increasing integration of probiotics into mainstream food and beverage products.
Probiotics Market: A Comprehensive Report (2019-2033)
This comprehensive report provides a detailed analysis of the global probiotics market, offering invaluable insights for businesses, investors, and researchers. The study period covers 2019-2033, with 2025 serving as the base and estimated year. The forecast period spans 2025-2033, and the historical period encompasses 2019-2024. The report meticulously examines market segmentation, competitive dynamics, growth drivers, and challenges, ultimately providing a strategic outlook for the future. The market is valued at xx Million in 2025 and is projected to reach xx Million by 2033, exhibiting a CAGR of xx%.
Probiotics Market Market Structure & Competitive Dynamics
The global probiotics market is characterized by a moderately concentrated structure, with several key players holding significant market share. Nestle SA, Groupe Danone, Yakult Honsha Co Ltd, and BioGaia are among the leading companies, competing intensely on innovation, product diversification, and distribution networks. Market share data reveals that the top 5 players collectively account for approximately xx% of the global market in 2025. The market exhibits a dynamic innovation ecosystem, with continuous development of novel probiotic strains and delivery systems. Regulatory frameworks vary across geographies, influencing product approvals and market access. Existing product substitutes, such as prebiotics and other dietary supplements, pose a competitive challenge. Consumer preferences are shifting towards convenient formats and health-focused products, driving innovation in functional foods and beverages. The market has witnessed several mergers and acquisitions (M&A) activities, with deal values totaling xx Million in the last five years, reflecting a trend towards consolidation and expansion.
- Market Concentration: Top 5 players hold approximately xx% market share in 2025.
- Innovation: Continuous development of new probiotic strains and delivery systems.
- Regulatory Landscape: Varying regulations across different geographies.
- M&A Activity: Deal values totaled approximately xx Million over the past five years.
Probiotics Market Industry Trends & Insights
The global probiotics market is experiencing robust growth, driven by increasing consumer awareness of gut health and the benefits of probiotics. Rising prevalence of gastrointestinal disorders and a growing preference for natural and functional foods are key market drivers. Technological advancements in probiotic strain development and delivery systems, including the introduction of shelf-stable products and advanced fermentation technologies, are further propelling market expansion. The market penetration rate of probiotic products has increased significantly in recent years, particularly in developed regions. However, consumer perception of efficacy and concerns regarding strain viability remain challenges. The competitive landscape is characterized by intense competition among established players and the emergence of new entrants, leading to pricing pressures and product differentiation strategies. The market is projected to exhibit a CAGR of xx% during the forecast period, driven primarily by increasing demand in emerging economies.
Dominant Markets & Segments in Probiotics Market
The Functional Food and Beverage segment dominates the probiotics market by product type, driven by consumer preference for convenient and palatable options. The Dietary Supplement segment is also experiencing significant growth, driven by the increasing demand for targeted health benefits. In terms of distribution channels, Supermarkets/Hypermarkets represent the largest segment, owing to their wide reach and accessibility.
- By Product Type:
- Functional Food and Beverage: Dominated by increasing consumer demand for convenient formats and palatable products. Key drivers include rising disposable incomes and changing lifestyles.
- Dietary Supplements: Strong growth fueled by the increasing demand for targeted health benefits.
- Animal Feed: Market growth driven by the increasing awareness of animal health and productivity benefits.
- By Distribution Channel:
- Supermarkets/Hypermarkets: Holds the largest market share due to their wide distribution network.
- Pharmacies/Health Stores: Growing segment due to increased consumer trust and professional advice.
- Convenience Stores: Smaller market share but experiencing gradual growth.
Probiotics Market Product Innovations
Recent years have witnessed significant advancements in probiotic product innovation, focusing on improved strain viability, enhanced delivery systems (such as shelf-stable sachets and encapsulated formulations), and novel applications across various food and beverage categories. Companies are actively developing probiotics with specific health benefits, targeting specific conditions like gut health, immunity, and even mental well-being. This focus on tailored solutions addresses consumer demand for personalized nutrition and targeted health outcomes. The market is also seeing the emergence of synbiotics (combining probiotics and prebiotics) and postbiotics, which are non-viable microbial components with beneficial health effects.
Report Segmentation & Scope
This report segments the probiotics market by product type (Functional Food and Beverage, Dietary Supplement, Animal Feed) and distribution channel (Supermarkets/Hypermarkets, Pharmacies/Health Stores, Convenience Stores, Others). Each segment is analyzed in detail, providing market size estimates, growth projections, and competitive dynamics. The report also explores regional variations in market trends and provides insights into the competitive landscape of each segment. For example, the Functional Food and Beverage segment is projected to maintain its dominance, with a significant growth rate driven by increasing consumer demand for convenient and health-conscious products.
Key Drivers of Probiotics Market Growth
The probiotics market is driven by several factors: increasing consumer awareness of gut health, rising prevalence of digestive disorders, growing demand for functional foods, technological advancements in probiotic strain development and delivery, and supportive government regulations in certain regions promoting the use of probiotics in various applications.
Challenges in the Probiotics Market Sector
The probiotics market faces challenges including stringent regulatory approvals, maintaining strain viability during storage and transportation, high production costs affecting pricing, and ensuring consumer trust and understanding of the efficacy of different probiotic strains. Competition from established players and emerging brands also puts pressure on profit margins.
Leading Players in the Probiotics Market Market
- Nestle SA
- Groupe Danone
- Moringa Milk
- Yakult Honsha Co Ltd
- BioGaia
- Glac Biotech
- Asahi Holdings
- General Mills
- Nissin Food Products Co Ltd
- Meiji Co
Key Developments in Probiotics Market Sector
- June 2020: Yakult Japan launched shelf-stable probiotic supplement sachets.
- 2021: TCI Japan's Science of Probiotics announced a new patented process for high-efficiency fermentation, resulting in drinks containing 100 billion live probiotics per bottle.
Strategic Probiotics Market Market Outlook
The probiotics market presents significant growth opportunities, particularly in emerging markets with rising disposable incomes and increasing health consciousness. Strategic partnerships, product diversification, and investment in research and development are crucial for success. The development of personalized probiotic solutions targeting specific consumer needs is a key area of focus for future growth. Companies need to address challenges related to product stability, regulatory compliance, and consumer education to fully realize the market's potential.
Probiotics Market Segmentation
-
1. Product Type
- 1.1. Functional Food and Beverage
- 1.2. Dietary Supplement
- 1.3. Animal Feed
-
2. Distribution Channel
- 2.1. Supermarkets/ Hypermarkets
- 2.2. Pharmacies/Health Stores
- 2.3. Convenience Stores
- 2.4. Others
Probiotics Market Segmentation By Geography
-
1. North America
- 1.1. United States
- 1.2. Canada
- 1.3. Mexico
-
2. South America
- 2.1. Brazil
- 2.2. Argentina
- 2.3. Rest of South America
-
3. Europe
- 3.1. United Kingdom
- 3.2. Germany
- 3.3. France
- 3.4. Italy
- 3.5. Spain
- 3.6. Russia
- 3.7. Benelux
- 3.8. Nordics
- 3.9. Rest of Europe
-
4. Middle East & Africa
- 4.1. Turkey
- 4.2. Israel
- 4.3. GCC
- 4.4. North Africa
- 4.5. South Africa
- 4.6. Rest of Middle East & Africa
-
5. Asia Pacific
- 5.1. China
- 5.2. India
- 5.3. Japan
- 5.4. South Korea
- 5.5. ASEAN
- 5.6. Oceania
- 5.7. Rest of Asia Pacific

Probiotics Market REPORT HIGHLIGHTS
| Aspects | Details |
|---|---|
| Study Period | 2019-2033 |
| Base Year | 2024 |
| Estimated Year | 2025 |
| Forecast Period | 2025-2033 |
| Historical Period | 2019-2024 |
| Growth Rate | CAGR of 8.60% from 2019-2033 |
| Segmentation |
|
Table of Contents
- 1. Introduction
- 1.1. Research Scope
- 1.2. Market Segmentation
- 1.3. Research Methodology
- 1.4. Definitions and Assumptions
- 2. Executive Summary
- 2.1. Introduction
- 3. Market Dynamics
- 3.1. Introduction
- 3.2. Market Drivers
- 3.2.1. Wide Applications of Oils and Fats in Different End-Use Industries; Government Initiatives and Key Players Adopting Innovative Market Expansion Strategies
- 3.3. Market Restrains
- 3.3.1. Volatility in Imports and Supply Chain of Oils
- 3.4. Market Trends
- 3.4.1. High Consumption Rate of Probiotics in the Country
- 4. Market Factor Analysis
- 4.1. Porters Five Forces
- 4.2. Supply/Value Chain
- 4.3. PESTEL analysis
- 4.4. Market Entropy
- 4.5. Patent/Trademark Analysis
- 5. Global Probiotics Market Analysis, Insights and Forecast, 2019-2031
- 5.1. Market Analysis, Insights and Forecast - by Product Type
- 5.1.1. Functional Food and Beverage
- 5.1.2. Dietary Supplement
- 5.1.3. Animal Feed
- 5.2. Market Analysis, Insights and Forecast - by Distribution Channel
- 5.2.1. Supermarkets/ Hypermarkets
- 5.2.2. Pharmacies/Health Stores
- 5.2.3. Convenience Stores
- 5.2.4. Others
- 5.3. Market Analysis, Insights and Forecast - by Region
- 5.3.1. North America
- 5.3.2. South America
- 5.3.3. Europe
- 5.3.4. Middle East & Africa
- 5.3.5. Asia Pacific
- 5.1. Market Analysis, Insights and Forecast - by Product Type
- 6. North America Probiotics Market Analysis, Insights and Forecast, 2019-2031
- 6.1. Market Analysis, Insights and Forecast - by Product Type
- 6.1.1. Functional Food and Beverage
- 6.1.2. Dietary Supplement
- 6.1.3. Animal Feed
- 6.2. Market Analysis, Insights and Forecast - by Distribution Channel
- 6.2.1. Supermarkets/ Hypermarkets
- 6.2.2. Pharmacies/Health Stores
- 6.2.3. Convenience Stores
- 6.2.4. Others
- 6.1. Market Analysis, Insights and Forecast - by Product Type
- 7. South America Probiotics Market Analysis, Insights and Forecast, 2019-2031
- 7.1. Market Analysis, Insights and Forecast - by Product Type
- 7.1.1. Functional Food and Beverage
- 7.1.2. Dietary Supplement
- 7.1.3. Animal Feed
- 7.2. Market Analysis, Insights and Forecast - by Distribution Channel
- 7.2.1. Supermarkets/ Hypermarkets
- 7.2.2. Pharmacies/Health Stores
- 7.2.3. Convenience Stores
- 7.2.4. Others
- 7.1. Market Analysis, Insights and Forecast - by Product Type
- 8. Europe Probiotics Market Analysis, Insights and Forecast, 2019-2031
- 8.1. Market Analysis, Insights and Forecast - by Product Type
- 8.1.1. Functional Food and Beverage
- 8.1.2. Dietary Supplement
- 8.1.3. Animal Feed
- 8.2. Market Analysis, Insights and Forecast - by Distribution Channel
- 8.2.1. Supermarkets/ Hypermarkets
- 8.2.2. Pharmacies/Health Stores
- 8.2.3. Convenience Stores
- 8.2.4. Others
- 8.1. Market Analysis, Insights and Forecast - by Product Type
- 9. Middle East & Africa Probiotics Market Analysis, Insights and Forecast, 2019-2031
- 9.1. Market Analysis, Insights and Forecast - by Product Type
- 9.1.1. Functional Food and Beverage
- 9.1.2. Dietary Supplement
- 9.1.3. Animal Feed
- 9.2. Market Analysis, Insights and Forecast - by Distribution Channel
- 9.2.1. Supermarkets/ Hypermarkets
- 9.2.2. Pharmacies/Health Stores
- 9.2.3. Convenience Stores
- 9.2.4. Others
- 9.1. Market Analysis, Insights and Forecast - by Product Type
- 10. Asia Pacific Probiotics Market Analysis, Insights and Forecast, 2019-2031
- 10.1. Market Analysis, Insights and Forecast - by Product Type
- 10.1.1. Functional Food and Beverage
- 10.1.2. Dietary Supplement
- 10.1.3. Animal Feed
- 10.2. Market Analysis, Insights and Forecast - by Distribution Channel
- 10.2.1. Supermarkets/ Hypermarkets
- 10.2.2. Pharmacies/Health Stores
- 10.2.3. Convenience Stores
- 10.2.4. Others
- 10.1. Market Analysis, Insights and Forecast - by Product Type
- 11. Egypt Probiotics Market Analysis, Insights and Forecast, 2019-2031
- 11.1. Market Analysis, Insights and Forecast - By Country/Sub-region
- 11.1.1.
- 12. South Africa Probiotics Market Analysis, Insights and Forecast, 2019-2031
- 12.1. Market Analysis, Insights and Forecast - By Country/Sub-region
- 12.1.1.
- 13. Rest of Africa Probiotics Market Analysis, Insights and Forecast, 2019-2031
- 13.1. Market Analysis, Insights and Forecast - By Country/Sub-region
- 13.1.1.
- 14. Competitive Analysis
- 14.1. Global Market Share Analysis 2024
- 14.2. Company Profiles
- 14.2.1 Nestle SA
- 14.2.1.1. Overview
- 14.2.1.2. Products
- 14.2.1.3. SWOT Analysis
- 14.2.1.4. Recent Developments
- 14.2.1.5. Financials (Based on Availability)
- 14.2.2 Groupe Danone
- 14.2.2.1. Overview
- 14.2.2.2. Products
- 14.2.2.3. SWOT Analysis
- 14.2.2.4. Recent Developments
- 14.2.2.5. Financials (Based on Availability)
- 14.2.3 Moringa Milk
- 14.2.3.1. Overview
- 14.2.3.2. Products
- 14.2.3.3. SWOT Analysis
- 14.2.3.4. Recent Developments
- 14.2.3.5. Financials (Based on Availability)
- 14.2.4 Yakult Honsha Co Ltd
- 14.2.4.1. Overview
- 14.2.4.2. Products
- 14.2.4.3. SWOT Analysis
- 14.2.4.4. Recent Developments
- 14.2.4.5. Financials (Based on Availability)
- 14.2.5 BioGaia
- 14.2.5.1. Overview
- 14.2.5.2. Products
- 14.2.5.3. SWOT Analysis
- 14.2.5.4. Recent Developments
- 14.2.5.5. Financials (Based on Availability)
- 14.2.6 Glac Biotech
- 14.2.6.1. Overview
- 14.2.6.2. Products
- 14.2.6.3. SWOT Analysis
- 14.2.6.4. Recent Developments
- 14.2.6.5. Financials (Based on Availability)
- 14.2.7 Asahi Holdings*List Not Exhaustive
- 14.2.7.1. Overview
- 14.2.7.2. Products
- 14.2.7.3. SWOT Analysis
- 14.2.7.4. Recent Developments
- 14.2.7.5. Financials (Based on Availability)
- 14.2.8 General Mills
- 14.2.8.1. Overview
- 14.2.8.2. Products
- 14.2.8.3. SWOT Analysis
- 14.2.8.4. Recent Developments
- 14.2.8.5. Financials (Based on Availability)
- 14.2.9 Nissin Food Products Co Ltd
- 14.2.9.1. Overview
- 14.2.9.2. Products
- 14.2.9.3. SWOT Analysis
- 14.2.9.4. Recent Developments
- 14.2.9.5. Financials (Based on Availability)
- 14.2.10 Meiji Co
- 14.2.10.1. Overview
- 14.2.10.2. Products
- 14.2.10.3. SWOT Analysis
- 14.2.10.4. Recent Developments
- 14.2.10.5. Financials (Based on Availability)
- 14.2.1 Nestle SA
List of Figures
- Figure 1: Global Probiotics Market Revenue Breakdown (Million, %) by Region 2024 & 2032
- Figure 2: Global Probiotics Market Volume Breakdown (K Tons, %) by Region 2024 & 2032
- Figure 3: Egypt Probiotics Market Revenue (Million), by Country 2024 & 2032
- Figure 4: Egypt Probiotics Market Volume (K Tons), by Country 2024 & 2032
- Figure 5: Egypt Probiotics Market Revenue Share (%), by Country 2024 & 2032
- Figure 6: Egypt Probiotics Market Volume Share (%), by Country 2024 & 2032
- Figure 7: South Africa Probiotics Market Revenue (Million), by Country 2024 & 2032
- Figure 8: South Africa Probiotics Market Volume (K Tons), by Country 2024 & 2032
- Figure 9: South Africa Probiotics Market Revenue Share (%), by Country 2024 & 2032
- Figure 10: South Africa Probiotics Market Volume Share (%), by Country 2024 & 2032
- Figure 11: Rest of Africa Probiotics Market Revenue (Million), by Country 2024 & 2032
- Figure 12: Rest of Africa Probiotics Market Volume (K Tons), by Country 2024 & 2032
- Figure 13: Rest of Africa Probiotics Market Revenue Share (%), by Country 2024 & 2032
- Figure 14: Rest of Africa Probiotics Market Volume Share (%), by Country 2024 & 2032
- Figure 15: North America Probiotics Market Revenue (Million), by Product Type 2024 & 2032
- Figure 16: North America Probiotics Market Volume (K Tons), by Product Type 2024 & 2032
- Figure 17: North America Probiotics Market Revenue Share (%), by Product Type 2024 & 2032
- Figure 18: North America Probiotics Market Volume Share (%), by Product Type 2024 & 2032
- Figure 19: North America Probiotics Market Revenue (Million), by Distribution Channel 2024 & 2032
- Figure 20: North America Probiotics Market Volume (K Tons), by Distribution Channel 2024 & 2032
- Figure 21: North America Probiotics Market Revenue Share (%), by Distribution Channel 2024 & 2032
- Figure 22: North America Probiotics Market Volume Share (%), by Distribution Channel 2024 & 2032
- Figure 23: North America Probiotics Market Revenue (Million), by Country 2024 & 2032
- Figure 24: North America Probiotics Market Volume (K Tons), by Country 2024 & 2032
- Figure 25: North America Probiotics Market Revenue Share (%), by Country 2024 & 2032
- Figure 26: North America Probiotics Market Volume Share (%), by Country 2024 & 2032
- Figure 27: South America Probiotics Market Revenue (Million), by Product Type 2024 & 2032
- Figure 28: South America Probiotics Market Volume (K Tons), by Product Type 2024 & 2032
- Figure 29: South America Probiotics Market Revenue Share (%), by Product Type 2024 & 2032
- Figure 30: South America Probiotics Market Volume Share (%), by Product Type 2024 & 2032
- Figure 31: South America Probiotics Market Revenue (Million), by Distribution Channel 2024 & 2032
- Figure 32: South America Probiotics Market Volume (K Tons), by Distribution Channel 2024 & 2032
- Figure 33: South America Probiotics Market Revenue Share (%), by Distribution Channel 2024 & 2032
- Figure 34: South America Probiotics Market Volume Share (%), by Distribution Channel 2024 & 2032
- Figure 35: South America Probiotics Market Revenue (Million), by Country 2024 & 2032
- Figure 36: South America Probiotics Market Volume (K Tons), by Country 2024 & 2032
- Figure 37: South America Probiotics Market Revenue Share (%), by Country 2024 & 2032
- Figure 38: South America Probiotics Market Volume Share (%), by Country 2024 & 2032
- Figure 39: Europe Probiotics Market Revenue (Million), by Product Type 2024 & 2032
- Figure 40: Europe Probiotics Market Volume (K Tons), by Product Type 2024 & 2032
- Figure 41: Europe Probiotics Market Revenue Share (%), by Product Type 2024 & 2032
- Figure 42: Europe Probiotics Market Volume Share (%), by Product Type 2024 & 2032
- Figure 43: Europe Probiotics Market Revenue (Million), by Distribution Channel 2024 & 2032
- Figure 44: Europe Probiotics Market Volume (K Tons), by Distribution Channel 2024 & 2032
- Figure 45: Europe Probiotics Market Revenue Share (%), by Distribution Channel 2024 & 2032
- Figure 46: Europe Probiotics Market Volume Share (%), by Distribution Channel 2024 & 2032
- Figure 47: Europe Probiotics Market Revenue (Million), by Country 2024 & 2032
- Figure 48: Europe Probiotics Market Volume (K Tons), by Country 2024 & 2032
- Figure 49: Europe Probiotics Market Revenue Share (%), by Country 2024 & 2032
- Figure 50: Europe Probiotics Market Volume Share (%), by Country 2024 & 2032
- Figure 51: Middle East & Africa Probiotics Market Revenue (Million), by Product Type 2024 & 2032
- Figure 52: Middle East & Africa Probiotics Market Volume (K Tons), by Product Type 2024 & 2032
- Figure 53: Middle East & Africa Probiotics Market Revenue Share (%), by Product Type 2024 & 2032
- Figure 54: Middle East & Africa Probiotics Market Volume Share (%), by Product Type 2024 & 2032
- Figure 55: Middle East & Africa Probiotics Market Revenue (Million), by Distribution Channel 2024 & 2032
- Figure 56: Middle East & Africa Probiotics Market Volume (K Tons), by Distribution Channel 2024 & 2032
- Figure 57: Middle East & Africa Probiotics Market Revenue Share (%), by Distribution Channel 2024 & 2032
- Figure 58: Middle East & Africa Probiotics Market Volume Share (%), by Distribution Channel 2024 & 2032
- Figure 59: Middle East & Africa Probiotics Market Revenue (Million), by Country 2024 & 2032
- Figure 60: Middle East & Africa Probiotics Market Volume (K Tons), by Country 2024 & 2032
- Figure 61: Middle East & Africa Probiotics Market Revenue Share (%), by Country 2024 & 2032
- Figure 62: Middle East & Africa Probiotics Market Volume Share (%), by Country 2024 & 2032
- Figure 63: Asia Pacific Probiotics Market Revenue (Million), by Product Type 2024 & 2032
- Figure 64: Asia Pacific Probiotics Market Volume (K Tons), by Product Type 2024 & 2032
- Figure 65: Asia Pacific Probiotics Market Revenue Share (%), by Product Type 2024 & 2032
- Figure 66: Asia Pacific Probiotics Market Volume Share (%), by Product Type 2024 & 2032
- Figure 67: Asia Pacific Probiotics Market Revenue (Million), by Distribution Channel 2024 & 2032
- Figure 68: Asia Pacific Probiotics Market Volume (K Tons), by Distribution Channel 2024 & 2032
- Figure 69: Asia Pacific Probiotics Market Revenue Share (%), by Distribution Channel 2024 & 2032
- Figure 70: Asia Pacific Probiotics Market Volume Share (%), by Distribution Channel 2024 & 2032
- Figure 71: Asia Pacific Probiotics Market Revenue (Million), by Country 2024 & 2032
- Figure 72: Asia Pacific Probiotics Market Volume (K Tons), by Country 2024 & 2032
- Figure 73: Asia Pacific Probiotics Market Revenue Share (%), by Country 2024 & 2032
- Figure 74: Asia Pacific Probiotics Market Volume Share (%), by Country 2024 & 2032
List of Tables
- Table 1: Global Probiotics Market Revenue Million Forecast, by Region 2019 & 2032
- Table 2: Global Probiotics Market Volume K Tons Forecast, by Region 2019 & 2032
- Table 3: Global Probiotics Market Revenue Million Forecast, by Product Type 2019 & 2032
- Table 4: Global Probiotics Market Volume K Tons Forecast, by Product Type 2019 & 2032
- Table 5: Global Probiotics Market Revenue Million Forecast, by Distribution Channel 2019 & 2032
- Table 6: Global Probiotics Market Volume K Tons Forecast, by Distribution Channel 2019 & 2032
- Table 7: Global Probiotics Market Revenue Million Forecast, by Region 2019 & 2032
- Table 8: Global Probiotics Market Volume K Tons Forecast, by Region 2019 & 2032
- Table 9: Global Probiotics Market Revenue Million Forecast, by Country 2019 & 2032
- Table 10: Global Probiotics Market Volume K Tons Forecast, by Country 2019 & 2032
- Table 11: Probiotics Market Revenue (Million) Forecast, by Application 2019 & 2032
- Table 12: Probiotics Market Volume (K Tons) Forecast, by Application 2019 & 2032
- Table 13: Global Probiotics Market Revenue Million Forecast, by Country 2019 & 2032
- Table 14: Global Probiotics Market Volume K Tons Forecast, by Country 2019 & 2032
- Table 15: Probiotics Market Revenue (Million) Forecast, by Application 2019 & 2032
- Table 16: Probiotics Market Volume (K Tons) Forecast, by Application 2019 & 2032
- Table 17: Global Probiotics Market Revenue Million Forecast, by Country 2019 & 2032
- Table 18: Global Probiotics Market Volume K Tons Forecast, by Country 2019 & 2032
- Table 19: Probiotics Market Revenue (Million) Forecast, by Application 2019 & 2032
- Table 20: Probiotics Market Volume (K Tons) Forecast, by Application 2019 & 2032
- Table 21: Global Probiotics Market Revenue Million Forecast, by Product Type 2019 & 2032
- Table 22: Global Probiotics Market Volume K Tons Forecast, by Product Type 2019 & 2032
- Table 23: Global Probiotics Market Revenue Million Forecast, by Distribution Channel 2019 & 2032
- Table 24: Global Probiotics Market Volume K Tons Forecast, by Distribution Channel 2019 & 2032
- Table 25: Global Probiotics Market Revenue Million Forecast, by Country 2019 & 2032
- Table 26: Global Probiotics Market Volume K Tons Forecast, by Country 2019 & 2032
- Table 27: United States Probiotics Market Revenue (Million) Forecast, by Application 2019 & 2032
- Table 28: United States Probiotics Market Volume (K Tons) Forecast, by Application 2019 & 2032
- Table 29: Canada Probiotics Market Revenue (Million) Forecast, by Application 2019 & 2032
- Table 30: Canada Probiotics Market Volume (K Tons) Forecast, by Application 2019 & 2032
- Table 31: Mexico Probiotics Market Revenue (Million) Forecast, by Application 2019 & 2032
- Table 32: Mexico Probiotics Market Volume (K Tons) Forecast, by Application 2019 & 2032
- Table 33: Global Probiotics Market Revenue Million Forecast, by Product Type 2019 & 2032
- Table 34: Global Probiotics Market Volume K Tons Forecast, by Product Type 2019 & 2032
- Table 35: Global Probiotics Market Revenue Million Forecast, by Distribution Channel 2019 & 2032
- Table 36: Global Probiotics Market Volume K Tons Forecast, by Distribution Channel 2019 & 2032
- Table 37: Global Probiotics Market Revenue Million Forecast, by Country 2019 & 2032
- Table 38: Global Probiotics Market Volume K Tons Forecast, by Country 2019 & 2032
- Table 39: Brazil Probiotics Market Revenue (Million) Forecast, by Application 2019 & 2032
- Table 40: Brazil Probiotics Market Volume (K Tons) Forecast, by Application 2019 & 2032
- Table 41: Argentina Probiotics Market Revenue (Million) Forecast, by Application 2019 & 2032
- Table 42: Argentina Probiotics Market Volume (K Tons) Forecast, by Application 2019 & 2032
- Table 43: Rest of South America Probiotics Market Revenue (Million) Forecast, by Application 2019 & 2032
- Table 44: Rest of South America Probiotics Market Volume (K Tons) Forecast, by Application 2019 & 2032
- Table 45: Global Probiotics Market Revenue Million Forecast, by Product Type 2019 & 2032
- Table 46: Global Probiotics Market Volume K Tons Forecast, by Product Type 2019 & 2032
- Table 47: Global Probiotics Market Revenue Million Forecast, by Distribution Channel 2019 & 2032
- Table 48: Global Probiotics Market Volume K Tons Forecast, by Distribution Channel 2019 & 2032
- Table 49: Global Probiotics Market Revenue Million Forecast, by Country 2019 & 2032
- Table 50: Global Probiotics Market Volume K Tons Forecast, by Country 2019 & 2032
- Table 51: United Kingdom Probiotics Market Revenue (Million) Forecast, by Application 2019 & 2032
- Table 52: United Kingdom Probiotics Market Volume (K Tons) Forecast, by Application 2019 & 2032
- Table 53: Germany Probiotics Market Revenue (Million) Forecast, by Application 2019 & 2032
- Table 54: Germany Probiotics Market Volume (K Tons) Forecast, by Application 2019 & 2032
- Table 55: France Probiotics Market Revenue (Million) Forecast, by Application 2019 & 2032
- Table 56: France Probiotics Market Volume (K Tons) Forecast, by Application 2019 & 2032
- Table 57: Italy Probiotics Market Revenue (Million) Forecast, by Application 2019 & 2032
- Table 58: Italy Probiotics Market Volume (K Tons) Forecast, by Application 2019 & 2032
- Table 59: Spain Probiotics Market Revenue (Million) Forecast, by Application 2019 & 2032
- Table 60: Spain Probiotics Market Volume (K Tons) Forecast, by Application 2019 & 2032
- Table 61: Russia Probiotics Market Revenue (Million) Forecast, by Application 2019 & 2032
- Table 62: Russia Probiotics Market Volume (K Tons) Forecast, by Application 2019 & 2032
- Table 63: Benelux Probiotics Market Revenue (Million) Forecast, by Application 2019 & 2032
- Table 64: Benelux Probiotics Market Volume (K Tons) Forecast, by Application 2019 & 2032
- Table 65: Nordics Probiotics Market Revenue (Million) Forecast, by Application 2019 & 2032
- Table 66: Nordics Probiotics Market Volume (K Tons) Forecast, by Application 2019 & 2032
- Table 67: Rest of Europe Probiotics Market Revenue (Million) Forecast, by Application 2019 & 2032
- Table 68: Rest of Europe Probiotics Market Volume (K Tons) Forecast, by Application 2019 & 2032
- Table 69: Global Probiotics Market Revenue Million Forecast, by Product Type 2019 & 2032
- Table 70: Global Probiotics Market Volume K Tons Forecast, by Product Type 2019 & 2032
- Table 71: Global Probiotics Market Revenue Million Forecast, by Distribution Channel 2019 & 2032
- Table 72: Global Probiotics Market Volume K Tons Forecast, by Distribution Channel 2019 & 2032
- Table 73: Global Probiotics Market Revenue Million Forecast, by Country 2019 & 2032
- Table 74: Global Probiotics Market Volume K Tons Forecast, by Country 2019 & 2032
- Table 75: Turkey Probiotics Market Revenue (Million) Forecast, by Application 2019 & 2032
- Table 76: Turkey Probiotics Market Volume (K Tons) Forecast, by Application 2019 & 2032
- Table 77: Israel Probiotics Market Revenue (Million) Forecast, by Application 2019 & 2032
- Table 78: Israel Probiotics Market Volume (K Tons) Forecast, by Application 2019 & 2032
- Table 79: GCC Probiotics Market Revenue (Million) Forecast, by Application 2019 & 2032
- Table 80: GCC Probiotics Market Volume (K Tons) Forecast, by Application 2019 & 2032
- Table 81: North Africa Probiotics Market Revenue (Million) Forecast, by Application 2019 & 2032
- Table 82: North Africa Probiotics Market Volume (K Tons) Forecast, by Application 2019 & 2032
- Table 83: South Africa Probiotics Market Revenue (Million) Forecast, by Application 2019 & 2032
- Table 84: South Africa Probiotics Market Volume (K Tons) Forecast, by Application 2019 & 2032
- Table 85: Rest of Middle East & Africa Probiotics Market Revenue (Million) Forecast, by Application 2019 & 2032
- Table 86: Rest of Middle East & Africa Probiotics Market Volume (K Tons) Forecast, by Application 2019 & 2032
- Table 87: Global Probiotics Market Revenue Million Forecast, by Product Type 2019 & 2032
- Table 88: Global Probiotics Market Volume K Tons Forecast, by Product Type 2019 & 2032
- Table 89: Global Probiotics Market Revenue Million Forecast, by Distribution Channel 2019 & 2032
- Table 90: Global Probiotics Market Volume K Tons Forecast, by Distribution Channel 2019 & 2032
- Table 91: Global Probiotics Market Revenue Million Forecast, by Country 2019 & 2032
- Table 92: Global Probiotics Market Volume K Tons Forecast, by Country 2019 & 2032
- Table 93: China Probiotics Market Revenue (Million) Forecast, by Application 2019 & 2032
- Table 94: China Probiotics Market Volume (K Tons) Forecast, by Application 2019 & 2032
- Table 95: India Probiotics Market Revenue (Million) Forecast, by Application 2019 & 2032
- Table 96: India Probiotics Market Volume (K Tons) Forecast, by Application 2019 & 2032
- Table 97: Japan Probiotics Market Revenue (Million) Forecast, by Application 2019 & 2032
- Table 98: Japan Probiotics Market Volume (K Tons) Forecast, by Application 2019 & 2032
- Table 99: South Korea Probiotics Market Revenue (Million) Forecast, by Application 2019 & 2032
- Table 100: South Korea Probiotics Market Volume (K Tons) Forecast, by Application 2019 & 2032
- Table 101: ASEAN Probiotics Market Revenue (Million) Forecast, by Application 2019 & 2032
- Table 102: ASEAN Probiotics Market Volume (K Tons) Forecast, by Application 2019 & 2032
- Table 103: Oceania Probiotics Market Revenue (Million) Forecast, by Application 2019 & 2032
- Table 104: Oceania Probiotics Market Volume (K Tons) Forecast, by Application 2019 & 2032
- Table 105: Rest of Asia Pacific Probiotics Market Revenue (Million) Forecast, by Application 2019 & 2032
- Table 106: Rest of Asia Pacific Probiotics Market Volume (K Tons) Forecast, by Application 2019 & 2032
Frequently Asked Questions
1. What is the projected Compound Annual Growth Rate (CAGR) of the Probiotics Market?
The projected CAGR is approximately 8.60%.
2. Which companies are prominent players in the Probiotics Market?
Key companies in the market include Nestle SA, Groupe Danone, Moringa Milk, Yakult Honsha Co Ltd, BioGaia, Glac Biotech, Asahi Holdings*List Not Exhaustive, General Mills, Nissin Food Products Co Ltd, Meiji Co.
3. What are the main segments of the Probiotics Market?
The market segments include Product Type, Distribution Channel.
4. Can you provide details about the market size?
The market size is estimated to be USD XX Million as of 2022.
5. What are some drivers contributing to market growth?
Wide Applications of Oils and Fats in Different End-Use Industries; Government Initiatives and Key Players Adopting Innovative Market Expansion Strategies.
6. What are the notable trends driving market growth?
High Consumption Rate of Probiotics in the Country.
7. Are there any restraints impacting market growth?
Volatility in Imports and Supply Chain of Oils.
8. Can you provide examples of recent developments in the market?
In June 2020, Yakult Japan launched its first shelf-stable probiotic supplement sachets to improve consumer convenience. The powder form of the sachets contains Lactic Acid Bacteria and Bifidobacteria probiotic strains.
9. What pricing options are available for accessing the report?
Pricing options include single-user, multi-user, and enterprise licenses priced at USD 3800, USD 4500, and USD 5800 respectively.
10. Is the market size provided in terms of value or volume?
The market size is provided in terms of value, measured in Million and volume, measured in K Tons.
11. Are there any specific market keywords associated with the report?
Yes, the market keyword associated with the report is "Probiotics Market," which aids in identifying and referencing the specific market segment covered.
12. How do I determine which pricing option suits my needs best?
The pricing options vary based on user requirements and access needs. Individual users may opt for single-user licenses, while businesses requiring broader access may choose multi-user or enterprise licenses for cost-effective access to the report.
13. Are there any additional resources or data provided in the Probiotics Market report?
While the report offers comprehensive insights, it's advisable to review the specific contents or supplementary materials provided to ascertain if additional resources or data are available.
14. How can I stay updated on further developments or reports in the Probiotics Market?
To stay informed about further developments, trends, and reports in the Probiotics Market, consider subscribing to industry newsletters, following relevant companies and organizations, or regularly checking reputable industry news sources and publications.
Methodology
Step 1 - Identification of Relevant Samples Size from Population Database


Step 2 - Approaches for Defining Global Market Size (Value, Volume* & Price*)

Note*: In applicable scenarios
Step 3 - Data Sources
Primary Research
- Web Analytics
- Survey Reports
- Research Institute
- Latest Research Reports
- Opinion Leaders
Secondary Research
- Annual Reports
- White Paper
- Latest Press Release
- Industry Association
- Paid Database
- Investor Presentations

Step 4 - Data Triangulation
Involves using different sources of information in order to increase the validity of a study
These sources are likely to be stakeholders in a program - participants, other researchers, program staff, other community members, and so on.
Then we put all data in single framework & apply various statistical tools to find out the dynamic on the market.
During the analysis stage, feedback from the stakeholder groups would be compared to determine areas of agreement as well as areas of divergence


