
Key Insights
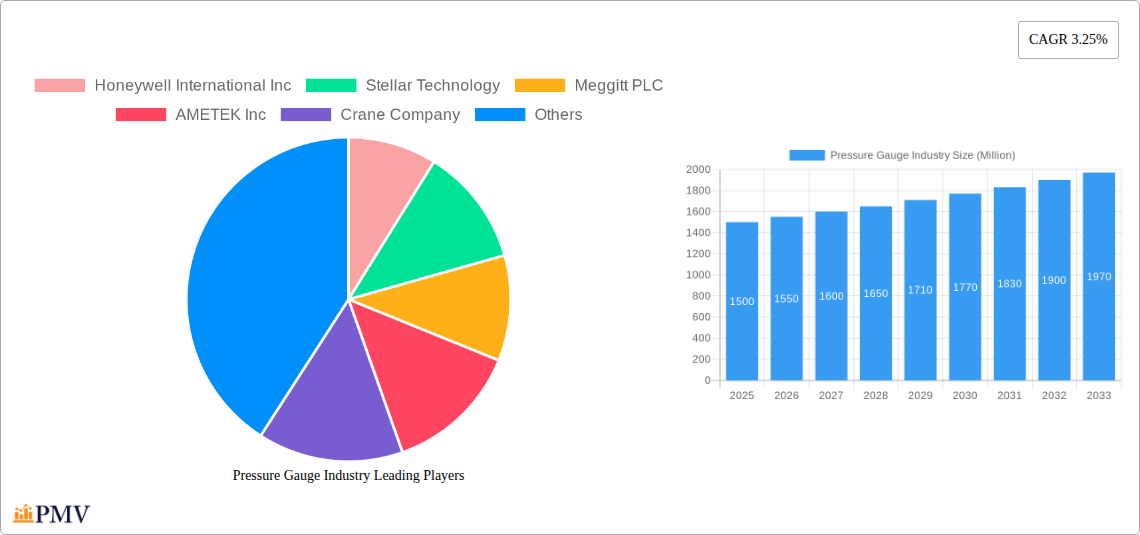
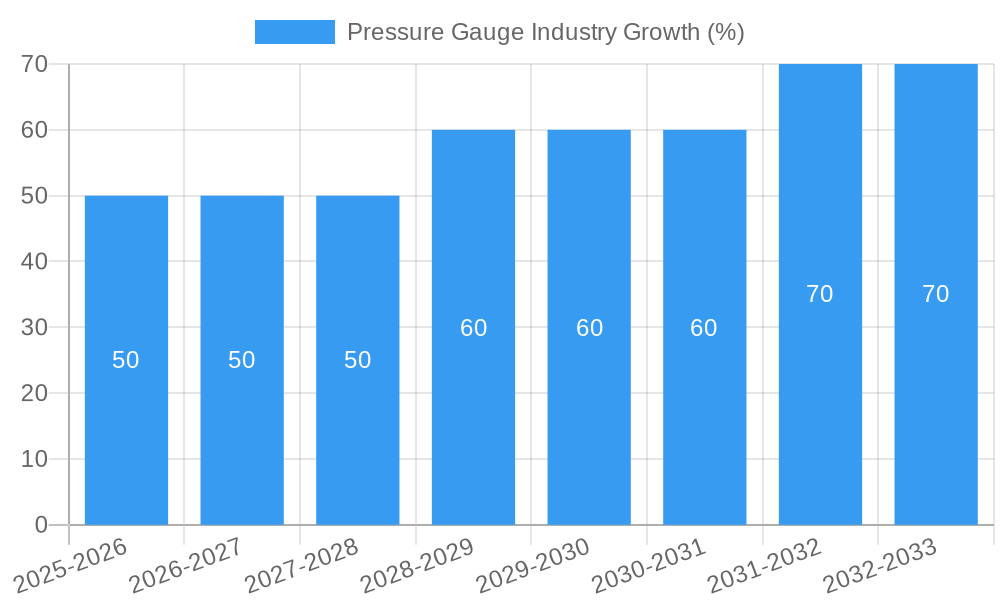
The pressure gauge market, valued at approximately $XX million in 2025, is projected to experience steady growth, driven by increasing industrial automation across diverse sectors. A compound annual growth rate (CAGR) of 3.25% from 2025 to 2033 indicates a robust market outlook, fueled by the burgeoning demand for precise pressure measurement in applications like aerospace and defense, automotive manufacturing, and healthcare. The digital pressure gauge segment is poised for significant expansion due to its enhanced accuracy, data logging capabilities, and integration with smart systems. Expanding industrial infrastructure, particularly in developing economies within the Asia-Pacific region, is expected to contribute substantially to market growth. However, the market faces challenges, including the high initial investment costs associated with advanced digital gauges and the potential for obsolescence due to rapid technological advancements. Furthermore, stringent safety and regulatory compliance requirements in certain sectors, such as aerospace, may also impede rapid market penetration. Despite these constraints, the long-term forecast remains positive, with consistent growth anticipated across all major regions, including North America, Europe, and Asia-Pacific. The increasing adoption of Industry 4.0 principles and the growing need for efficient process monitoring across various industries should further drive demand for sophisticated pressure gauges in the coming years. Competitive landscape analysis indicates the presence of both established players and emerging technology providers, leading to a dynamic and innovative marketplace.
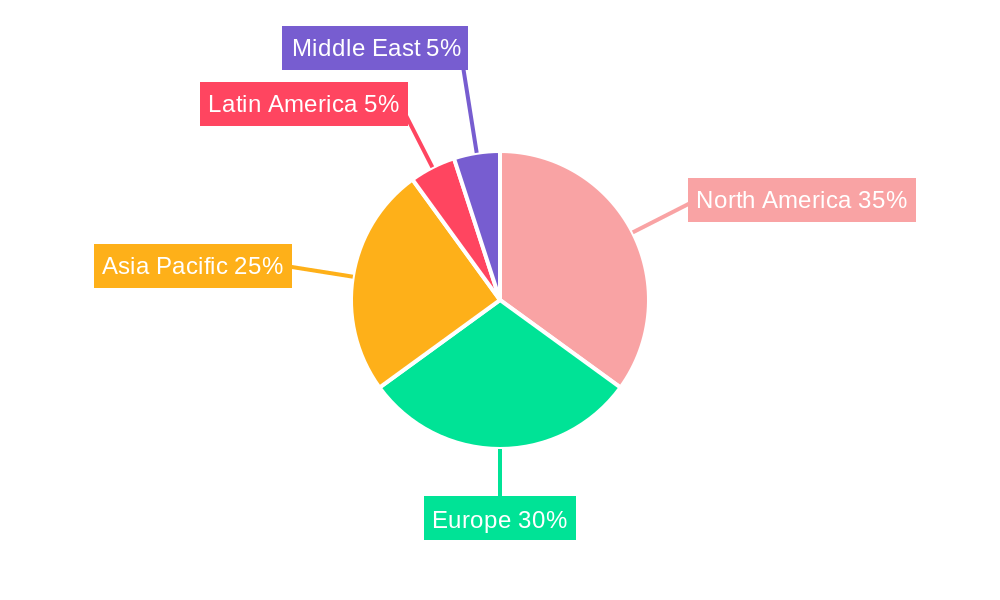
The market segmentation reveals a strong preference for digital pressure gauges over analog counterparts, owing to their improved precision and ease of integration with automated systems. The aerospace and defense sector, known for its stringent safety and quality standards, currently represents a significant portion of the market, with consistent demand for highly reliable pressure measurement devices. However, the automotive and healthcare sectors are also demonstrating substantial growth potential due to the increasing adoption of advanced pressure sensing technologies in vehicle safety systems and medical equipment, respectively. The energy sector, with its focus on process optimization and safety, is another key market driver. Regional analysis suggests a notable concentration of market share in North America and Europe, attributable to the presence of established industrial bases and strong regulatory frameworks. However, the Asia-Pacific region is expected to witness the fastest growth rate due to rapid industrialization and significant investments in infrastructure development. This presents lucrative opportunities for both established market players and emerging companies.
Pressure Gauge Industry Market Report: 2019-2033
This comprehensive report provides an in-depth analysis of the global pressure gauge industry, covering market size, segmentation, competitive landscape, and future growth prospects from 2019 to 2033. The study period spans from 2019 to 2033, with 2025 serving as both the base and estimated year. The forecast period extends from 2025 to 2033, encompassing historical data from 2019 to 2024. The report offers actionable insights for industry stakeholders, including manufacturers, distributors, and investors. The market is valued at xx Million in 2025 and is projected to reach xx Million by 2033, exhibiting a CAGR of xx%.
Pressure Gauge Industry Market Structure & Competitive Dynamics
The pressure gauge industry is characterized by a moderately concentrated market structure, with several major players holding significant market share. Honeywell International Inc, Honeywell, AMETEK Inc, AMETEK, Emerson Electric Co, Emerson, and Crane Company hold a combined market share of approximately xx%, reflecting a degree of oligopolistic competition. The industry's innovation ecosystem is driven by continuous advancements in sensor technology, digitalization, and wireless communication. Regulatory frameworks, such as those related to safety and accuracy standards, significantly impact the industry. Product substitutes, such as digital pressure sensors and smart instruments, are posing increasing competition. End-user trends towards automation, increased precision, and remote monitoring are shaping product development strategies.
Significant M&A activities have been observed in recent years. For instance, in 2022, the market witnessed consolidation, with an estimated xx Million in M&A deal values. This consolidation is expected to continue as larger companies seek to expand their product portfolios and market reach. Specific M&A deals included (but not limited to): xx. This activity showcases the continuous quest for market dominance and technological advancement within the sector.
Pressure Gauge Industry Industry Trends & Insights
The pressure gauge industry is experiencing significant growth, propelled by increasing demand across various end-use sectors. The global market is witnessing robust growth, primarily driven by the expanding industrial automation, rising adoption of advanced sensors and smart technologies, and increasing demand from various industries including energy, automotive, and healthcare. The rising adoption of Industry 4.0 technologies is fostering the integration of pressure gauges into smart manufacturing and industrial internet of things (IIoT) applications. Technological advancements such as the development of wireless, compact, and highly accurate pressure gauges are also driving market expansion. Consumer preferences are shifting towards more reliable, user-friendly, and cost-effective pressure gauges with enhanced functionalities. This trend is pushing manufacturers to innovate and develop new pressure gauge solutions that meet these demands. The increasing adoption of digital pressure gauges, offering higher accuracy and advanced features, continues to shape market growth and dynamics, with a current market penetration of approximately xx%. The CAGR during the forecast period is estimated to be xx%.
Dominant Markets & Segments in Pressure Gauge Industry
The North American region currently dominates the global pressure gauge market, driven by robust industrial growth and technological advancements within its energy, manufacturing, and automotive sectors. Strong infrastructure development and favorable economic policies are also key contributors. Within application segments, the aerospace and defense sector is experiencing robust growth due to increasing investments in defense modernization programs and stringent safety regulations. This sector also demonstrates high demand for precision, reliability, and longevity. The automotive industry is another significant market segment for pressure gauges, driven by stricter emission regulations and advancements in vehicle safety systems. The demand for sophisticated pressure monitoring systems is increasing, leading to higher adoption rates.
Key Drivers for North American Dominance:
- Robust industrial growth across various sectors.
- Strong infrastructure development.
- Favorable economic policies.
- Technological advancements in sensor technology.
Key Drivers for Aerospace and Defense Segment:
- High demand for precision and reliability.
- Stringent safety regulations.
- Significant investments in defense modernization.
Key Drivers for Automotive Segment:
- Stricter emission regulations.
- Advancements in vehicle safety systems.
- Growing adoption of advanced driver-assistance systems (ADAS).
Within output types, the digital pressure gauge segment is witnessing faster growth compared to its analog counterpart, driven by higher accuracy, enhanced functionality, and better integration with digital systems. The global market share of digital pressure gauges is anticipated to increase significantly over the forecast period.
Pressure Gauge Industry Product Innovations
Recent years have seen significant advancements in pressure gauge technology, with a notable shift towards digital, wireless, and smart pressure gauges. The integration of advanced sensors, improved accuracy, and user-friendly interfaces are key features of new products. Companies are focusing on miniaturization, improved durability, and enhanced connectivity to meet the needs of various applications. The launch of products like OMEGA's DPG509 digital pressure gauge and Parker Meggitt's iPRESS wireless tire pressure gauge exemplifies this trend, showcasing the industry's emphasis on improved user experience and innovative design. These innovations are driving greater market penetration and are well-positioned to cater to evolving industry demands for higher precision and remote monitoring capabilities.
Report Segmentation & Scope
This report segments the pressure gauge market based on output type (Analog, Digital) and application (Aerospace and Defense, Automotive, Healthcare, Energy, Other Applications). The analog segment, while mature, still holds a significant market share, driven by cost-effectiveness in certain applications. The digital segment, however, is experiencing rapid growth due to its enhanced precision and data integration capabilities. In applications, Aerospace & Defense exhibits high growth due to strict regulatory requirements and safety concerns, while the automotive industry presents significant volume due to widespread vehicle production. The healthcare and energy sectors are also growing segments, driven by increasing demand for accurate and reliable pressure monitoring systems. Each segment's growth projection, market size, and competitive dynamics are analyzed within the report.
Key Drivers of Pressure Gauge Industry Growth
The growth of the pressure gauge industry is driven by several key factors: the increasing demand for accurate and reliable pressure measurement in diverse industrial processes, the rising adoption of advanced sensor technology, and stringent safety regulations across various end-use sectors. The automotive and aerospace industries are key drivers, requiring highly precise pressure gauges for safety-critical systems. Government initiatives promoting industrial automation and digitalization further propel market growth, leading to increased demand for smart and connected pressure gauges. Additionally, the growing adoption of IIoT and Industry 4.0 technologies is expected to create significant opportunities for pressure gauge manufacturers in the coming years.
Challenges in the Pressure Gauge Industry Sector
The pressure gauge industry faces challenges such as intense competition from both established players and new entrants, and the increasing complexity of regulatory compliance across different regions. Supply chain disruptions and fluctuations in raw material prices also pose significant risks. Technological advancements may lead to rapid obsolescence of existing products, necessitating continuous innovation and investment in R&D. Furthermore, the increasing adoption of alternative technologies, such as digital pressure sensors, could pose a potential threat to the market share of traditional pressure gauges. These challenges require manufacturers to adopt flexible and adaptable strategies to maintain competitiveness and sustain long-term growth.
Leading Players in the Pressure Gauge Industry Market
- Honeywell International Inc
- Stellar Technology
- Meggitt PLC
- AMETEK Inc
- Crane Company
- Tavis Corporation
- Industrial Quick Search Inc
- Emerson Electric Co
- CIRCORS Aerospace
- Newbow Aerospace Ltd
- WINTERS INSTRUMENTS
Key Developments in Pressure Gauge Industry Sector
December 2022: OMEGA launched the DPG509 series of digital pressure gauges, featuring a user-friendly interface and high accuracy (0.08%). This launch signifies a significant advancement in digital pressure gauge technology, enhancing user experience and accuracy.
October 2022: Parker Meggitt introduced iPRESS, a long-range wireless tire pressure gauge for aviation, integrating with Textron Aviation's service app. This development highlights the integration of wireless technology in the industry, enhancing monitoring and maintenance capabilities.
Strategic Pressure Gauge Industry Market Outlook
The pressure gauge industry is poised for continued growth, driven by the rising demand for sophisticated measurement solutions across various sectors. Strategic opportunities exist in developing advanced digital gauges, integrating wireless connectivity, and leveraging IIoT technologies for remote monitoring and predictive maintenance. Focusing on improving accuracy, enhancing user-friendliness, and meeting increasingly stringent regulatory requirements will be critical for success. Manufacturers who can effectively adapt to evolving technological landscapes and cater to specific customer needs will be well-positioned to capture significant market share in the coming years.
Pressure Gauge Industry Segmentation
-
1. Output Type
- 1.1. Analog
- 1.2. Digital
-
2. Application
- 2.1. Aerospace and Defense
- 2.2. Automotive
- 2.3. Healthcare
- 2.4. Energy
- 2.5. Other Applications
Pressure Gauge Industry Segmentation By Geography
-
1. North America
- 1.1. United States
- 1.2. Canada
-
2. Europe
- 2.1. United Kingdom
- 2.2. Germany
- 2.3. France
- 2.4. Rest of Europe
-
3. Asia Pacific
- 3.1. China
- 3.2. India
- 3.3. Japan
- 3.4. Rest of Asia Pacific
-
4. Latin America
- 4.1. Brazil
- 4.2. Rest of Latin America
- 5. Middle East
-
6. Saudi Arabia
- 6.1. United Arab Emirates
- 6.2. Turkey
- 6.3. Rest of Middle East
Pressure Gauge Industry REPORT HIGHLIGHTS
| Aspects | Details |
|---|---|
| Study Period | 2019-2033 |
| Base Year | 2024 |
| Estimated Year | 2025 |
| Forecast Period | 2025-2033 |
| Historical Period | 2019-2024 |
| Growth Rate | CAGR of 3.25% from 2019-2033 |
| Segmentation |
|
Table of Contents
- 1. Introduction
- 1.1. Research Scope
- 1.2. Market Segmentation
- 1.3. Research Methodology
- 1.4. Definitions and Assumptions
- 2. Executive Summary
- 2.1. Introduction
- 3. Market Dynamics
- 3.1. Introduction
- 3.2. Market Drivers
- 3.3. Market Restrains
- 3.4. Market Trends
- 3.4.1. Healthcare Segment is Projected to Show the Highest Growth During the Forecast Period
- 4. Market Factor Analysis
- 4.1. Porters Five Forces
- 4.2. Supply/Value Chain
- 4.3. PESTEL analysis
- 4.4. Market Entropy
- 4.5. Patent/Trademark Analysis
- 5. Global Pressure Gauge Industry Analysis, Insights and Forecast, 2019-2031
- 5.1. Market Analysis, Insights and Forecast - by Output Type
- 5.1.1. Analog
- 5.1.2. Digital
- 5.2. Market Analysis, Insights and Forecast - by Application
- 5.2.1. Aerospace and Defense
- 5.2.2. Automotive
- 5.2.3. Healthcare
- 5.2.4. Energy
- 5.2.5. Other Applications
- 5.3. Market Analysis, Insights and Forecast - by Region
- 5.3.1. North America
- 5.3.2. Europe
- 5.3.3. Asia Pacific
- 5.3.4. Latin America
- 5.3.5. Middle East
- 5.3.6. Saudi Arabia
- 5.1. Market Analysis, Insights and Forecast - by Output Type
- 6. North America Pressure Gauge Industry Analysis, Insights and Forecast, 2019-2031
- 6.1. Market Analysis, Insights and Forecast - by Output Type
- 6.1.1. Analog
- 6.1.2. Digital
- 6.2. Market Analysis, Insights and Forecast - by Application
- 6.2.1. Aerospace and Defense
- 6.2.2. Automotive
- 6.2.3. Healthcare
- 6.2.4. Energy
- 6.2.5. Other Applications
- 6.1. Market Analysis, Insights and Forecast - by Output Type
- 7. Europe Pressure Gauge Industry Analysis, Insights and Forecast, 2019-2031
- 7.1. Market Analysis, Insights and Forecast - by Output Type
- 7.1.1. Analog
- 7.1.2. Digital
- 7.2. Market Analysis, Insights and Forecast - by Application
- 7.2.1. Aerospace and Defense
- 7.2.2. Automotive
- 7.2.3. Healthcare
- 7.2.4. Energy
- 7.2.5. Other Applications
- 7.1. Market Analysis, Insights and Forecast - by Output Type
- 8. Asia Pacific Pressure Gauge Industry Analysis, Insights and Forecast, 2019-2031
- 8.1. Market Analysis, Insights and Forecast - by Output Type
- 8.1.1. Analog
- 8.1.2. Digital
- 8.2. Market Analysis, Insights and Forecast - by Application
- 8.2.1. Aerospace and Defense
- 8.2.2. Automotive
- 8.2.3. Healthcare
- 8.2.4. Energy
- 8.2.5. Other Applications
- 8.1. Market Analysis, Insights and Forecast - by Output Type
- 9. Latin America Pressure Gauge Industry Analysis, Insights and Forecast, 2019-2031
- 9.1. Market Analysis, Insights and Forecast - by Output Type
- 9.1.1. Analog
- 9.1.2. Digital
- 9.2. Market Analysis, Insights and Forecast - by Application
- 9.2.1. Aerospace and Defense
- 9.2.2. Automotive
- 9.2.3. Healthcare
- 9.2.4. Energy
- 9.2.5. Other Applications
- 9.1. Market Analysis, Insights and Forecast - by Output Type
- 10. Middle East Pressure Gauge Industry Analysis, Insights and Forecast, 2019-2031
- 10.1. Market Analysis, Insights and Forecast - by Output Type
- 10.1.1. Analog
- 10.1.2. Digital
- 10.2. Market Analysis, Insights and Forecast - by Application
- 10.2.1. Aerospace and Defense
- 10.2.2. Automotive
- 10.2.3. Healthcare
- 10.2.4. Energy
- 10.2.5. Other Applications
- 10.1. Market Analysis, Insights and Forecast - by Output Type
- 11. Saudi Arabia Pressure Gauge Industry Analysis, Insights and Forecast, 2019-2031
- 11.1. Market Analysis, Insights and Forecast - by Output Type
- 11.1.1. Analog
- 11.1.2. Digital
- 11.2. Market Analysis, Insights and Forecast - by Application
- 11.2.1. Aerospace and Defense
- 11.2.2. Automotive
- 11.2.3. Healthcare
- 11.2.4. Energy
- 11.2.5. Other Applications
- 11.1. Market Analysis, Insights and Forecast - by Output Type
- 12. North America Pressure Gauge Industry Analysis, Insights and Forecast, 2019-2031
- 12.1. Market Analysis, Insights and Forecast - By Country/Sub-region
- 12.1.1 United States
- 12.1.2 Canada
- 13. Europe Pressure Gauge Industry Analysis, Insights and Forecast, 2019-2031
- 13.1. Market Analysis, Insights and Forecast - By Country/Sub-region
- 13.1.1 United Kingdom
- 13.1.2 Germany
- 13.1.3 France
- 13.1.4 Rest of Europe
- 14. Asia Pacific Pressure Gauge Industry Analysis, Insights and Forecast, 2019-2031
- 14.1. Market Analysis, Insights and Forecast - By Country/Sub-region
- 14.1.1 China
- 14.1.2 India
- 14.1.3 Japan
- 14.1.4 Rest of Asia Pacific
- 15. Latin America Pressure Gauge Industry Analysis, Insights and Forecast, 2019-2031
- 15.1. Market Analysis, Insights and Forecast - By Country/Sub-region
- 15.1.1 Brazil
- 15.1.2 Rest of Latin America
- 16. Middle East Pressure Gauge Industry Analysis, Insights and Forecast, 2019-2031
- 16.1. Market Analysis, Insights and Forecast - By Country/Sub-region
- 16.1.1.
- 17. Saudi Arabia Pressure Gauge Industry Analysis, Insights and Forecast, 2019-2031
- 17.1. Market Analysis, Insights and Forecast - By Country/Sub-region
- 17.1.1 United Arab Emirates
- 17.1.2 Turkey
- 17.1.3 Rest of Middle East
- 18. Competitive Analysis
- 18.1. Global Market Share Analysis 2024
- 18.2. Company Profiles
- 18.2.1 Honeywell International Inc
- 18.2.1.1. Overview
- 18.2.1.2. Products
- 18.2.1.3. SWOT Analysis
- 18.2.1.4. Recent Developments
- 18.2.1.5. Financials (Based on Availability)
- 18.2.2 Stellar Technology
- 18.2.2.1. Overview
- 18.2.2.2. Products
- 18.2.2.3. SWOT Analysis
- 18.2.2.4. Recent Developments
- 18.2.2.5. Financials (Based on Availability)
- 18.2.3 Meggitt PLC
- 18.2.3.1. Overview
- 18.2.3.2. Products
- 18.2.3.3. SWOT Analysis
- 18.2.3.4. Recent Developments
- 18.2.3.5. Financials (Based on Availability)
- 18.2.4 AMETEK Inc
- 18.2.4.1. Overview
- 18.2.4.2. Products
- 18.2.4.3. SWOT Analysis
- 18.2.4.4. Recent Developments
- 18.2.4.5. Financials (Based on Availability)
- 18.2.5 Crane Company
- 18.2.5.1. Overview
- 18.2.5.2. Products
- 18.2.5.3. SWOT Analysis
- 18.2.5.4. Recent Developments
- 18.2.5.5. Financials (Based on Availability)
- 18.2.6 Tavis Corporation
- 18.2.6.1. Overview
- 18.2.6.2. Products
- 18.2.6.3. SWOT Analysis
- 18.2.6.4. Recent Developments
- 18.2.6.5. Financials (Based on Availability)
- 18.2.7 Industrial Quick Search Inc
- 18.2.7.1. Overview
- 18.2.7.2. Products
- 18.2.7.3. SWOT Analysis
- 18.2.7.4. Recent Developments
- 18.2.7.5. Financials (Based on Availability)
- 18.2.8 Emerson Electric Co
- 18.2.8.1. Overview
- 18.2.8.2. Products
- 18.2.8.3. SWOT Analysis
- 18.2.8.4. Recent Developments
- 18.2.8.5. Financials (Based on Availability)
- 18.2.9 CIRCOR Aerospace
- 18.2.9.1. Overview
- 18.2.9.2. Products
- 18.2.9.3. SWOT Analysis
- 18.2.9.4. Recent Developments
- 18.2.9.5. Financials (Based on Availability)
- 18.2.10 Newbow Aerospace Ltd
- 18.2.10.1. Overview
- 18.2.10.2. Products
- 18.2.10.3. SWOT Analysis
- 18.2.10.4. Recent Developments
- 18.2.10.5. Financials (Based on Availability)
- 18.2.11 WINTERS INSTRUMENTS
- 18.2.11.1. Overview
- 18.2.11.2. Products
- 18.2.11.3. SWOT Analysis
- 18.2.11.4. Recent Developments
- 18.2.11.5. Financials (Based on Availability)
- 18.2.1 Honeywell International Inc
List of Figures
- Figure 1: Global Pressure Gauge Industry Revenue Breakdown (Million, %) by Region 2024 & 2032
- Figure 2: North America Pressure Gauge Industry Revenue (Million), by Country 2024 & 2032
- Figure 3: North America Pressure Gauge Industry Revenue Share (%), by Country 2024 & 2032
- Figure 4: Europe Pressure Gauge Industry Revenue (Million), by Country 2024 & 2032
- Figure 5: Europe Pressure Gauge Industry Revenue Share (%), by Country 2024 & 2032
- Figure 6: Asia Pacific Pressure Gauge Industry Revenue (Million), by Country 2024 & 2032
- Figure 7: Asia Pacific Pressure Gauge Industry Revenue Share (%), by Country 2024 & 2032
- Figure 8: Latin America Pressure Gauge Industry Revenue (Million), by Country 2024 & 2032
- Figure 9: Latin America Pressure Gauge Industry Revenue Share (%), by Country 2024 & 2032
- Figure 10: Middle East Pressure Gauge Industry Revenue (Million), by Country 2024 & 2032
- Figure 11: Middle East Pressure Gauge Industry Revenue Share (%), by Country 2024 & 2032
- Figure 12: Saudi Arabia Pressure Gauge Industry Revenue (Million), by Country 2024 & 2032
- Figure 13: Saudi Arabia Pressure Gauge Industry Revenue Share (%), by Country 2024 & 2032
- Figure 14: North America Pressure Gauge Industry Revenue (Million), by Output Type 2024 & 2032
- Figure 15: North America Pressure Gauge Industry Revenue Share (%), by Output Type 2024 & 2032
- Figure 16: North America Pressure Gauge Industry Revenue (Million), by Application 2024 & 2032
- Figure 17: North America Pressure Gauge Industry Revenue Share (%), by Application 2024 & 2032
- Figure 18: North America Pressure Gauge Industry Revenue (Million), by Country 2024 & 2032
- Figure 19: North America Pressure Gauge Industry Revenue Share (%), by Country 2024 & 2032
- Figure 20: Europe Pressure Gauge Industry Revenue (Million), by Output Type 2024 & 2032
- Figure 21: Europe Pressure Gauge Industry Revenue Share (%), by Output Type 2024 & 2032
- Figure 22: Europe Pressure Gauge Industry Revenue (Million), by Application 2024 & 2032
- Figure 23: Europe Pressure Gauge Industry Revenue Share (%), by Application 2024 & 2032
- Figure 24: Europe Pressure Gauge Industry Revenue (Million), by Country 2024 & 2032
- Figure 25: Europe Pressure Gauge Industry Revenue Share (%), by Country 2024 & 2032
- Figure 26: Asia Pacific Pressure Gauge Industry Revenue (Million), by Output Type 2024 & 2032
- Figure 27: Asia Pacific Pressure Gauge Industry Revenue Share (%), by Output Type 2024 & 2032
- Figure 28: Asia Pacific Pressure Gauge Industry Revenue (Million), by Application 2024 & 2032
- Figure 29: Asia Pacific Pressure Gauge Industry Revenue Share (%), by Application 2024 & 2032
- Figure 30: Asia Pacific Pressure Gauge Industry Revenue (Million), by Country 2024 & 2032
- Figure 31: Asia Pacific Pressure Gauge Industry Revenue Share (%), by Country 2024 & 2032
- Figure 32: Latin America Pressure Gauge Industry Revenue (Million), by Output Type 2024 & 2032
- Figure 33: Latin America Pressure Gauge Industry Revenue Share (%), by Output Type 2024 & 2032
- Figure 34: Latin America Pressure Gauge Industry Revenue (Million), by Application 2024 & 2032
- Figure 35: Latin America Pressure Gauge Industry Revenue Share (%), by Application 2024 & 2032
- Figure 36: Latin America Pressure Gauge Industry Revenue (Million), by Country 2024 & 2032
- Figure 37: Latin America Pressure Gauge Industry Revenue Share (%), by Country 2024 & 2032
- Figure 38: Middle East Pressure Gauge Industry Revenue (Million), by Output Type 2024 & 2032
- Figure 39: Middle East Pressure Gauge Industry Revenue Share (%), by Output Type 2024 & 2032
- Figure 40: Middle East Pressure Gauge Industry Revenue (Million), by Application 2024 & 2032
- Figure 41: Middle East Pressure Gauge Industry Revenue Share (%), by Application 2024 & 2032
- Figure 42: Middle East Pressure Gauge Industry Revenue (Million), by Country 2024 & 2032
- Figure 43: Middle East Pressure Gauge Industry Revenue Share (%), by Country 2024 & 2032
- Figure 44: Saudi Arabia Pressure Gauge Industry Revenue (Million), by Output Type 2024 & 2032
- Figure 45: Saudi Arabia Pressure Gauge Industry Revenue Share (%), by Output Type 2024 & 2032
- Figure 46: Saudi Arabia Pressure Gauge Industry Revenue (Million), by Application 2024 & 2032
- Figure 47: Saudi Arabia Pressure Gauge Industry Revenue Share (%), by Application 2024 & 2032
- Figure 48: Saudi Arabia Pressure Gauge Industry Revenue (Million), by Country 2024 & 2032
- Figure 49: Saudi Arabia Pressure Gauge Industry Revenue Share (%), by Country 2024 & 2032
List of Tables
- Table 1: Global Pressure Gauge Industry Revenue Million Forecast, by Region 2019 & 2032
- Table 2: Global Pressure Gauge Industry Revenue Million Forecast, by Output Type 2019 & 2032
- Table 3: Global Pressure Gauge Industry Revenue Million Forecast, by Application 2019 & 2032
- Table 4: Global Pressure Gauge Industry Revenue Million Forecast, by Region 2019 & 2032
- Table 5: Global Pressure Gauge Industry Revenue Million Forecast, by Country 2019 & 2032
- Table 6: United States Pressure Gauge Industry Revenue (Million) Forecast, by Application 2019 & 2032
- Table 7: Canada Pressure Gauge Industry Revenue (Million) Forecast, by Application 2019 & 2032
- Table 8: Global Pressure Gauge Industry Revenue Million Forecast, by Country 2019 & 2032
- Table 9: United Kingdom Pressure Gauge Industry Revenue (Million) Forecast, by Application 2019 & 2032
- Table 10: Germany Pressure Gauge Industry Revenue (Million) Forecast, by Application 2019 & 2032
- Table 11: France Pressure Gauge Industry Revenue (Million) Forecast, by Application 2019 & 2032
- Table 12: Rest of Europe Pressure Gauge Industry Revenue (Million) Forecast, by Application 2019 & 2032
- Table 13: Global Pressure Gauge Industry Revenue Million Forecast, by Country 2019 & 2032
- Table 14: China Pressure Gauge Industry Revenue (Million) Forecast, by Application 2019 & 2032
- Table 15: India Pressure Gauge Industry Revenue (Million) Forecast, by Application 2019 & 2032
- Table 16: Japan Pressure Gauge Industry Revenue (Million) Forecast, by Application 2019 & 2032
- Table 17: Rest of Asia Pacific Pressure Gauge Industry Revenue (Million) Forecast, by Application 2019 & 2032
- Table 18: Global Pressure Gauge Industry Revenue Million Forecast, by Country 2019 & 2032
- Table 19: Brazil Pressure Gauge Industry Revenue (Million) Forecast, by Application 2019 & 2032
- Table 20: Rest of Latin America Pressure Gauge Industry Revenue (Million) Forecast, by Application 2019 & 2032
- Table 21: Global Pressure Gauge Industry Revenue Million Forecast, by Country 2019 & 2032
- Table 22: Pressure Gauge Industry Revenue (Million) Forecast, by Application 2019 & 2032
- Table 23: Global Pressure Gauge Industry Revenue Million Forecast, by Country 2019 & 2032
- Table 24: United Arab Emirates Pressure Gauge Industry Revenue (Million) Forecast, by Application 2019 & 2032
- Table 25: Turkey Pressure Gauge Industry Revenue (Million) Forecast, by Application 2019 & 2032
- Table 26: Rest of Middle East Pressure Gauge Industry Revenue (Million) Forecast, by Application 2019 & 2032
- Table 27: Global Pressure Gauge Industry Revenue Million Forecast, by Output Type 2019 & 2032
- Table 28: Global Pressure Gauge Industry Revenue Million Forecast, by Application 2019 & 2032
- Table 29: Global Pressure Gauge Industry Revenue Million Forecast, by Country 2019 & 2032
- Table 30: United States Pressure Gauge Industry Revenue (Million) Forecast, by Application 2019 & 2032
- Table 31: Canada Pressure Gauge Industry Revenue (Million) Forecast, by Application 2019 & 2032
- Table 32: Global Pressure Gauge Industry Revenue Million Forecast, by Output Type 2019 & 2032
- Table 33: Global Pressure Gauge Industry Revenue Million Forecast, by Application 2019 & 2032
- Table 34: Global Pressure Gauge Industry Revenue Million Forecast, by Country 2019 & 2032
- Table 35: United Kingdom Pressure Gauge Industry Revenue (Million) Forecast, by Application 2019 & 2032
- Table 36: Germany Pressure Gauge Industry Revenue (Million) Forecast, by Application 2019 & 2032
- Table 37: France Pressure Gauge Industry Revenue (Million) Forecast, by Application 2019 & 2032
- Table 38: Rest of Europe Pressure Gauge Industry Revenue (Million) Forecast, by Application 2019 & 2032
- Table 39: Global Pressure Gauge Industry Revenue Million Forecast, by Output Type 2019 & 2032
- Table 40: Global Pressure Gauge Industry Revenue Million Forecast, by Application 2019 & 2032
- Table 41: Global Pressure Gauge Industry Revenue Million Forecast, by Country 2019 & 2032
- Table 42: China Pressure Gauge Industry Revenue (Million) Forecast, by Application 2019 & 2032
- Table 43: India Pressure Gauge Industry Revenue (Million) Forecast, by Application 2019 & 2032
- Table 44: Japan Pressure Gauge Industry Revenue (Million) Forecast, by Application 2019 & 2032
- Table 45: Rest of Asia Pacific Pressure Gauge Industry Revenue (Million) Forecast, by Application 2019 & 2032
- Table 46: Global Pressure Gauge Industry Revenue Million Forecast, by Output Type 2019 & 2032
- Table 47: Global Pressure Gauge Industry Revenue Million Forecast, by Application 2019 & 2032
- Table 48: Global Pressure Gauge Industry Revenue Million Forecast, by Country 2019 & 2032
- Table 49: Brazil Pressure Gauge Industry Revenue (Million) Forecast, by Application 2019 & 2032
- Table 50: Rest of Latin America Pressure Gauge Industry Revenue (Million) Forecast, by Application 2019 & 2032
- Table 51: Global Pressure Gauge Industry Revenue Million Forecast, by Output Type 2019 & 2032
- Table 52: Global Pressure Gauge Industry Revenue Million Forecast, by Application 2019 & 2032
- Table 53: Global Pressure Gauge Industry Revenue Million Forecast, by Country 2019 & 2032
- Table 54: Global Pressure Gauge Industry Revenue Million Forecast, by Output Type 2019 & 2032
- Table 55: Global Pressure Gauge Industry Revenue Million Forecast, by Application 2019 & 2032
- Table 56: Global Pressure Gauge Industry Revenue Million Forecast, by Country 2019 & 2032
- Table 57: United Arab Emirates Pressure Gauge Industry Revenue (Million) Forecast, by Application 2019 & 2032
- Table 58: Turkey Pressure Gauge Industry Revenue (Million) Forecast, by Application 2019 & 2032
- Table 59: Rest of Middle East Pressure Gauge Industry Revenue (Million) Forecast, by Application 2019 & 2032
Frequently Asked Questions
1. What is the projected Compound Annual Growth Rate (CAGR) of the Pressure Gauge Industry?
The projected CAGR is approximately 3.25%.
2. Which companies are prominent players in the Pressure Gauge Industry?
Key companies in the market include Honeywell International Inc, Stellar Technology, Meggitt PLC, AMETEK Inc, Crane Company, Tavis Corporation, Industrial Quick Search Inc, Emerson Electric Co, CIRCOR Aerospace, Newbow Aerospace Ltd, WINTERS INSTRUMENTS.
3. What are the main segments of the Pressure Gauge Industry?
The market segments include Output Type, Application.
4. Can you provide details about the market size?
The market size is estimated to be USD XX Million as of 2022.
5. What are some drivers contributing to market growth?
N/A
6. What are the notable trends driving market growth?
Healthcare Segment is Projected to Show the Highest Growth During the Forecast Period.
7. Are there any restraints impacting market growth?
N/A
8. Can you provide examples of recent developments in the market?
In December 2022, OMEGA announced the launch of DPG509, OMEGA's newest series of digital pressure gauges, an advanced product designed with maximum functionality. The new DPG509 features a user-friendly interface with four buttons and a large 4-digit backlit display. The full-scale accuracy the product offers is as high as 0.08%.
9. What pricing options are available for accessing the report?
Pricing options include single-user, multi-user, and enterprise licenses priced at USD 4750, USD 5250, and USD 8750 respectively.
10. Is the market size provided in terms of value or volume?
The market size is provided in terms of value, measured in Million.
11. Are there any specific market keywords associated with the report?
Yes, the market keyword associated with the report is "Pressure Gauge Industry," which aids in identifying and referencing the specific market segment covered.
12. How do I determine which pricing option suits my needs best?
The pricing options vary based on user requirements and access needs. Individual users may opt for single-user licenses, while businesses requiring broader access may choose multi-user or enterprise licenses for cost-effective access to the report.
13. Are there any additional resources or data provided in the Pressure Gauge Industry report?
While the report offers comprehensive insights, it's advisable to review the specific contents or supplementary materials provided to ascertain if additional resources or data are available.
14. How can I stay updated on further developments or reports in the Pressure Gauge Industry?
To stay informed about further developments, trends, and reports in the Pressure Gauge Industry, consider subscribing to industry newsletters, following relevant companies and organizations, or regularly checking reputable industry news sources and publications.
Methodology
Step 1 - Identification of Relevant Samples Size from Population Database


Step 2 - Approaches for Defining Global Market Size (Value, Volume* & Price*)

Note*: In applicable scenarios
Step 3 - Data Sources
Primary Research
- Web Analytics
- Survey Reports
- Research Institute
- Latest Research Reports
- Opinion Leaders
Secondary Research
- Annual Reports
- White Paper
- Latest Press Release
- Industry Association
- Paid Database
- Investor Presentations

Step 4 - Data Triangulation
Involves using different sources of information in order to increase the validity of a study
These sources are likely to be stakeholders in a program - participants, other researchers, program staff, other community members, and so on.
Then we put all data in single framework & apply various statistical tools to find out the dynamic on the market.
During the analysis stage, feedback from the stakeholder groups would be compared to determine areas of agreement as well as areas of divergence


