
Key Insights
The premium bakery products market, encompassing breads, cookies, biscuits, morning goods, cakes, and pastries, exhibits robust growth potential. Driven by increasing disposable incomes, a rising preference for convenient yet high-quality food options, and a growing health-conscious consumer base seeking premium ingredients and artisanal products, the market is projected to experience significant expansion. The 6.25% CAGR indicates a steady upward trajectory, particularly fueled by strong demand in developed regions like North America and Europe, where consumers are willing to pay a premium for superior taste, texture, and unique flavor profiles. The shift towards healthier options, including gluten-free and organic products, is a key trend, while the increasing popularity of online retail channels offers new growth avenues for premium bakery brands. Competition remains fierce, with established multinational corporations like Barilla, General Mills, and Mondelez International vying for market share alongside regional and artisanal bakeries. The market segmentation by product type and distribution channel highlights opportunities for targeted marketing strategies, with supermarkets and hypermarkets currently dominating distribution, but online channels poised for considerable growth in the coming years.
Despite the positive outlook, challenges remain. Fluctuating raw material prices, particularly for key ingredients like wheat and sugar, can impact profitability. Furthermore, maintaining consistent quality and meeting the evolving demands of health-conscious consumers require significant investment in research and development. Successfully navigating these challenges will be crucial for premium bakery brands seeking to capitalize on the market's substantial growth potential. Geographic expansion into emerging markets, particularly in Asia-Pacific and South America, presents further opportunities for market penetration, although understanding local tastes and preferences is essential for successful product launches. This requires a strategic blend of established brand recognition and localized product offerings to fully realize the global market's potential.
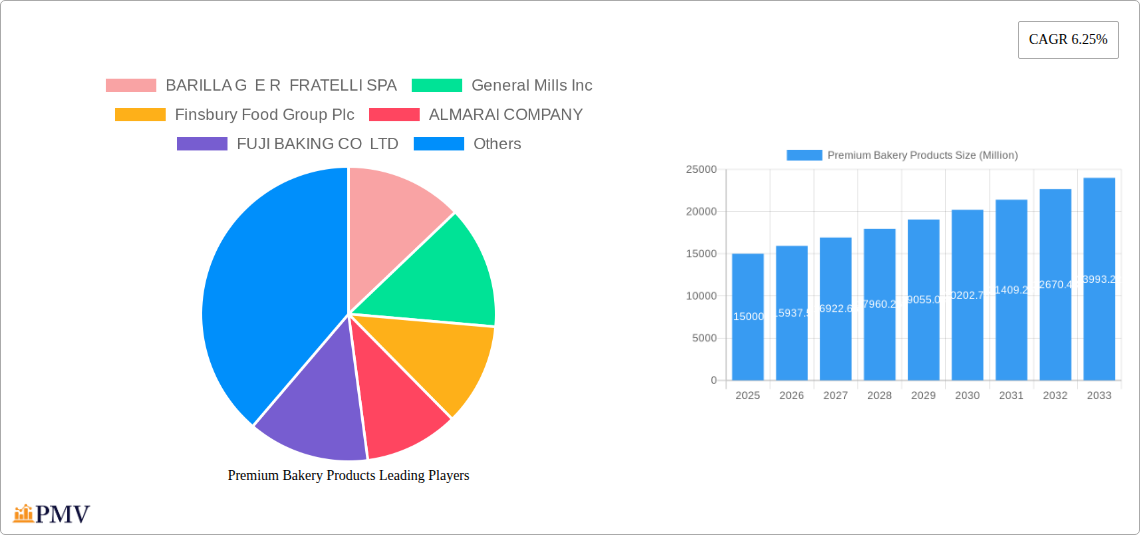
This comprehensive report provides a detailed analysis of the global premium bakery products market, offering invaluable insights for businesses and investors seeking to navigate this dynamic sector. The report covers the period from 2019 to 2033, with a focus on the forecast period from 2025 to 2033 and a base year of 2025. The market is segmented by product type (Breads, Cookies and Biscuits, Morning Goods, Cakes and Pastries, Others) and distribution channel (Supermarkets/Hypermarkets, Speciality stores, Online Retail Stores, Other Distribution Channels). The report analyzes key players like BARILLA G E R FRATELLI SPA, General Mills Inc, Finsbury Food Group Plc, ALMARAI COMPANY, FUJI BAKING CO LTD, Associated British Foods plc, Mondelez International Inc, Bimbo Bakeries USA, Bakers Delight Holdings Limited, and Britannia Industries Ltd, among others. This detailed examination reveals significant trends, market sizes exceeding $XX Million, and growth projections, providing actionable intelligence for strategic decision-making.
Premium Bakery Products Market Structure & Competitive Dynamics
The premium bakery products market exhibits a moderately concentrated structure, with a few major players commanding significant market share. However, a vibrant ecosystem of smaller, specialized bakeries and artisanal producers also contributes substantially to market diversity. The industry is characterized by ongoing innovation, driven by consumer demand for healthier, more convenient, and uniquely flavored products. Regulatory frameworks concerning food safety, labeling, and ingredient sourcing vary across regions, impacting market dynamics significantly. Product substitutes, including healthier alternatives and other snack categories, pose a competitive challenge. End-user preferences are shifting towards premium ingredients, sustainable sourcing practices, and personalized experiences. Mergers and acquisitions (M&A) activity is considerable, with deal values exceeding $XX Million in recent years. For example, Mondelez International’s acquisition of Chipita S.A. significantly reshaped the market landscape.
- Market Concentration: Moderately concentrated, with top 5 players holding approximately xx% market share in 2024.
- Innovation Ecosystems: Strong, driven by consumer demand for novel flavors and healthy options.
- Regulatory Frameworks: Vary across regions, affecting ingredient sourcing and labeling.
- Product Substitutes: Growing competition from healthy alternatives and other snack categories.
- End-User Trends: Shift towards premium ingredients, sustainable practices, and personalized experiences.
- M&A Activity: Significant, with deal values exceeding $XX Million annually (2019-2024).
Premium Bakery Products Industry Trends & Insights
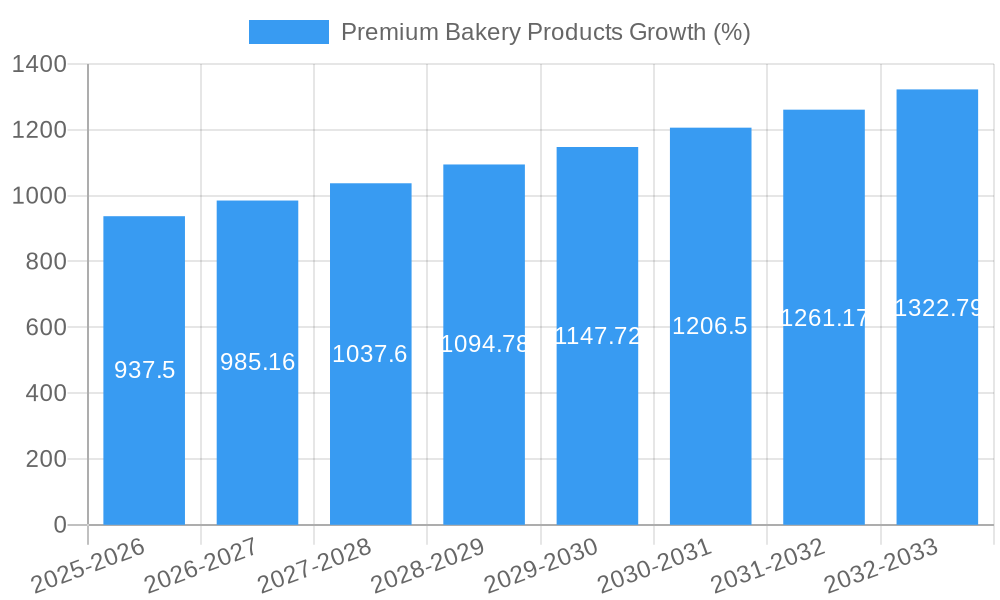
The premium bakery products market is experiencing robust growth, driven by several key factors. Rising disposable incomes, particularly in emerging economies, are fueling demand for premium bakery items. The increasing popularity of convenient and on-the-go snacking options is boosting sales of products like cookies and pastries. Technological advancements in baking equipment and processes are leading to increased efficiency and product innovation. Consumer preferences are evolving towards healthier options, encouraging the development of products with reduced sugar, fat, and gluten content. However, fluctuations in raw material prices and intense competition pose significant challenges to market growth. The market is expected to register a CAGR of xx% during the forecast period (2025-2033), with significant market penetration in key regions. The premium segment, specifically, exhibits a higher CAGR of xx% attributed to the increase in demand for high-quality ingredients and innovative product offerings.
Dominant Markets & Segments in Premium Bakery Products
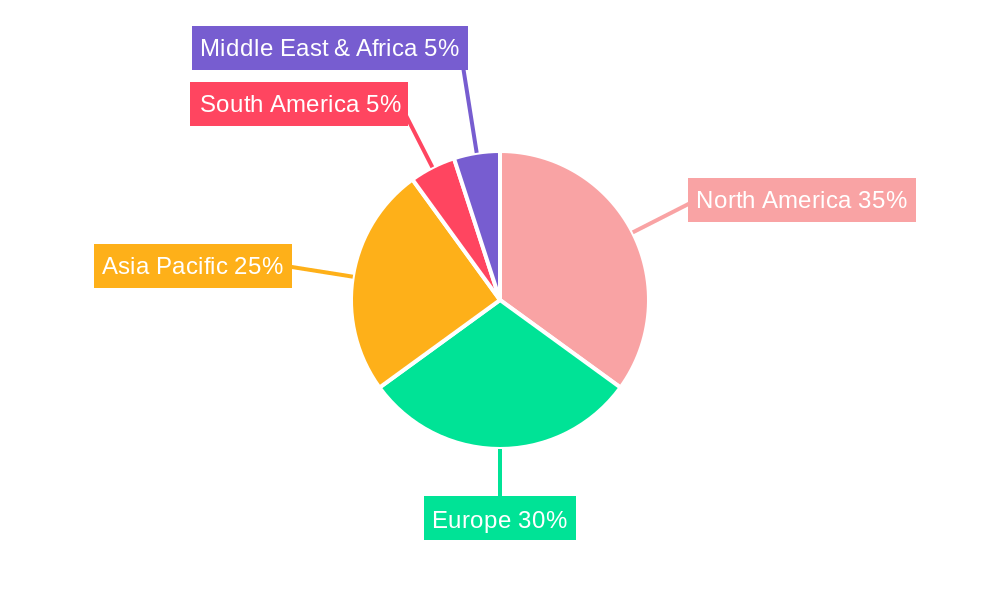
The North American region holds a dominant position in the premium bakery products market, driven by factors including high disposable incomes, established distribution networks, and strong consumer demand for premium and convenient food options. Within this region, the United States is the largest market. Cookies and biscuits constitute the largest product segment, followed by cakes and pastries, reflecting the widespread popularity of these product categories. Supermarkets/hypermarkets are the leading distribution channel, owing to their extensive reach and established presence in the market.
- Key Drivers in North America: Strong consumer demand, robust distribution networks, high disposable incomes.
- Key Drivers in Europe: Growing preference for premium and artisanal products, increasing tourism.
- Key Drivers in Asia-Pacific: Rising disposable incomes, expanding middle class.
Dominant Segments:
- By Product Type: Cookies and Biscuits (Largest segment, driven by high demand and convenience).
- By Distribution Channel: Supermarkets/Hypermarkets (Largest segment, due to extensive reach).
Premium Bakery Products Product Innovations
Recent product innovations focus on incorporating healthier ingredients, such as whole grains, nuts, and seeds, catering to the growing health consciousness among consumers. Furthermore, there's a strong trend towards unique flavors and artisanal approaches, reflecting the premium nature of the market. Technological advancements in baking techniques, such as 3D printing and automation, are also enhancing efficiency and creating novel product forms. The market continually strives to offer superior taste and texture, alongside convenience, making the products desirable to the target audience.
Report Segmentation & Scope
The report segments the market by Product Type: Breads, Cookies and Biscuits, Morning Goods, Cakes and Pastries, Others, and by Distribution Channel: Supermarkets/Hypermarkets, Specialty stores, Online Retail Stores, Other Distribution Channels. Each segment is analyzed based on its current market size, growth projections, and competitive dynamics, offering detailed insights for effective strategic planning. The growth projections account for factors such as consumer preferences, technological advancements, and economic conditions. The competitive dynamics for each segment are detailed considering the major players, market share, and product innovation.
Key Drivers of Premium Bakery Products Growth
Several key factors drive growth in the premium bakery products market. Increasing disposable incomes and changing lifestyles fuel demand for convenient, high-quality snacks. Health and wellness trends are driving innovation in healthier ingredients and formulations. Growing online retail channels provide opportunities for premium brands to reach broader customer bases. Government regulations focused on food safety also ensure consistent product quality which boosts consumer confidence and market growth.
Challenges in the Premium Bakery Products Sector
The premium bakery products sector faces challenges such as intense competition, fluctuating raw material prices, and stringent regulatory requirements. Supply chain disruptions, resulting from geopolitical instability or unforeseen events, can significantly impact production and distribution. The cost of premium ingredients can inflate prices, potentially affecting affordability for consumers. The increasing demand for sustainable practices puts pressure on companies to adopt environmentally friendly methods, requiring substantial investment.
Leading Players in the Premium Bakery Products Market
- BARILLA G E R FRATELLI SPA
- General Mills Inc
- Finsbury Food Group Plc
- ALMARAI COMPANY
- FUJI BAKING CO LTD
- Associated British Foods plc
- Mondelez International Inc
- Bimbo Bakeries USA
- Bakers Delight Holdings Limited
- Britannia Industries Ltd
Key Developments in Premium Bakery Products Sector
- April 2022: Walker's Shortbread partners with Dufry to launch a new Global Travel Retailer range.
- April 2022: Burton's Biscuit Company merges with Fox's Biscuits.
- May 2021: Mondelez International acquires Chipita S.A. for approximately USD 2 Billion.
Strategic Premium Bakery Products Market Outlook
The premium bakery products market is poised for continued growth, driven by increasing demand for convenient and high-quality snacks. Strategic opportunities lie in product innovation, focusing on health and wellness, and expanding into emerging markets. Leveraging digital marketing and e-commerce channels will also be critical for reaching wider consumer bases. Companies should focus on sustainable and ethical sourcing practices to attract environmentally conscious consumers. Overall, the market outlook is positive, with significant potential for growth and innovation in the coming years.
Premium Bakery Products Segmentation
-
1. Product Type
- 1.1. Breads
- 1.2. Cookies and Biscuits
- 1.3. Morning Goods
- 1.4. Cakes and Pastries
- 1.5. others
-
2. Distibution Channel
- 2.1. Supermarkets/Hypermarkets
- 2.2. Speciality stores
- 2.3. Online Retail Stores
- 2.4. Other Distribution Channels
Premium Bakery Products Segmentation By Geography
-
1. North America
- 1.1. United States
- 1.2. Canada
- 1.3. Mexico
- 1.4. Rest of North America
-
2. Europe
- 2.1. United Kingdom
- 2.2. Germany
- 2.3. Spain
- 2.4. France
- 2.5. Italy
- 2.6. Russia
- 2.7. Rest of Europe
-
3. Asia Pacific
- 3.1. China
- 3.2. Japan
- 3.3. India
- 3.4. Australia
- 3.5. Rest of Asia Pacific
-
4. South America
- 4.1. Brazil
- 4.2. Argentina
- 4.3. Rest of South America
- 5. Middle East
-
6. Saudi Arabia
- 6.1. South Africa
- 6.2. Rest of Middle East
Premium Bakery Products REPORT HIGHLIGHTS
| Aspects | Details |
|---|---|
| Study Period | 2019-2033 |
| Base Year | 2024 |
| Estimated Year | 2025 |
| Forecast Period | 2025-2033 |
| Historical Period | 2019-2024 |
| Growth Rate | CAGR of 6.25% from 2019-2033 |
| Segmentation |
|
Table of Contents
- 1. Introduction
- 1.1. Research Scope
- 1.2. Market Segmentation
- 1.3. Research Methodology
- 1.4. Definitions and Assumptions
- 2. Executive Summary
- 2.1. Introduction
- 3. Market Dynamics
- 3.1. Introduction
- 3.2. Market Drivers
- 3.2.1. Innovation in Vanillin Synthesis; Diverse Functionality of Vanillin In End-use Industries
- 3.3. Market Restrains
- 3.3.1. Supply Chain Variability Impacting Vanilla Bean Availability For Flavor Production
- 3.4. Market Trends
- 3.4.1. Rising demand for premium healthy snacking options is driving the market
- 4. Market Factor Analysis
- 4.1. Porters Five Forces
- 4.2. Supply/Value Chain
- 4.3. PESTEL analysis
- 4.4. Market Entropy
- 4.5. Patent/Trademark Analysis
- 5. Global Premium Bakery Products Analysis, Insights and Forecast, 2019-2031
- 5.1. Market Analysis, Insights and Forecast - by Product Type
- 5.1.1. Breads
- 5.1.2. Cookies and Biscuits
- 5.1.3. Morning Goods
- 5.1.4. Cakes and Pastries
- 5.1.5. others
- 5.2. Market Analysis, Insights and Forecast - by Distibution Channel
- 5.2.1. Supermarkets/Hypermarkets
- 5.2.2. Speciality stores
- 5.2.3. Online Retail Stores
- 5.2.4. Other Distribution Channels
- 5.3. Market Analysis, Insights and Forecast - by Region
- 5.3.1. North America
- 5.3.2. Europe
- 5.3.3. Asia Pacific
- 5.3.4. South America
- 5.3.5. Middle East
- 5.3.6. Saudi Arabia
- 5.1. Market Analysis, Insights and Forecast - by Product Type
- 6. North America Premium Bakery Products Analysis, Insights and Forecast, 2019-2031
- 6.1. Market Analysis, Insights and Forecast - by Product Type
- 6.1.1. Breads
- 6.1.2. Cookies and Biscuits
- 6.1.3. Morning Goods
- 6.1.4. Cakes and Pastries
- 6.1.5. others
- 6.2. Market Analysis, Insights and Forecast - by Distibution Channel
- 6.2.1. Supermarkets/Hypermarkets
- 6.2.2. Speciality stores
- 6.2.3. Online Retail Stores
- 6.2.4. Other Distribution Channels
- 6.1. Market Analysis, Insights and Forecast - by Product Type
- 7. Europe Premium Bakery Products Analysis, Insights and Forecast, 2019-2031
- 7.1. Market Analysis, Insights and Forecast - by Product Type
- 7.1.1. Breads
- 7.1.2. Cookies and Biscuits
- 7.1.3. Morning Goods
- 7.1.4. Cakes and Pastries
- 7.1.5. others
- 7.2. Market Analysis, Insights and Forecast - by Distibution Channel
- 7.2.1. Supermarkets/Hypermarkets
- 7.2.2. Speciality stores
- 7.2.3. Online Retail Stores
- 7.2.4. Other Distribution Channels
- 7.1. Market Analysis, Insights and Forecast - by Product Type
- 8. Asia Pacific Premium Bakery Products Analysis, Insights and Forecast, 2019-2031
- 8.1. Market Analysis, Insights and Forecast - by Product Type
- 8.1.1. Breads
- 8.1.2. Cookies and Biscuits
- 8.1.3. Morning Goods
- 8.1.4. Cakes and Pastries
- 8.1.5. others
- 8.2. Market Analysis, Insights and Forecast - by Distibution Channel
- 8.2.1. Supermarkets/Hypermarkets
- 8.2.2. Speciality stores
- 8.2.3. Online Retail Stores
- 8.2.4. Other Distribution Channels
- 8.1. Market Analysis, Insights and Forecast - by Product Type
- 9. South America Premium Bakery Products Analysis, Insights and Forecast, 2019-2031
- 9.1. Market Analysis, Insights and Forecast - by Product Type
- 9.1.1. Breads
- 9.1.2. Cookies and Biscuits
- 9.1.3. Morning Goods
- 9.1.4. Cakes and Pastries
- 9.1.5. others
- 9.2. Market Analysis, Insights and Forecast - by Distibution Channel
- 9.2.1. Supermarkets/Hypermarkets
- 9.2.2. Speciality stores
- 9.2.3. Online Retail Stores
- 9.2.4. Other Distribution Channels
- 9.1. Market Analysis, Insights and Forecast - by Product Type
- 10. Middle East Premium Bakery Products Analysis, Insights and Forecast, 2019-2031
- 10.1. Market Analysis, Insights and Forecast - by Product Type
- 10.1.1. Breads
- 10.1.2. Cookies and Biscuits
- 10.1.3. Morning Goods
- 10.1.4. Cakes and Pastries
- 10.1.5. others
- 10.2. Market Analysis, Insights and Forecast - by Distibution Channel
- 10.2.1. Supermarkets/Hypermarkets
- 10.2.2. Speciality stores
- 10.2.3. Online Retail Stores
- 10.2.4. Other Distribution Channels
- 10.1. Market Analysis, Insights and Forecast - by Product Type
- 11. Saudi Arabia Premium Bakery Products Analysis, Insights and Forecast, 2019-2031
- 11.1. Market Analysis, Insights and Forecast - by Product Type
- 11.1.1. Breads
- 11.1.2. Cookies and Biscuits
- 11.1.3. Morning Goods
- 11.1.4. Cakes and Pastries
- 11.1.5. others
- 11.2. Market Analysis, Insights and Forecast - by Distibution Channel
- 11.2.1. Supermarkets/Hypermarkets
- 11.2.2. Speciality stores
- 11.2.3. Online Retail Stores
- 11.2.4. Other Distribution Channels
- 11.1. Market Analysis, Insights and Forecast - by Product Type
- 12. North America Premium Bakery Products Analysis, Insights and Forecast, 2019-2031
- 12.1. Market Analysis, Insights and Forecast - By Country/Sub-region
- 12.1.1 United States
- 12.1.2 Canada
- 12.1.3 Mexico
- 12.1.4 Rest of North America
- 13. Europe Premium Bakery Products Analysis, Insights and Forecast, 2019-2031
- 13.1. Market Analysis, Insights and Forecast - By Country/Sub-region
- 13.1.1 United Kingdom
- 13.1.2 Germany
- 13.1.3 Spain
- 13.1.4 France
- 13.1.5 Italy
- 13.1.6 Russia
- 13.1.7 Rest of Europe
- 14. Asia Pacific Premium Bakery Products Analysis, Insights and Forecast, 2019-2031
- 14.1. Market Analysis, Insights and Forecast - By Country/Sub-region
- 14.1.1 China
- 14.1.2 Japan
- 14.1.3 India
- 14.1.4 Australia
- 14.1.5 Rest of Asia Pacific
- 15. South America Premium Bakery Products Analysis, Insights and Forecast, 2019-2031
- 15.1. Market Analysis, Insights and Forecast - By Country/Sub-region
- 15.1.1 Brazil
- 15.1.2 Argentina
- 15.1.3 Rest of South America
- 16. Middle East & Africa Premium Bakery Products Analysis, Insights and Forecast, 2019-2031
- 16.1. Market Analysis, Insights and Forecast - By Country/Sub-region
- 16.1.1 UAE
- 16.1.2 South Africa
- 16.1.3 Saudi Arabia
- 16.1.4 Rest of MEA
- 17. Competitive Analysis
- 17.1. Global Market Share Analysis 2024
- 17.2. Company Profiles
- 17.2.1 BARILLA G E R FRATELLI SPA
- 17.2.1.1. Overview
- 17.2.1.2. Products
- 17.2.1.3. SWOT Analysis
- 17.2.1.4. Recent Developments
- 17.2.1.5. Financials (Based on Availability)
- 17.2.2 General Mills Inc
- 17.2.2.1. Overview
- 17.2.2.2. Products
- 17.2.2.3. SWOT Analysis
- 17.2.2.4. Recent Developments
- 17.2.2.5. Financials (Based on Availability)
- 17.2.3 Finsbury Food Group Plc
- 17.2.3.1. Overview
- 17.2.3.2. Products
- 17.2.3.3. SWOT Analysis
- 17.2.3.4. Recent Developments
- 17.2.3.5. Financials (Based on Availability)
- 17.2.4 ALMARAI COMPANY
- 17.2.4.1. Overview
- 17.2.4.2. Products
- 17.2.4.3. SWOT Analysis
- 17.2.4.4. Recent Developments
- 17.2.4.5. Financials (Based on Availability)
- 17.2.5 FUJI BAKING CO LTD
- 17.2.5.1. Overview
- 17.2.5.2. Products
- 17.2.5.3. SWOT Analysis
- 17.2.5.4. Recent Developments
- 17.2.5.5. Financials (Based on Availability)
- 17.2.6 Associated British Foods plc
- 17.2.6.1. Overview
- 17.2.6.2. Products
- 17.2.6.3. SWOT Analysis
- 17.2.6.4. Recent Developments
- 17.2.6.5. Financials (Based on Availability)
- 17.2.7 Mondelez International Inc
- 17.2.7.1. Overview
- 17.2.7.2. Products
- 17.2.7.3. SWOT Analysis
- 17.2.7.4. Recent Developments
- 17.2.7.5. Financials (Based on Availability)
- 17.2.8 Bimbo Bakeries USA
- 17.2.8.1. Overview
- 17.2.8.2. Products
- 17.2.8.3. SWOT Analysis
- 17.2.8.4. Recent Developments
- 17.2.8.5. Financials (Based on Availability)
- 17.2.9 Bakers Delight Holdings Limited
- 17.2.9.1. Overview
- 17.2.9.2. Products
- 17.2.9.3. SWOT Analysis
- 17.2.9.4. Recent Developments
- 17.2.9.5. Financials (Based on Availability)
- 17.2.10 Britannia Industries Ltd*List Not Exhaustive
- 17.2.10.1. Overview
- 17.2.10.2. Products
- 17.2.10.3. SWOT Analysis
- 17.2.10.4. Recent Developments
- 17.2.10.5. Financials (Based on Availability)
- 17.2.1 BARILLA G E R FRATELLI SPA
List of Figures
- Figure 1: Global Premium Bakery Products Revenue Breakdown (Million, %) by Region 2024 & 2032
- Figure 2: Global Premium Bakery Products Volume Breakdown (K Tons, %) by Region 2024 & 2032
- Figure 3: North America Premium Bakery Products Revenue (Million), by Country 2024 & 2032
- Figure 4: North America Premium Bakery Products Volume (K Tons), by Country 2024 & 2032
- Figure 5: North America Premium Bakery Products Revenue Share (%), by Country 2024 & 2032
- Figure 6: North America Premium Bakery Products Volume Share (%), by Country 2024 & 2032
- Figure 7: Europe Premium Bakery Products Revenue (Million), by Country 2024 & 2032
- Figure 8: Europe Premium Bakery Products Volume (K Tons), by Country 2024 & 2032
- Figure 9: Europe Premium Bakery Products Revenue Share (%), by Country 2024 & 2032
- Figure 10: Europe Premium Bakery Products Volume Share (%), by Country 2024 & 2032
- Figure 11: Asia Pacific Premium Bakery Products Revenue (Million), by Country 2024 & 2032
- Figure 12: Asia Pacific Premium Bakery Products Volume (K Tons), by Country 2024 & 2032
- Figure 13: Asia Pacific Premium Bakery Products Revenue Share (%), by Country 2024 & 2032
- Figure 14: Asia Pacific Premium Bakery Products Volume Share (%), by Country 2024 & 2032
- Figure 15: South America Premium Bakery Products Revenue (Million), by Country 2024 & 2032
- Figure 16: South America Premium Bakery Products Volume (K Tons), by Country 2024 & 2032
- Figure 17: South America Premium Bakery Products Revenue Share (%), by Country 2024 & 2032
- Figure 18: South America Premium Bakery Products Volume Share (%), by Country 2024 & 2032
- Figure 19: Middle East & Africa Premium Bakery Products Revenue (Million), by Country 2024 & 2032
- Figure 20: Middle East & Africa Premium Bakery Products Volume (K Tons), by Country 2024 & 2032
- Figure 21: Middle East & Africa Premium Bakery Products Revenue Share (%), by Country 2024 & 2032
- Figure 22: Middle East & Africa Premium Bakery Products Volume Share (%), by Country 2024 & 2032
- Figure 23: North America Premium Bakery Products Revenue (Million), by Product Type 2024 & 2032
- Figure 24: North America Premium Bakery Products Volume (K Tons), by Product Type 2024 & 2032
- Figure 25: North America Premium Bakery Products Revenue Share (%), by Product Type 2024 & 2032
- Figure 26: North America Premium Bakery Products Volume Share (%), by Product Type 2024 & 2032
- Figure 27: North America Premium Bakery Products Revenue (Million), by Distibution Channel 2024 & 2032
- Figure 28: North America Premium Bakery Products Volume (K Tons), by Distibution Channel 2024 & 2032
- Figure 29: North America Premium Bakery Products Revenue Share (%), by Distibution Channel 2024 & 2032
- Figure 30: North America Premium Bakery Products Volume Share (%), by Distibution Channel 2024 & 2032
- Figure 31: North America Premium Bakery Products Revenue (Million), by Country 2024 & 2032
- Figure 32: North America Premium Bakery Products Volume (K Tons), by Country 2024 & 2032
- Figure 33: North America Premium Bakery Products Revenue Share (%), by Country 2024 & 2032
- Figure 34: North America Premium Bakery Products Volume Share (%), by Country 2024 & 2032
- Figure 35: Europe Premium Bakery Products Revenue (Million), by Product Type 2024 & 2032
- Figure 36: Europe Premium Bakery Products Volume (K Tons), by Product Type 2024 & 2032
- Figure 37: Europe Premium Bakery Products Revenue Share (%), by Product Type 2024 & 2032
- Figure 38: Europe Premium Bakery Products Volume Share (%), by Product Type 2024 & 2032
- Figure 39: Europe Premium Bakery Products Revenue (Million), by Distibution Channel 2024 & 2032
- Figure 40: Europe Premium Bakery Products Volume (K Tons), by Distibution Channel 2024 & 2032
- Figure 41: Europe Premium Bakery Products Revenue Share (%), by Distibution Channel 2024 & 2032
- Figure 42: Europe Premium Bakery Products Volume Share (%), by Distibution Channel 2024 & 2032
- Figure 43: Europe Premium Bakery Products Revenue (Million), by Country 2024 & 2032
- Figure 44: Europe Premium Bakery Products Volume (K Tons), by Country 2024 & 2032
- Figure 45: Europe Premium Bakery Products Revenue Share (%), by Country 2024 & 2032
- Figure 46: Europe Premium Bakery Products Volume Share (%), by Country 2024 & 2032
- Figure 47: Asia Pacific Premium Bakery Products Revenue (Million), by Product Type 2024 & 2032
- Figure 48: Asia Pacific Premium Bakery Products Volume (K Tons), by Product Type 2024 & 2032
- Figure 49: Asia Pacific Premium Bakery Products Revenue Share (%), by Product Type 2024 & 2032
- Figure 50: Asia Pacific Premium Bakery Products Volume Share (%), by Product Type 2024 & 2032
- Figure 51: Asia Pacific Premium Bakery Products Revenue (Million), by Distibution Channel 2024 & 2032
- Figure 52: Asia Pacific Premium Bakery Products Volume (K Tons), by Distibution Channel 2024 & 2032
- Figure 53: Asia Pacific Premium Bakery Products Revenue Share (%), by Distibution Channel 2024 & 2032
- Figure 54: Asia Pacific Premium Bakery Products Volume Share (%), by Distibution Channel 2024 & 2032
- Figure 55: Asia Pacific Premium Bakery Products Revenue (Million), by Country 2024 & 2032
- Figure 56: Asia Pacific Premium Bakery Products Volume (K Tons), by Country 2024 & 2032
- Figure 57: Asia Pacific Premium Bakery Products Revenue Share (%), by Country 2024 & 2032
- Figure 58: Asia Pacific Premium Bakery Products Volume Share (%), by Country 2024 & 2032
- Figure 59: South America Premium Bakery Products Revenue (Million), by Product Type 2024 & 2032
- Figure 60: South America Premium Bakery Products Volume (K Tons), by Product Type 2024 & 2032
- Figure 61: South America Premium Bakery Products Revenue Share (%), by Product Type 2024 & 2032
- Figure 62: South America Premium Bakery Products Volume Share (%), by Product Type 2024 & 2032
- Figure 63: South America Premium Bakery Products Revenue (Million), by Distibution Channel 2024 & 2032
- Figure 64: South America Premium Bakery Products Volume (K Tons), by Distibution Channel 2024 & 2032
- Figure 65: South America Premium Bakery Products Revenue Share (%), by Distibution Channel 2024 & 2032
- Figure 66: South America Premium Bakery Products Volume Share (%), by Distibution Channel 2024 & 2032
- Figure 67: South America Premium Bakery Products Revenue (Million), by Country 2024 & 2032
- Figure 68: South America Premium Bakery Products Volume (K Tons), by Country 2024 & 2032
- Figure 69: South America Premium Bakery Products Revenue Share (%), by Country 2024 & 2032
- Figure 70: South America Premium Bakery Products Volume Share (%), by Country 2024 & 2032
- Figure 71: Middle East Premium Bakery Products Revenue (Million), by Product Type 2024 & 2032
- Figure 72: Middle East Premium Bakery Products Volume (K Tons), by Product Type 2024 & 2032
- Figure 73: Middle East Premium Bakery Products Revenue Share (%), by Product Type 2024 & 2032
- Figure 74: Middle East Premium Bakery Products Volume Share (%), by Product Type 2024 & 2032
- Figure 75: Middle East Premium Bakery Products Revenue (Million), by Distibution Channel 2024 & 2032
- Figure 76: Middle East Premium Bakery Products Volume (K Tons), by Distibution Channel 2024 & 2032
- Figure 77: Middle East Premium Bakery Products Revenue Share (%), by Distibution Channel 2024 & 2032
- Figure 78: Middle East Premium Bakery Products Volume Share (%), by Distibution Channel 2024 & 2032
- Figure 79: Middle East Premium Bakery Products Revenue (Million), by Country 2024 & 2032
- Figure 80: Middle East Premium Bakery Products Volume (K Tons), by Country 2024 & 2032
- Figure 81: Middle East Premium Bakery Products Revenue Share (%), by Country 2024 & 2032
- Figure 82: Middle East Premium Bakery Products Volume Share (%), by Country 2024 & 2032
- Figure 83: Saudi Arabia Premium Bakery Products Revenue (Million), by Product Type 2024 & 2032
- Figure 84: Saudi Arabia Premium Bakery Products Volume (K Tons), by Product Type 2024 & 2032
- Figure 85: Saudi Arabia Premium Bakery Products Revenue Share (%), by Product Type 2024 & 2032
- Figure 86: Saudi Arabia Premium Bakery Products Volume Share (%), by Product Type 2024 & 2032
- Figure 87: Saudi Arabia Premium Bakery Products Revenue (Million), by Distibution Channel 2024 & 2032
- Figure 88: Saudi Arabia Premium Bakery Products Volume (K Tons), by Distibution Channel 2024 & 2032
- Figure 89: Saudi Arabia Premium Bakery Products Revenue Share (%), by Distibution Channel 2024 & 2032
- Figure 90: Saudi Arabia Premium Bakery Products Volume Share (%), by Distibution Channel 2024 & 2032
- Figure 91: Saudi Arabia Premium Bakery Products Revenue (Million), by Country 2024 & 2032
- Figure 92: Saudi Arabia Premium Bakery Products Volume (K Tons), by Country 2024 & 2032
- Figure 93: Saudi Arabia Premium Bakery Products Revenue Share (%), by Country 2024 & 2032
- Figure 94: Saudi Arabia Premium Bakery Products Volume Share (%), by Country 2024 & 2032
List of Tables
- Table 1: Global Premium Bakery Products Revenue Million Forecast, by Region 2019 & 2032
- Table 2: Global Premium Bakery Products Volume K Tons Forecast, by Region 2019 & 2032
- Table 3: Global Premium Bakery Products Revenue Million Forecast, by Product Type 2019 & 2032
- Table 4: Global Premium Bakery Products Volume K Tons Forecast, by Product Type 2019 & 2032
- Table 5: Global Premium Bakery Products Revenue Million Forecast, by Distibution Channel 2019 & 2032
- Table 6: Global Premium Bakery Products Volume K Tons Forecast, by Distibution Channel 2019 & 2032
- Table 7: Global Premium Bakery Products Revenue Million Forecast, by Region 2019 & 2032
- Table 8: Global Premium Bakery Products Volume K Tons Forecast, by Region 2019 & 2032
- Table 9: Global Premium Bakery Products Revenue Million Forecast, by Country 2019 & 2032
- Table 10: Global Premium Bakery Products Volume K Tons Forecast, by Country 2019 & 2032
- Table 11: United States Premium Bakery Products Revenue (Million) Forecast, by Application 2019 & 2032
- Table 12: United States Premium Bakery Products Volume (K Tons) Forecast, by Application 2019 & 2032
- Table 13: Canada Premium Bakery Products Revenue (Million) Forecast, by Application 2019 & 2032
- Table 14: Canada Premium Bakery Products Volume (K Tons) Forecast, by Application 2019 & 2032
- Table 15: Mexico Premium Bakery Products Revenue (Million) Forecast, by Application 2019 & 2032
- Table 16: Mexico Premium Bakery Products Volume (K Tons) Forecast, by Application 2019 & 2032
- Table 17: Rest of North America Premium Bakery Products Revenue (Million) Forecast, by Application 2019 & 2032
- Table 18: Rest of North America Premium Bakery Products Volume (K Tons) Forecast, by Application 2019 & 2032
- Table 19: Global Premium Bakery Products Revenue Million Forecast, by Country 2019 & 2032
- Table 20: Global Premium Bakery Products Volume K Tons Forecast, by Country 2019 & 2032
- Table 21: United Kingdom Premium Bakery Products Revenue (Million) Forecast, by Application 2019 & 2032
- Table 22: United Kingdom Premium Bakery Products Volume (K Tons) Forecast, by Application 2019 & 2032
- Table 23: Germany Premium Bakery Products Revenue (Million) Forecast, by Application 2019 & 2032
- Table 24: Germany Premium Bakery Products Volume (K Tons) Forecast, by Application 2019 & 2032
- Table 25: Spain Premium Bakery Products Revenue (Million) Forecast, by Application 2019 & 2032
- Table 26: Spain Premium Bakery Products Volume (K Tons) Forecast, by Application 2019 & 2032
- Table 27: France Premium Bakery Products Revenue (Million) Forecast, by Application 2019 & 2032
- Table 28: France Premium Bakery Products Volume (K Tons) Forecast, by Application 2019 & 2032
- Table 29: Italy Premium Bakery Products Revenue (Million) Forecast, by Application 2019 & 2032
- Table 30: Italy Premium Bakery Products Volume (K Tons) Forecast, by Application 2019 & 2032
- Table 31: Russia Premium Bakery Products Revenue (Million) Forecast, by Application 2019 & 2032
- Table 32: Russia Premium Bakery Products Volume (K Tons) Forecast, by Application 2019 & 2032
- Table 33: Rest of Europe Premium Bakery Products Revenue (Million) Forecast, by Application 2019 & 2032
- Table 34: Rest of Europe Premium Bakery Products Volume (K Tons) Forecast, by Application 2019 & 2032
- Table 35: Global Premium Bakery Products Revenue Million Forecast, by Country 2019 & 2032
- Table 36: Global Premium Bakery Products Volume K Tons Forecast, by Country 2019 & 2032
- Table 37: China Premium Bakery Products Revenue (Million) Forecast, by Application 2019 & 2032
- Table 38: China Premium Bakery Products Volume (K Tons) Forecast, by Application 2019 & 2032
- Table 39: Japan Premium Bakery Products Revenue (Million) Forecast, by Application 2019 & 2032
- Table 40: Japan Premium Bakery Products Volume (K Tons) Forecast, by Application 2019 & 2032
- Table 41: India Premium Bakery Products Revenue (Million) Forecast, by Application 2019 & 2032
- Table 42: India Premium Bakery Products Volume (K Tons) Forecast, by Application 2019 & 2032
- Table 43: Australia Premium Bakery Products Revenue (Million) Forecast, by Application 2019 & 2032
- Table 44: Australia Premium Bakery Products Volume (K Tons) Forecast, by Application 2019 & 2032
- Table 45: Rest of Asia Pacific Premium Bakery Products Revenue (Million) Forecast, by Application 2019 & 2032
- Table 46: Rest of Asia Pacific Premium Bakery Products Volume (K Tons) Forecast, by Application 2019 & 2032
- Table 47: Global Premium Bakery Products Revenue Million Forecast, by Country 2019 & 2032
- Table 48: Global Premium Bakery Products Volume K Tons Forecast, by Country 2019 & 2032
- Table 49: Brazil Premium Bakery Products Revenue (Million) Forecast, by Application 2019 & 2032
- Table 50: Brazil Premium Bakery Products Volume (K Tons) Forecast, by Application 2019 & 2032
- Table 51: Argentina Premium Bakery Products Revenue (Million) Forecast, by Application 2019 & 2032
- Table 52: Argentina Premium Bakery Products Volume (K Tons) Forecast, by Application 2019 & 2032
- Table 53: Rest of South America Premium Bakery Products Revenue (Million) Forecast, by Application 2019 & 2032
- Table 54: Rest of South America Premium Bakery Products Volume (K Tons) Forecast, by Application 2019 & 2032
- Table 55: Global Premium Bakery Products Revenue Million Forecast, by Country 2019 & 2032
- Table 56: Global Premium Bakery Products Volume K Tons Forecast, by Country 2019 & 2032
- Table 57: UAE Premium Bakery Products Revenue (Million) Forecast, by Application 2019 & 2032
- Table 58: UAE Premium Bakery Products Volume (K Tons) Forecast, by Application 2019 & 2032
- Table 59: South Africa Premium Bakery Products Revenue (Million) Forecast, by Application 2019 & 2032
- Table 60: South Africa Premium Bakery Products Volume (K Tons) Forecast, by Application 2019 & 2032
- Table 61: Saudi Arabia Premium Bakery Products Revenue (Million) Forecast, by Application 2019 & 2032
- Table 62: Saudi Arabia Premium Bakery Products Volume (K Tons) Forecast, by Application 2019 & 2032
- Table 63: Rest of MEA Premium Bakery Products Revenue (Million) Forecast, by Application 2019 & 2032
- Table 64: Rest of MEA Premium Bakery Products Volume (K Tons) Forecast, by Application 2019 & 2032
- Table 65: Global Premium Bakery Products Revenue Million Forecast, by Product Type 2019 & 2032
- Table 66: Global Premium Bakery Products Volume K Tons Forecast, by Product Type 2019 & 2032
- Table 67: Global Premium Bakery Products Revenue Million Forecast, by Distibution Channel 2019 & 2032
- Table 68: Global Premium Bakery Products Volume K Tons Forecast, by Distibution Channel 2019 & 2032
- Table 69: Global Premium Bakery Products Revenue Million Forecast, by Country 2019 & 2032
- Table 70: Global Premium Bakery Products Volume K Tons Forecast, by Country 2019 & 2032
- Table 71: United States Premium Bakery Products Revenue (Million) Forecast, by Application 2019 & 2032
- Table 72: United States Premium Bakery Products Volume (K Tons) Forecast, by Application 2019 & 2032
- Table 73: Canada Premium Bakery Products Revenue (Million) Forecast, by Application 2019 & 2032
- Table 74: Canada Premium Bakery Products Volume (K Tons) Forecast, by Application 2019 & 2032
- Table 75: Mexico Premium Bakery Products Revenue (Million) Forecast, by Application 2019 & 2032
- Table 76: Mexico Premium Bakery Products Volume (K Tons) Forecast, by Application 2019 & 2032
- Table 77: Rest of North America Premium Bakery Products Revenue (Million) Forecast, by Application 2019 & 2032
- Table 78: Rest of North America Premium Bakery Products Volume (K Tons) Forecast, by Application 2019 & 2032
- Table 79: Global Premium Bakery Products Revenue Million Forecast, by Product Type 2019 & 2032
- Table 80: Global Premium Bakery Products Volume K Tons Forecast, by Product Type 2019 & 2032
- Table 81: Global Premium Bakery Products Revenue Million Forecast, by Distibution Channel 2019 & 2032
- Table 82: Global Premium Bakery Products Volume K Tons Forecast, by Distibution Channel 2019 & 2032
- Table 83: Global Premium Bakery Products Revenue Million Forecast, by Country 2019 & 2032
- Table 84: Global Premium Bakery Products Volume K Tons Forecast, by Country 2019 & 2032
- Table 85: United Kingdom Premium Bakery Products Revenue (Million) Forecast, by Application 2019 & 2032
- Table 86: United Kingdom Premium Bakery Products Volume (K Tons) Forecast, by Application 2019 & 2032
- Table 87: Germany Premium Bakery Products Revenue (Million) Forecast, by Application 2019 & 2032
- Table 88: Germany Premium Bakery Products Volume (K Tons) Forecast, by Application 2019 & 2032
- Table 89: Spain Premium Bakery Products Revenue (Million) Forecast, by Application 2019 & 2032
- Table 90: Spain Premium Bakery Products Volume (K Tons) Forecast, by Application 2019 & 2032
- Table 91: France Premium Bakery Products Revenue (Million) Forecast, by Application 2019 & 2032
- Table 92: France Premium Bakery Products Volume (K Tons) Forecast, by Application 2019 & 2032
- Table 93: Italy Premium Bakery Products Revenue (Million) Forecast, by Application 2019 & 2032
- Table 94: Italy Premium Bakery Products Volume (K Tons) Forecast, by Application 2019 & 2032
- Table 95: Russia Premium Bakery Products Revenue (Million) Forecast, by Application 2019 & 2032
- Table 96: Russia Premium Bakery Products Volume (K Tons) Forecast, by Application 2019 & 2032
- Table 97: Rest of Europe Premium Bakery Products Revenue (Million) Forecast, by Application 2019 & 2032
- Table 98: Rest of Europe Premium Bakery Products Volume (K Tons) Forecast, by Application 2019 & 2032
- Table 99: Global Premium Bakery Products Revenue Million Forecast, by Product Type 2019 & 2032
- Table 100: Global Premium Bakery Products Volume K Tons Forecast, by Product Type 2019 & 2032
- Table 101: Global Premium Bakery Products Revenue Million Forecast, by Distibution Channel 2019 & 2032
- Table 102: Global Premium Bakery Products Volume K Tons Forecast, by Distibution Channel 2019 & 2032
- Table 103: Global Premium Bakery Products Revenue Million Forecast, by Country 2019 & 2032
- Table 104: Global Premium Bakery Products Volume K Tons Forecast, by Country 2019 & 2032
- Table 105: China Premium Bakery Products Revenue (Million) Forecast, by Application 2019 & 2032
- Table 106: China Premium Bakery Products Volume (K Tons) Forecast, by Application 2019 & 2032
- Table 107: Japan Premium Bakery Products Revenue (Million) Forecast, by Application 2019 & 2032
- Table 108: Japan Premium Bakery Products Volume (K Tons) Forecast, by Application 2019 & 2032
- Table 109: India Premium Bakery Products Revenue (Million) Forecast, by Application 2019 & 2032
- Table 110: India Premium Bakery Products Volume (K Tons) Forecast, by Application 2019 & 2032
- Table 111: Australia Premium Bakery Products Revenue (Million) Forecast, by Application 2019 & 2032
- Table 112: Australia Premium Bakery Products Volume (K Tons) Forecast, by Application 2019 & 2032
- Table 113: Rest of Asia Pacific Premium Bakery Products Revenue (Million) Forecast, by Application 2019 & 2032
- Table 114: Rest of Asia Pacific Premium Bakery Products Volume (K Tons) Forecast, by Application 2019 & 2032
- Table 115: Global Premium Bakery Products Revenue Million Forecast, by Product Type 2019 & 2032
- Table 116: Global Premium Bakery Products Volume K Tons Forecast, by Product Type 2019 & 2032
- Table 117: Global Premium Bakery Products Revenue Million Forecast, by Distibution Channel 2019 & 2032
- Table 118: Global Premium Bakery Products Volume K Tons Forecast, by Distibution Channel 2019 & 2032
- Table 119: Global Premium Bakery Products Revenue Million Forecast, by Country 2019 & 2032
- Table 120: Global Premium Bakery Products Volume K Tons Forecast, by Country 2019 & 2032
- Table 121: Brazil Premium Bakery Products Revenue (Million) Forecast, by Application 2019 & 2032
- Table 122: Brazil Premium Bakery Products Volume (K Tons) Forecast, by Application 2019 & 2032
- Table 123: Argentina Premium Bakery Products Revenue (Million) Forecast, by Application 2019 & 2032
- Table 124: Argentina Premium Bakery Products Volume (K Tons) Forecast, by Application 2019 & 2032
- Table 125: Rest of South America Premium Bakery Products Revenue (Million) Forecast, by Application 2019 & 2032
- Table 126: Rest of South America Premium Bakery Products Volume (K Tons) Forecast, by Application 2019 & 2032
- Table 127: Global Premium Bakery Products Revenue Million Forecast, by Product Type 2019 & 2032
- Table 128: Global Premium Bakery Products Volume K Tons Forecast, by Product Type 2019 & 2032
- Table 129: Global Premium Bakery Products Revenue Million Forecast, by Distibution Channel 2019 & 2032
- Table 130: Global Premium Bakery Products Volume K Tons Forecast, by Distibution Channel 2019 & 2032
- Table 131: Global Premium Bakery Products Revenue Million Forecast, by Country 2019 & 2032
- Table 132: Global Premium Bakery Products Volume K Tons Forecast, by Country 2019 & 2032
- Table 133: Global Premium Bakery Products Revenue Million Forecast, by Product Type 2019 & 2032
- Table 134: Global Premium Bakery Products Volume K Tons Forecast, by Product Type 2019 & 2032
- Table 135: Global Premium Bakery Products Revenue Million Forecast, by Distibution Channel 2019 & 2032
- Table 136: Global Premium Bakery Products Volume K Tons Forecast, by Distibution Channel 2019 & 2032
- Table 137: Global Premium Bakery Products Revenue Million Forecast, by Country 2019 & 2032
- Table 138: Global Premium Bakery Products Volume K Tons Forecast, by Country 2019 & 2032
- Table 139: South Africa Premium Bakery Products Revenue (Million) Forecast, by Application 2019 & 2032
- Table 140: South Africa Premium Bakery Products Volume (K Tons) Forecast, by Application 2019 & 2032
- Table 141: Rest of Middle East Premium Bakery Products Revenue (Million) Forecast, by Application 2019 & 2032
- Table 142: Rest of Middle East Premium Bakery Products Volume (K Tons) Forecast, by Application 2019 & 2032
Frequently Asked Questions
1. What is the projected Compound Annual Growth Rate (CAGR) of the Premium Bakery Products?
The projected CAGR is approximately 6.25%.
2. Which companies are prominent players in the Premium Bakery Products?
Key companies in the market include BARILLA G E R FRATELLI SPA, General Mills Inc, Finsbury Food Group Plc, ALMARAI COMPANY, FUJI BAKING CO LTD, Associated British Foods plc, Mondelez International Inc, Bimbo Bakeries USA, Bakers Delight Holdings Limited, Britannia Industries Ltd*List Not Exhaustive.
3. What are the main segments of the Premium Bakery Products?
The market segments include Product Type, Distibution Channel.
4. Can you provide details about the market size?
The market size is estimated to be USD XX Million as of 2022.
5. What are some drivers contributing to market growth?
Innovation in Vanillin Synthesis; Diverse Functionality of Vanillin In End-use Industries.
6. What are the notable trends driving market growth?
Rising demand for premium healthy snacking options is driving the market.
7. Are there any restraints impacting market growth?
Supply Chain Variability Impacting Vanilla Bean Availability For Flavor Production.
8. Can you provide examples of recent developments in the market?
In April 2022, Walker's Shortbread is partnering with retailer Dufry for the launch of a new Global Travel Retailer range into more than 55 travel sites worldwide including France. The product range will include several types of shortbreads and other products in it.
9. What pricing options are available for accessing the report?
Pricing options include single-user, multi-user, and enterprise licenses priced at USD 4750, USD 5250, and USD 8750 respectively.
10. Is the market size provided in terms of value or volume?
The market size is provided in terms of value, measured in Million and volume, measured in K Tons.
11. Are there any specific market keywords associated with the report?
Yes, the market keyword associated with the report is "Premium Bakery Products," which aids in identifying and referencing the specific market segment covered.
12. How do I determine which pricing option suits my needs best?
The pricing options vary based on user requirements and access needs. Individual users may opt for single-user licenses, while businesses requiring broader access may choose multi-user or enterprise licenses for cost-effective access to the report.
13. Are there any additional resources or data provided in the Premium Bakery Products report?
While the report offers comprehensive insights, it's advisable to review the specific contents or supplementary materials provided to ascertain if additional resources or data are available.
14. How can I stay updated on further developments or reports in the Premium Bakery Products?
To stay informed about further developments, trends, and reports in the Premium Bakery Products, consider subscribing to industry newsletters, following relevant companies and organizations, or regularly checking reputable industry news sources and publications.
Methodology
Step 1 - Identification of Relevant Samples Size from Population Database


Step 2 - Approaches for Defining Global Market Size (Value, Volume* & Price*)

Note*: In applicable scenarios
Step 3 - Data Sources
Primary Research
- Web Analytics
- Survey Reports
- Research Institute
- Latest Research Reports
- Opinion Leaders
Secondary Research
- Annual Reports
- White Paper
- Latest Press Release
- Industry Association
- Paid Database
- Investor Presentations

Step 4 - Data Triangulation
Involves using different sources of information in order to increase the validity of a study
These sources are likely to be stakeholders in a program - participants, other researchers, program staff, other community members, and so on.
Then we put all data in single framework & apply various statistical tools to find out the dynamic on the market.
During the analysis stage, feedback from the stakeholder groups would be compared to determine areas of agreement as well as areas of divergence


