


Key Insights
The global polyurethane composites market is poised for significant expansion, with a projected compound annual growth rate (CAGR) of 5.96%. This growth, estimated from a base year of 2025, forecasts a market size of 870.93 million. Key drivers include the automotive industry's demand for lightweight, high-strength materials that enhance fuel efficiency and reduce emissions, aligning with sustainability goals. The construction sector benefits from polyurethane composites in insulation, roofing, and structural applications, offering superior thermal performance and durability. The burgeoning wind energy sector also significantly contributes, utilizing these composites for blade manufacturing due to their exceptional strength-to-weight ratio and fatigue resistance.
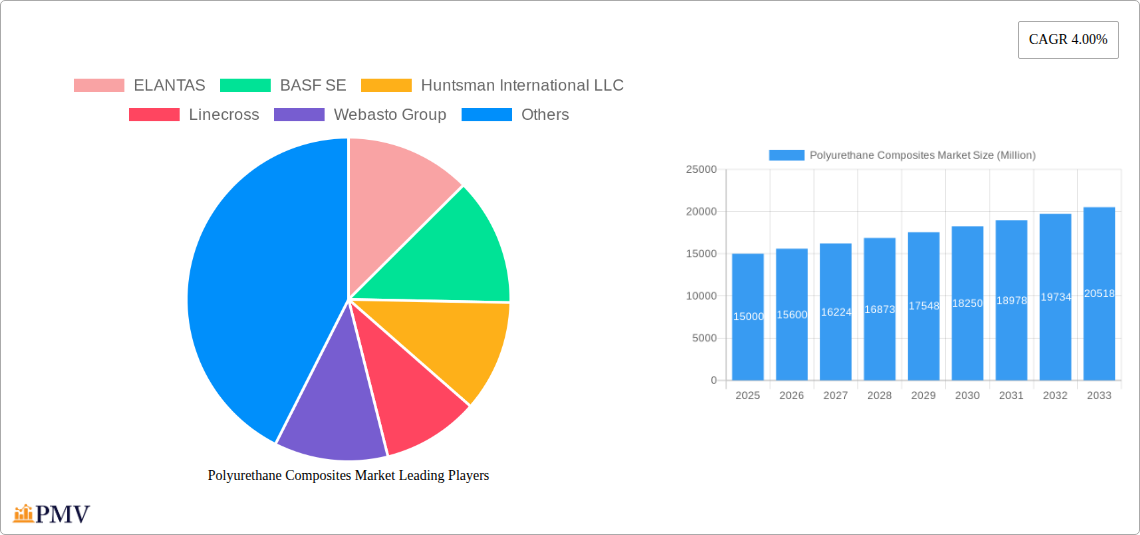
Polyurethane Composites Market Market Size (In Million)

Market growth is influenced by several factors. Volatile raw material prices, particularly for isocyanates and polyols, present profitability challenges. Environmental considerations in production and disposal necessitate sustainable solutions. Competition from alternative materials like fiberglass and carbon fiber composites also impacts market dynamics. Nevertheless, ongoing technological advancements in polyurethane composite formulations, enhancing strength, durability, and thermal performance, are anticipated to mitigate these challenges. The Asia Pacific region, particularly China and India, is expected to maintain a dominant market share due to robust industrial growth.

Polyurethane Composites Market Company Market Share
Polyurethane Composites Market: A Comprehensive Report (2019-2033)
This in-depth report provides a comprehensive analysis of the global Polyurethane Composites Market, offering valuable insights for industry stakeholders, investors, and researchers. Spanning the period from 2019 to 2033, with 2025 as the base year, this report meticulously examines market trends, competitive dynamics, and future growth prospects. The market is segmented by Fiber Type (Glass, Carbon, Others) and End-user Industry (Transportation, Building & Construction, Electrical & Electronics, Wind Energy, Others). The report projects a market size of xx Million by 2033, exhibiting a CAGR of xx% during the forecast period (2025-2033).
Polyurethane Composites Market Market Structure & Competitive Dynamics
The Polyurethane Composites market exhibits a moderately concentrated structure, with key players like BASF SE, Huntsman International LLC, and Covestro AG holding significant market share. The market is characterized by ongoing innovation in material formulations and processing techniques, driven by the need for lightweight, high-strength, and durable composites across various applications. Stringent environmental regulations concerning VOC emissions and material recyclability are shaping the industry landscape. Product substitution pressures exist from alternative materials like fiberglass-reinforced polymers and carbon fiber composites, depending on the specific application. End-user trends towards sustainability and improved fuel efficiency in transportation and energy efficiency in buildings are significant market drivers. M&A activity has been moderate in recent years, with deal values averaging xx Million annually. Several strategic alliances and joint ventures have been observed, indicating a focus on collaborative innovation and expansion into new markets. For example, the xx Million acquisition of Company X by Company Y in 2022 significantly altered the market landscape. Market share analysis reveals that BASF SE holds approximately xx%, Huntsman International LLC holds approximately xx%, and Covestro AG holds approximately xx% of the global market in 2025.
Polyurethane Composites Market Industry Trends & Insights
The Polyurethane Composites market is experiencing robust growth, primarily driven by increasing demand from the automotive, construction, and wind energy sectors. The rising adoption of lightweight materials to enhance fuel efficiency in vehicles and improve building energy performance is a key growth catalyst. Technological advancements in polyurethane formulations, such as the development of high-performance bio-based polyurethanes and improved processing techniques like resin transfer molding (RTM) are further fueling market expansion. Consumer preferences are shifting towards sustainable and eco-friendly products, prompting manufacturers to develop recyclable and biodegradable polyurethane composites. The competitive landscape is intensifying, with companies focusing on product differentiation, cost optimization, and expansion into new geographic markets. The market's CAGR is estimated to be xx% from 2025 to 2033, with market penetration increasing to xx% in key end-user industries. The report also analyzes shifts in consumer preferences towards sustainable and recycled materials.
Dominant Markets & Segments in Polyurethane Composites Market
The transportation sector dominates the polyurethane composites market, accounting for approximately xx Million in 2025. This is primarily driven by the increasing demand for lightweight vehicles to improve fuel economy and reduce emissions. Within the fiber type segment, glass fiber-reinforced polyurethane composites hold the largest market share due to their cost-effectiveness and good mechanical properties.
- Key Drivers in Transportation: Stringent fuel efficiency standards, increasing vehicle production, and the growing popularity of electric vehicles.
- Key Drivers in Building & Construction: Growing infrastructure development, increasing demand for energy-efficient buildings, and the rising adoption of prefabricated building components.
- Geographical Dominance: North America and Europe currently hold the largest market share, driven by strong automotive and construction industries and advanced technological infrastructure. However, Asia-Pacific is projected to experience the fastest growth rate due to rapid industrialization and increasing infrastructure spending.
The dominance of glass fiber-reinforced polyurethane composites in the overall market share stems from its cost-effectiveness and a robust balance of mechanical properties needed for many common applications. However, the carbon fiber segment is projected to witness the highest growth rate due to its superior strength-to-weight ratio, making it ideal for high-performance applications in aerospace and wind energy. The others segment represents niche applications with specialized material requirements.
Polyurethane Composites Market Product Innovations
Recent innovations focus on improving the mechanical properties, durability, and sustainability of polyurethane composites. New formulations incorporate bio-based materials and recycled content to reduce environmental impact. Advancements in processing techniques enable the production of complex shapes and improved surface finishes. These innovations cater to the increasing demand for lightweight, high-strength, and environmentally friendly materials across various applications. Competitive advantages are gained through superior material properties, cost-effective manufacturing processes, and strong intellectual property portfolios.
Report Segmentation & Scope
This report segments the polyurethane composites market by fiber type (glass, carbon, others) and end-user industry (transportation, building & construction, electrical & electronics, wind energy, others). The glass fiber segment is projected to maintain its dominance due to its cost-effectiveness, while the carbon fiber segment is expected to exhibit the highest growth rate due to its superior properties. The transportation segment currently holds the largest market share, driven by the automotive industry, while the building & construction segment is expected to experience significant growth due to increasing infrastructure development and the demand for energy-efficient buildings. The report provides detailed analysis of market size, growth projections, and competitive dynamics for each segment.
Key Drivers of Polyurethane Composites Market Growth
Several factors are driving the growth of the polyurethane composites market. These include:
- Increasing demand for lightweight materials in the automotive and aerospace industries to improve fuel efficiency and reduce emissions.
- The growing construction industry and the need for energy-efficient buildings are driving demand for high-performance insulation materials.
- Technological advancements leading to the development of stronger, more durable, and sustainable polyurethane composites.
- Favorable government regulations and incentives promoting the use of environmentally friendly materials.
Challenges in the Polyurethane Composites Market Sector
The polyurethane composites market faces several challenges, including:
- Fluctuations in raw material prices, especially for isocyanates and polyols, impacting production costs.
- Stringent environmental regulations regarding volatile organic compound (VOC) emissions and waste disposal.
- Intense competition from alternative materials, such as fiberglass-reinforced polymers and carbon fiber composites.
- The need for continuous innovation to meet the evolving demands of end-user industries.
Leading Players in the Polyurethane Composites Market Market
Key Developments in Polyurethane Composites Market Sector
- January 2023: BASF SE launched a new bio-based polyurethane composite for automotive applications.
- March 2022: Covestro AG announced a strategic partnership with a leading wind turbine manufacturer to develop high-performance polyurethane composites for wind energy applications.
- June 2021: Huntsman International LLC invested xx Million in expanding its polyurethane composites production capacity.
Strategic Polyurethane Composites Market Market Outlook
The polyurethane composites market presents significant growth opportunities in the coming years. Continued technological advancements, increasing demand from key end-user industries, and the growing focus on sustainability will drive market expansion. Strategic partnerships, investments in research and development, and expansion into new geographic markets will be crucial for success in this competitive landscape. The market is poised for sustained growth, with particularly strong potential in emerging economies experiencing rapid industrialization and infrastructure development. The focus on sustainable and recyclable materials will further shape future market dynamics.
Polyurethane Composites Market Segmentation
-
1. Fiber Type
- 1.1. Glass
- 1.2. Carbon
- 1.3. Others
-
2. End-user Industry
- 2.1. Transportation
- 2.2. Building & Construction
- 2.3. Electrical & Electronics
- 2.4. Wind Energy
- 2.5. Others
Polyurethane Composites Market Segmentation By Geography
-
1. Asia Pacific
- 1.1. China
- 1.2. India
- 1.3. Japan
- 1.4. South Korea
- 1.5. Rest of Asia Pacific
-
2. North America
- 2.1. United States
- 2.2. Canada
- 2.3. Mexico
-
3. Europe
- 3.1. Germany
- 3.2. United Kingdom
- 3.3. Italy
- 3.4. France
- 3.5. Rest of Europe
-
4. South America
- 4.1. Brazil
- 4.2. Argentina
- 4.3. Rest of South America
-
5. Middle East and Africa
- 5.1. Saudi Arabia
- 5.2. South Africa
- 5.3. Rest of Middle East and Africa

Polyurethane Composites Market Regional Market Share
Geographic Coverage of Polyurethane Composites Market
Polyurethane Composites Market REPORT HIGHLIGHTS
| Aspects | Details |
|---|---|
| Study Period | 2020-2034 |
| Base Year | 2025 |
| Estimated Year | 2026 |
| Forecast Period | 2026-2034 |
| Historical Period | 2020-2025 |
| Growth Rate | CAGR of 5.96% from 2020-2034 |
| Segmentation |
|
Table of Contents
- 1. Introduction
- 1.1. Research Scope
- 1.2. Market Segmentation
- 1.3. Research Methodology
- 1.4. Definitions and Assumptions
- 2. Executive Summary
- 2.1. Introduction
- 3. Market Dynamics
- 3.1. Introduction
- 3.2. Market Drivers
- 3.2.1. ; Increasing Demand for the Lightweight Materials From the Transportation Industry; Growing Demand from the Building and Construction Industry
- 3.3. Market Restrains
- 3.3.1. ; Slowdown in the Global Automotive Production; High Production Costs
- 3.4. Market Trends
- 3.4.1. Increasing demand from the Transportation Industry
- 4. Market Factor Analysis
- 4.1. Porters Five Forces
- 4.2. Supply/Value Chain
- 4.3. PESTEL analysis
- 4.4. Market Entropy
- 4.5. Patent/Trademark Analysis
- 5. Global Polyurethane Composites Market Analysis, Insights and Forecast, 2020-2032
- 5.1. Market Analysis, Insights and Forecast - by Fiber Type
- 5.1.1. Glass
- 5.1.2. Carbon
- 5.1.3. Others
- 5.2. Market Analysis, Insights and Forecast - by End-user Industry
- 5.2.1. Transportation
- 5.2.2. Building & Construction
- 5.2.3. Electrical & Electronics
- 5.2.4. Wind Energy
- 5.2.5. Others
- 5.3. Market Analysis, Insights and Forecast - by Region
- 5.3.1. Asia Pacific
- 5.3.2. North America
- 5.3.3. Europe
- 5.3.4. South America
- 5.3.5. Middle East and Africa
- 5.1. Market Analysis, Insights and Forecast - by Fiber Type
- 6. Asia Pacific Polyurethane Composites Market Analysis, Insights and Forecast, 2020-2032
- 6.1. Market Analysis, Insights and Forecast - by Fiber Type
- 6.1.1. Glass
- 6.1.2. Carbon
- 6.1.3. Others
- 6.2. Market Analysis, Insights and Forecast - by End-user Industry
- 6.2.1. Transportation
- 6.2.2. Building & Construction
- 6.2.3. Electrical & Electronics
- 6.2.4. Wind Energy
- 6.2.5. Others
- 6.1. Market Analysis, Insights and Forecast - by Fiber Type
- 7. North America Polyurethane Composites Market Analysis, Insights and Forecast, 2020-2032
- 7.1. Market Analysis, Insights and Forecast - by Fiber Type
- 7.1.1. Glass
- 7.1.2. Carbon
- 7.1.3. Others
- 7.2. Market Analysis, Insights and Forecast - by End-user Industry
- 7.2.1. Transportation
- 7.2.2. Building & Construction
- 7.2.3. Electrical & Electronics
- 7.2.4. Wind Energy
- 7.2.5. Others
- 7.1. Market Analysis, Insights and Forecast - by Fiber Type
- 8. Europe Polyurethane Composites Market Analysis, Insights and Forecast, 2020-2032
- 8.1. Market Analysis, Insights and Forecast - by Fiber Type
- 8.1.1. Glass
- 8.1.2. Carbon
- 8.1.3. Others
- 8.2. Market Analysis, Insights and Forecast - by End-user Industry
- 8.2.1. Transportation
- 8.2.2. Building & Construction
- 8.2.3. Electrical & Electronics
- 8.2.4. Wind Energy
- 8.2.5. Others
- 8.1. Market Analysis, Insights and Forecast - by Fiber Type
- 9. South America Polyurethane Composites Market Analysis, Insights and Forecast, 2020-2032
- 9.1. Market Analysis, Insights and Forecast - by Fiber Type
- 9.1.1. Glass
- 9.1.2. Carbon
- 9.1.3. Others
- 9.2. Market Analysis, Insights and Forecast - by End-user Industry
- 9.2.1. Transportation
- 9.2.2. Building & Construction
- 9.2.3. Electrical & Electronics
- 9.2.4. Wind Energy
- 9.2.5. Others
- 9.1. Market Analysis, Insights and Forecast - by Fiber Type
- 10. Middle East and Africa Polyurethane Composites Market Analysis, Insights and Forecast, 2020-2032
- 10.1. Market Analysis, Insights and Forecast - by Fiber Type
- 10.1.1. Glass
- 10.1.2. Carbon
- 10.1.3. Others
- 10.2. Market Analysis, Insights and Forecast - by End-user Industry
- 10.2.1. Transportation
- 10.2.2. Building & Construction
- 10.2.3. Electrical & Electronics
- 10.2.4. Wind Energy
- 10.2.5. Others
- 10.1. Market Analysis, Insights and Forecast - by Fiber Type
- 11. Competitive Analysis
- 11.1. Global Market Share Analysis 2025
- 11.2. Company Profiles
- 11.2.1 ELANTAS
- 11.2.1.1. Overview
- 11.2.1.2. Products
- 11.2.1.3. SWOT Analysis
- 11.2.1.4. Recent Developments
- 11.2.1.5. Financials (Based on Availability)
- 11.2.2 BASF SE
- 11.2.2.1. Overview
- 11.2.2.2. Products
- 11.2.2.3. SWOT Analysis
- 11.2.2.4. Recent Developments
- 11.2.2.5. Financials (Based on Availability)
- 11.2.3 Huntsman International LLC
- 11.2.3.1. Overview
- 11.2.3.2. Products
- 11.2.3.3. SWOT Analysis
- 11.2.3.4. Recent Developments
- 11.2.3.5. Financials (Based on Availability)
- 11.2.4 Linecross
- 11.2.4.1. Overview
- 11.2.4.2. Products
- 11.2.4.3. SWOT Analysis
- 11.2.4.4. Recent Developments
- 11.2.4.5. Financials (Based on Availability)
- 11.2.5 Webasto Group
- 11.2.5.1. Overview
- 11.2.5.2. Products
- 11.2.5.3. SWOT Analysis
- 11.2.5.4. Recent Developments
- 11.2.5.5. Financials (Based on Availability)
- 11.2.6 Henkel Corporation
- 11.2.6.1. Overview
- 11.2.6.2. Products
- 11.2.6.3. SWOT Analysis
- 11.2.6.4. Recent Developments
- 11.2.6.5. Financials (Based on Availability)
- 11.2.7 Covestro AG
- 11.2.7.1. Overview
- 11.2.7.2. Products
- 11.2.7.3. SWOT Analysis
- 11.2.7.4. Recent Developments
- 11.2.7.5. Financials (Based on Availability)
- 11.2.1 ELANTAS
List of Figures
- Figure 1: Global Polyurethane Composites Market Revenue Breakdown (million, %) by Region 2025 & 2033
- Figure 2: Global Polyurethane Composites Market Volume Breakdown (grams per cubic centimeter , %) by Region 2025 & 2033
- Figure 3: Asia Pacific Polyurethane Composites Market Revenue (million), by Fiber Type 2025 & 2033
- Figure 4: Asia Pacific Polyurethane Composites Market Volume (grams per cubic centimeter ), by Fiber Type 2025 & 2033
- Figure 5: Asia Pacific Polyurethane Composites Market Revenue Share (%), by Fiber Type 2025 & 2033
- Figure 6: Asia Pacific Polyurethane Composites Market Volume Share (%), by Fiber Type 2025 & 2033
- Figure 7: Asia Pacific Polyurethane Composites Market Revenue (million), by End-user Industry 2025 & 2033
- Figure 8: Asia Pacific Polyurethane Composites Market Volume (grams per cubic centimeter ), by End-user Industry 2025 & 2033
- Figure 9: Asia Pacific Polyurethane Composites Market Revenue Share (%), by End-user Industry 2025 & 2033
- Figure 10: Asia Pacific Polyurethane Composites Market Volume Share (%), by End-user Industry 2025 & 2033
- Figure 11: Asia Pacific Polyurethane Composites Market Revenue (million), by Country 2025 & 2033
- Figure 12: Asia Pacific Polyurethane Composites Market Volume (grams per cubic centimeter ), by Country 2025 & 2033
- Figure 13: Asia Pacific Polyurethane Composites Market Revenue Share (%), by Country 2025 & 2033
- Figure 14: Asia Pacific Polyurethane Composites Market Volume Share (%), by Country 2025 & 2033
- Figure 15: North America Polyurethane Composites Market Revenue (million), by Fiber Type 2025 & 2033
- Figure 16: North America Polyurethane Composites Market Volume (grams per cubic centimeter ), by Fiber Type 2025 & 2033
- Figure 17: North America Polyurethane Composites Market Revenue Share (%), by Fiber Type 2025 & 2033
- Figure 18: North America Polyurethane Composites Market Volume Share (%), by Fiber Type 2025 & 2033
- Figure 19: North America Polyurethane Composites Market Revenue (million), by End-user Industry 2025 & 2033
- Figure 20: North America Polyurethane Composites Market Volume (grams per cubic centimeter ), by End-user Industry 2025 & 2033
- Figure 21: North America Polyurethane Composites Market Revenue Share (%), by End-user Industry 2025 & 2033
- Figure 22: North America Polyurethane Composites Market Volume Share (%), by End-user Industry 2025 & 2033
- Figure 23: North America Polyurethane Composites Market Revenue (million), by Country 2025 & 2033
- Figure 24: North America Polyurethane Composites Market Volume (grams per cubic centimeter ), by Country 2025 & 2033
- Figure 25: North America Polyurethane Composites Market Revenue Share (%), by Country 2025 & 2033
- Figure 26: North America Polyurethane Composites Market Volume Share (%), by Country 2025 & 2033
- Figure 27: Europe Polyurethane Composites Market Revenue (million), by Fiber Type 2025 & 2033
- Figure 28: Europe Polyurethane Composites Market Volume (grams per cubic centimeter ), by Fiber Type 2025 & 2033
- Figure 29: Europe Polyurethane Composites Market Revenue Share (%), by Fiber Type 2025 & 2033
- Figure 30: Europe Polyurethane Composites Market Volume Share (%), by Fiber Type 2025 & 2033
- Figure 31: Europe Polyurethane Composites Market Revenue (million), by End-user Industry 2025 & 2033
- Figure 32: Europe Polyurethane Composites Market Volume (grams per cubic centimeter ), by End-user Industry 2025 & 2033
- Figure 33: Europe Polyurethane Composites Market Revenue Share (%), by End-user Industry 2025 & 2033
- Figure 34: Europe Polyurethane Composites Market Volume Share (%), by End-user Industry 2025 & 2033
- Figure 35: Europe Polyurethane Composites Market Revenue (million), by Country 2025 & 2033
- Figure 36: Europe Polyurethane Composites Market Volume (grams per cubic centimeter ), by Country 2025 & 2033
- Figure 37: Europe Polyurethane Composites Market Revenue Share (%), by Country 2025 & 2033
- Figure 38: Europe Polyurethane Composites Market Volume Share (%), by Country 2025 & 2033
- Figure 39: South America Polyurethane Composites Market Revenue (million), by Fiber Type 2025 & 2033
- Figure 40: South America Polyurethane Composites Market Volume (grams per cubic centimeter ), by Fiber Type 2025 & 2033
- Figure 41: South America Polyurethane Composites Market Revenue Share (%), by Fiber Type 2025 & 2033
- Figure 42: South America Polyurethane Composites Market Volume Share (%), by Fiber Type 2025 & 2033
- Figure 43: South America Polyurethane Composites Market Revenue (million), by End-user Industry 2025 & 2033
- Figure 44: South America Polyurethane Composites Market Volume (grams per cubic centimeter ), by End-user Industry 2025 & 2033
- Figure 45: South America Polyurethane Composites Market Revenue Share (%), by End-user Industry 2025 & 2033
- Figure 46: South America Polyurethane Composites Market Volume Share (%), by End-user Industry 2025 & 2033
- Figure 47: South America Polyurethane Composites Market Revenue (million), by Country 2025 & 2033
- Figure 48: South America Polyurethane Composites Market Volume (grams per cubic centimeter ), by Country 2025 & 2033
- Figure 49: South America Polyurethane Composites Market Revenue Share (%), by Country 2025 & 2033
- Figure 50: South America Polyurethane Composites Market Volume Share (%), by Country 2025 & 2033
- Figure 51: Middle East and Africa Polyurethane Composites Market Revenue (million), by Fiber Type 2025 & 2033
- Figure 52: Middle East and Africa Polyurethane Composites Market Volume (grams per cubic centimeter ), by Fiber Type 2025 & 2033
- Figure 53: Middle East and Africa Polyurethane Composites Market Revenue Share (%), by Fiber Type 2025 & 2033
- Figure 54: Middle East and Africa Polyurethane Composites Market Volume Share (%), by Fiber Type 2025 & 2033
- Figure 55: Middle East and Africa Polyurethane Composites Market Revenue (million), by End-user Industry 2025 & 2033
- Figure 56: Middle East and Africa Polyurethane Composites Market Volume (grams per cubic centimeter ), by End-user Industry 2025 & 2033
- Figure 57: Middle East and Africa Polyurethane Composites Market Revenue Share (%), by End-user Industry 2025 & 2033
- Figure 58: Middle East and Africa Polyurethane Composites Market Volume Share (%), by End-user Industry 2025 & 2033
- Figure 59: Middle East and Africa Polyurethane Composites Market Revenue (million), by Country 2025 & 2033
- Figure 60: Middle East and Africa Polyurethane Composites Market Volume (grams per cubic centimeter ), by Country 2025 & 2033
- Figure 61: Middle East and Africa Polyurethane Composites Market Revenue Share (%), by Country 2025 & 2033
- Figure 62: Middle East and Africa Polyurethane Composites Market Volume Share (%), by Country 2025 & 2033
List of Tables
- Table 1: Global Polyurethane Composites Market Revenue million Forecast, by Fiber Type 2020 & 2033
- Table 2: Global Polyurethane Composites Market Volume grams per cubic centimeter Forecast, by Fiber Type 2020 & 2033
- Table 3: Global Polyurethane Composites Market Revenue million Forecast, by End-user Industry 2020 & 2033
- Table 4: Global Polyurethane Composites Market Volume grams per cubic centimeter Forecast, by End-user Industry 2020 & 2033
- Table 5: Global Polyurethane Composites Market Revenue million Forecast, by Region 2020 & 2033
- Table 6: Global Polyurethane Composites Market Volume grams per cubic centimeter Forecast, by Region 2020 & 2033
- Table 7: Global Polyurethane Composites Market Revenue million Forecast, by Fiber Type 2020 & 2033
- Table 8: Global Polyurethane Composites Market Volume grams per cubic centimeter Forecast, by Fiber Type 2020 & 2033
- Table 9: Global Polyurethane Composites Market Revenue million Forecast, by End-user Industry 2020 & 2033
- Table 10: Global Polyurethane Composites Market Volume grams per cubic centimeter Forecast, by End-user Industry 2020 & 2033
- Table 11: Global Polyurethane Composites Market Revenue million Forecast, by Country 2020 & 2033
- Table 12: Global Polyurethane Composites Market Volume grams per cubic centimeter Forecast, by Country 2020 & 2033
- Table 13: China Polyurethane Composites Market Revenue (million) Forecast, by Application 2020 & 2033
- Table 14: China Polyurethane Composites Market Volume (grams per cubic centimeter ) Forecast, by Application 2020 & 2033
- Table 15: India Polyurethane Composites Market Revenue (million) Forecast, by Application 2020 & 2033
- Table 16: India Polyurethane Composites Market Volume (grams per cubic centimeter ) Forecast, by Application 2020 & 2033
- Table 17: Japan Polyurethane Composites Market Revenue (million) Forecast, by Application 2020 & 2033
- Table 18: Japan Polyurethane Composites Market Volume (grams per cubic centimeter ) Forecast, by Application 2020 & 2033
- Table 19: South Korea Polyurethane Composites Market Revenue (million) Forecast, by Application 2020 & 2033
- Table 20: South Korea Polyurethane Composites Market Volume (grams per cubic centimeter ) Forecast, by Application 2020 & 2033
- Table 21: Rest of Asia Pacific Polyurethane Composites Market Revenue (million) Forecast, by Application 2020 & 2033
- Table 22: Rest of Asia Pacific Polyurethane Composites Market Volume (grams per cubic centimeter ) Forecast, by Application 2020 & 2033
- Table 23: Global Polyurethane Composites Market Revenue million Forecast, by Fiber Type 2020 & 2033
- Table 24: Global Polyurethane Composites Market Volume grams per cubic centimeter Forecast, by Fiber Type 2020 & 2033
- Table 25: Global Polyurethane Composites Market Revenue million Forecast, by End-user Industry 2020 & 2033
- Table 26: Global Polyurethane Composites Market Volume grams per cubic centimeter Forecast, by End-user Industry 2020 & 2033
- Table 27: Global Polyurethane Composites Market Revenue million Forecast, by Country 2020 & 2033
- Table 28: Global Polyurethane Composites Market Volume grams per cubic centimeter Forecast, by Country 2020 & 2033
- Table 29: United States Polyurethane Composites Market Revenue (million) Forecast, by Application 2020 & 2033
- Table 30: United States Polyurethane Composites Market Volume (grams per cubic centimeter ) Forecast, by Application 2020 & 2033
- Table 31: Canada Polyurethane Composites Market Revenue (million) Forecast, by Application 2020 & 2033
- Table 32: Canada Polyurethane Composites Market Volume (grams per cubic centimeter ) Forecast, by Application 2020 & 2033
- Table 33: Mexico Polyurethane Composites Market Revenue (million) Forecast, by Application 2020 & 2033
- Table 34: Mexico Polyurethane Composites Market Volume (grams per cubic centimeter ) Forecast, by Application 2020 & 2033
- Table 35: Global Polyurethane Composites Market Revenue million Forecast, by Fiber Type 2020 & 2033
- Table 36: Global Polyurethane Composites Market Volume grams per cubic centimeter Forecast, by Fiber Type 2020 & 2033
- Table 37: Global Polyurethane Composites Market Revenue million Forecast, by End-user Industry 2020 & 2033
- Table 38: Global Polyurethane Composites Market Volume grams per cubic centimeter Forecast, by End-user Industry 2020 & 2033
- Table 39: Global Polyurethane Composites Market Revenue million Forecast, by Country 2020 & 2033
- Table 40: Global Polyurethane Composites Market Volume grams per cubic centimeter Forecast, by Country 2020 & 2033
- Table 41: Germany Polyurethane Composites Market Revenue (million) Forecast, by Application 2020 & 2033
- Table 42: Germany Polyurethane Composites Market Volume (grams per cubic centimeter ) Forecast, by Application 2020 & 2033
- Table 43: United Kingdom Polyurethane Composites Market Revenue (million) Forecast, by Application 2020 & 2033
- Table 44: United Kingdom Polyurethane Composites Market Volume (grams per cubic centimeter ) Forecast, by Application 2020 & 2033
- Table 45: Italy Polyurethane Composites Market Revenue (million) Forecast, by Application 2020 & 2033
- Table 46: Italy Polyurethane Composites Market Volume (grams per cubic centimeter ) Forecast, by Application 2020 & 2033
- Table 47: France Polyurethane Composites Market Revenue (million) Forecast, by Application 2020 & 2033
- Table 48: France Polyurethane Composites Market Volume (grams per cubic centimeter ) Forecast, by Application 2020 & 2033
- Table 49: Rest of Europe Polyurethane Composites Market Revenue (million) Forecast, by Application 2020 & 2033
- Table 50: Rest of Europe Polyurethane Composites Market Volume (grams per cubic centimeter ) Forecast, by Application 2020 & 2033
- Table 51: Global Polyurethane Composites Market Revenue million Forecast, by Fiber Type 2020 & 2033
- Table 52: Global Polyurethane Composites Market Volume grams per cubic centimeter Forecast, by Fiber Type 2020 & 2033
- Table 53: Global Polyurethane Composites Market Revenue million Forecast, by End-user Industry 2020 & 2033
- Table 54: Global Polyurethane Composites Market Volume grams per cubic centimeter Forecast, by End-user Industry 2020 & 2033
- Table 55: Global Polyurethane Composites Market Revenue million Forecast, by Country 2020 & 2033
- Table 56: Global Polyurethane Composites Market Volume grams per cubic centimeter Forecast, by Country 2020 & 2033
- Table 57: Brazil Polyurethane Composites Market Revenue (million) Forecast, by Application 2020 & 2033
- Table 58: Brazil Polyurethane Composites Market Volume (grams per cubic centimeter ) Forecast, by Application 2020 & 2033
- Table 59: Argentina Polyurethane Composites Market Revenue (million) Forecast, by Application 2020 & 2033
- Table 60: Argentina Polyurethane Composites Market Volume (grams per cubic centimeter ) Forecast, by Application 2020 & 2033
- Table 61: Rest of South America Polyurethane Composites Market Revenue (million) Forecast, by Application 2020 & 2033
- Table 62: Rest of South America Polyurethane Composites Market Volume (grams per cubic centimeter ) Forecast, by Application 2020 & 2033
- Table 63: Global Polyurethane Composites Market Revenue million Forecast, by Fiber Type 2020 & 2033
- Table 64: Global Polyurethane Composites Market Volume grams per cubic centimeter Forecast, by Fiber Type 2020 & 2033
- Table 65: Global Polyurethane Composites Market Revenue million Forecast, by End-user Industry 2020 & 2033
- Table 66: Global Polyurethane Composites Market Volume grams per cubic centimeter Forecast, by End-user Industry 2020 & 2033
- Table 67: Global Polyurethane Composites Market Revenue million Forecast, by Country 2020 & 2033
- Table 68: Global Polyurethane Composites Market Volume grams per cubic centimeter Forecast, by Country 2020 & 2033
- Table 69: Saudi Arabia Polyurethane Composites Market Revenue (million) Forecast, by Application 2020 & 2033
- Table 70: Saudi Arabia Polyurethane Composites Market Volume (grams per cubic centimeter ) Forecast, by Application 2020 & 2033
- Table 71: South Africa Polyurethane Composites Market Revenue (million) Forecast, by Application 2020 & 2033
- Table 72: South Africa Polyurethane Composites Market Volume (grams per cubic centimeter ) Forecast, by Application 2020 & 2033
- Table 73: Rest of Middle East and Africa Polyurethane Composites Market Revenue (million) Forecast, by Application 2020 & 2033
- Table 74: Rest of Middle East and Africa Polyurethane Composites Market Volume (grams per cubic centimeter ) Forecast, by Application 2020 & 2033
Frequently Asked Questions
1. What is the projected Compound Annual Growth Rate (CAGR) of the Polyurethane Composites Market?
The projected CAGR is approximately 5.96%.
2. Which companies are prominent players in the Polyurethane Composites Market?
Key companies in the market include ELANTAS, BASF SE, Huntsman International LLC, Linecross, Webasto Group, Henkel Corporation, Covestro AG.
3. What are the main segments of the Polyurethane Composites Market?
The market segments include Fiber Type, End-user Industry.
4. Can you provide details about the market size?
The market size is estimated to be USD 870.93 million as of 2022.
5. What are some drivers contributing to market growth?
; Increasing Demand for the Lightweight Materials From the Transportation Industry; Growing Demand from the Building and Construction Industry.
6. What are the notable trends driving market growth?
Increasing demand from the Transportation Industry.
7. Are there any restraints impacting market growth?
; Slowdown in the Global Automotive Production; High Production Costs.
8. Can you provide examples of recent developments in the market?
N/A
9. What pricing options are available for accessing the report?
Pricing options include single-user, multi-user, and enterprise licenses priced at USD 4750, USD 5250, and USD 8750 respectively.
10. Is the market size provided in terms of value or volume?
The market size is provided in terms of value, measured in million and volume, measured in grams per cubic centimeter .
11. Are there any specific market keywords associated with the report?
Yes, the market keyword associated with the report is "Polyurethane Composites Market," which aids in identifying and referencing the specific market segment covered.
12. How do I determine which pricing option suits my needs best?
The pricing options vary based on user requirements and access needs. Individual users may opt for single-user licenses, while businesses requiring broader access may choose multi-user or enterprise licenses for cost-effective access to the report.
13. Are there any additional resources or data provided in the Polyurethane Composites Market report?
While the report offers comprehensive insights, it's advisable to review the specific contents or supplementary materials provided to ascertain if additional resources or data are available.
14. How can I stay updated on further developments or reports in the Polyurethane Composites Market?
To stay informed about further developments, trends, and reports in the Polyurethane Composites Market, consider subscribing to industry newsletters, following relevant companies and organizations, or regularly checking reputable industry news sources and publications.
Methodology
Step 1 - Identification of Relevant Samples Size from Population Database


Step 2 - Approaches for Defining Global Market Size (Value, Volume* & Price*)

Note*: In applicable scenarios
Step 3 - Data Sources
Primary Research
- Web Analytics
- Survey Reports
- Research Institute
- Latest Research Reports
- Opinion Leaders
Secondary Research
- Annual Reports
- White Paper
- Latest Press Release
- Industry Association
- Paid Database
- Investor Presentations

Step 4 - Data Triangulation
Involves using different sources of information in order to increase the validity of a study
These sources are likely to be stakeholders in a program - participants, other researchers, program staff, other community members, and so on.
Then we put all data in single framework & apply various statistical tools to find out the dynamic on the market.
During the analysis stage, feedback from the stakeholder groups would be compared to determine areas of agreement as well as areas of divergence