
Key Insights
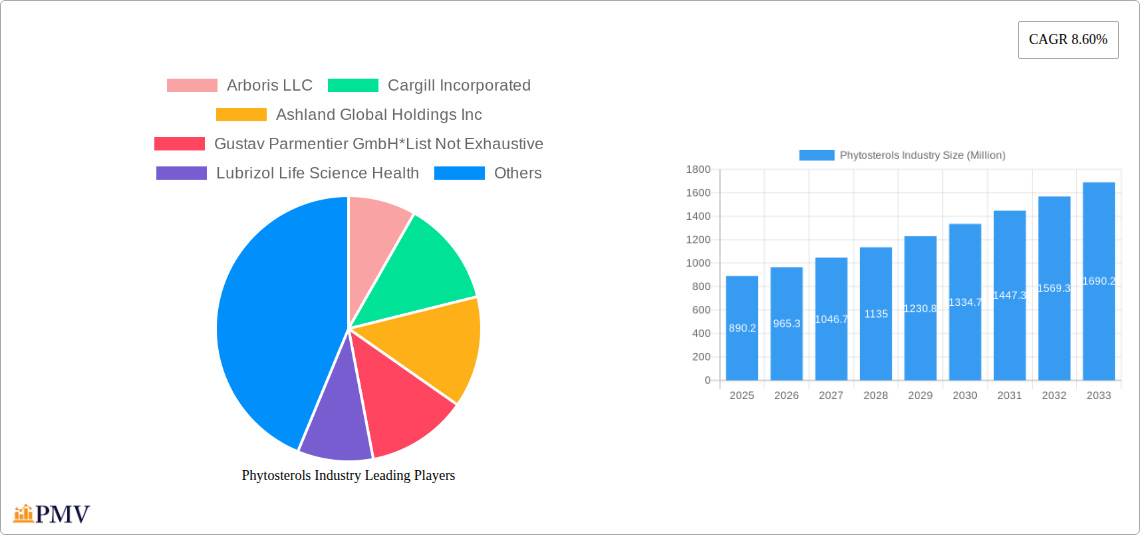
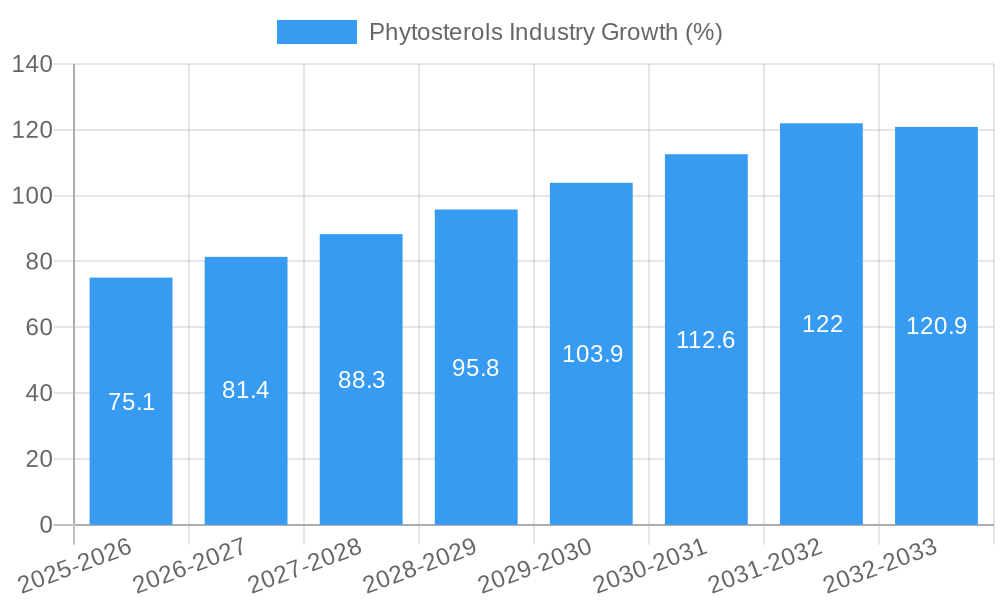
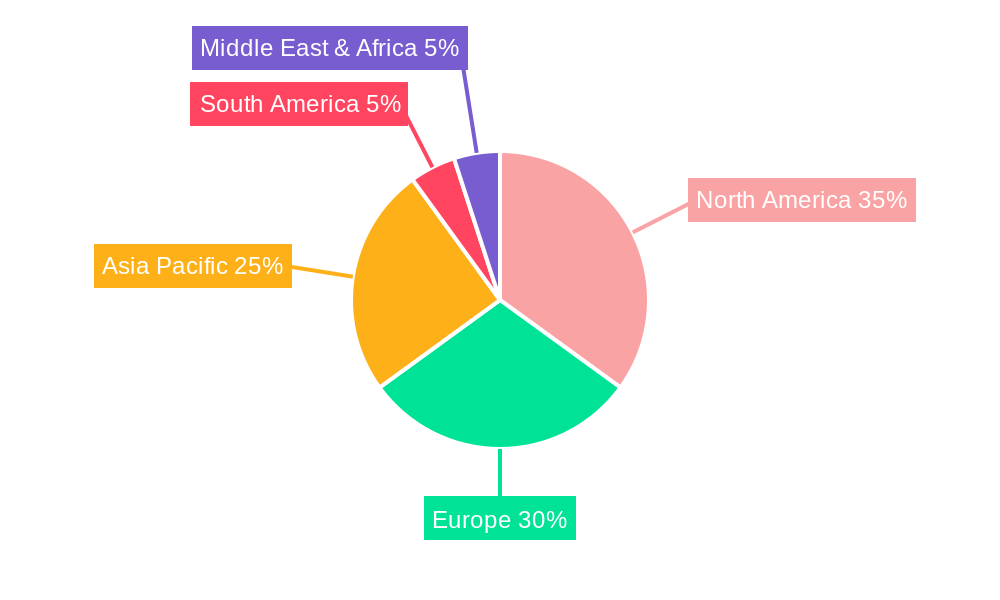
The phytosterols market, valued at $890.2 million in 2025, is projected to experience robust growth, driven by increasing consumer awareness of health benefits and rising demand for cholesterol-lowering products. The market's Compound Annual Growth Rate (CAGR) of 8.60% from 2019 to 2024 suggests a continued upward trajectory through 2033. Key drivers include the expanding functional food and beverage sector, growing adoption of phytosterols in dietary supplements and pharmaceuticals for heart health management, and increasing use in cosmetics for skincare applications. The diverse applications across various industries, including food & beverages (particularly bakery and confectionery), pharmaceuticals, cosmetics, and animal feed, contribute to market expansion. Significant regional markets include North America, Europe, and Asia Pacific, with each exhibiting unique growth patterns influenced by factors like consumer preferences, regulatory landscapes, and economic development. Competition among established players like Cargill, Ashland, and BASF, alongside emerging companies, fuels innovation and product diversification, driving further market expansion.
The market segmentation reveals a strong contribution from Beta-Sitosterol, Campesterol, and Stigmasterol as dominant product types. This is driven by their established efficacy in cholesterol reduction and widespread acceptance across diverse applications. The food and beverage sector, including bakery and confectionery, is expected to maintain a significant share due to the increasing integration of phytosterols into functional foods. However, the market faces some restraints, including fluctuations in raw material prices and potential regulatory challenges concerning health claims related to cholesterol reduction. Further research and development in innovative applications, coupled with strategic partnerships and expansion into new geographical markets, will be crucial for continued market growth. The forecast period (2025-2033) promises substantial opportunities for industry players to capitalize on the growing demand for natural and effective health solutions.
Phytosterols Industry: A Comprehensive Market Report (2019-2033)
This detailed report provides a comprehensive analysis of the global phytosterols industry, offering invaluable insights for businesses, investors, and researchers. With a study period spanning 2019-2033, a base year of 2025, and a forecast period of 2025-2033, this report offers a complete picture of the market's historical performance, current state, and future trajectory. The market size is projected to reach xx Million by 2033, exhibiting a CAGR of xx% during the forecast period.
Phytosterols Industry Market Structure & Competitive Dynamics
The phytosterols market is characterized by a moderately concentrated structure with several key players holding significant market share. Market concentration is expected to remain relatively stable over the forecast period, although strategic acquisitions and partnerships may influence the competitive landscape. Innovation ecosystems are vibrant, particularly in the development of new applications and delivery systems. Regulatory frameworks vary across regions, impacting market access and product approvals. Substitute products, such as cholesterol-lowering drugs, pose a degree of competitive pressure, while growing consumer awareness of health and wellness is driving demand for phytosterols. Mergers and acquisitions (M&A) activity has been notable, reflecting industry consolidation and expansion efforts. For example, the acquisition of Vitae Naturals by Kensing LLC (June 2022) highlights the growing interest in plant-based solutions.
- Market Share: Cargill Incorporated and BASF SE are estimated to hold a combined market share of approximately xx%, while other major players including Ashland Global Holdings Inc, and Archer Daniels Midland Company collectively hold an estimated xx%. Smaller players contribute the remaining share.
- M&A Activity: While precise deal values are not publicly available for all transactions, the acquisition of Vitae Naturals, estimated to be in the xx Million range, indicates substantial investment in the sector. Further analysis reveals increased M&A activities in recent years, with values totalling approximately xx Million from 2019-2024.
- Innovation Ecosystems: Several companies are aggressively pursuing R&D, with focus on novel extraction methods, improved formulation, and new applications.
Phytosterols Industry Industry Trends & Insights
The phytosterols market is experiencing robust growth, driven by several key factors. The increasing prevalence of cardiovascular diseases and a heightened focus on heart health are boosting demand for cholesterol-lowering products, with phytosterols playing a significant role. Technological advancements in extraction and purification processes are improving the efficiency and cost-effectiveness of phytosterol production. Changing consumer preferences towards natural and plant-based ingredients are fueling the market's expansion across various sectors. The rise in health-conscious consumers and the growing popularity of functional foods and dietary supplements are creating significant growth opportunities. Competitive dynamics are intensifying, with established players and emerging companies striving to innovate and differentiate their offerings. This is evidenced by the investments in research and development, highlighted by Elicit Plant's USD 17.26 Million Series funding (February 2022). The market is expected to witness a CAGR of xx% during the forecast period, with significant market penetration increases in developing economies.
Dominant Markets & Segments in Phytosterols Industry
The food and beverage sector currently dominates the phytosterols market, driven by the increasing demand for fortified foods and functional beverages that aim to improve heart health. Among product types, Beta-Sitosterol holds the largest market share, followed by Campesterol and Stigmasterol. Geographically, North America and Europe are currently leading markets due to high consumer awareness of health benefits and established regulatory frameworks. However, developing regions in Asia-Pacific and Latin America are expected to witness rapid growth in coming years.
- Key Drivers:
- Food & Beverages: Growing demand for heart-healthy foods, expanding food fortification regulations.
- Pharmaceuticals: Increase in chronic disease prevalence, and development of novel drug delivery systems.
- North America & Europe: High consumer health awareness, well-established regulatory frameworks.
- Asia-Pacific & Latin America: Rising disposable incomes, increasing health consciousness.
- Dominance Analysis: The dominance of the food and beverage segment is expected to persist, driven by a combination of regulatory support, consumer demand, and increased accessibility. Similarly, North America and Europe will likely remain key markets in the short-to-medium term given their regulatory support and high consumer health awareness.
Phytosterols Industry Product Innovations
Recent innovations focus on developing novel phytosterol formulations with enhanced bioavailability and improved stability. These advancements aim to overcome the limitations of traditional phytosterol products. Microencapsulation and nano-emulsification technologies are gaining traction to enhance the absorption and effectiveness of phytosterols. Additionally, the exploration of new applications in cosmetics and animal feed is driving innovation.
Report Segmentation & Scope
This report segments the phytosterols market by product type (Beta-Sitosterol, Campesterol, Stigmasterol, Other Product Types) and application (Food and Beverages, Bakery and Confectionery, Pharmaceuticals, Cosmetics, Dietary Supplements, Animal Feed). Each segment is analyzed based on market size, growth projections, and competitive dynamics. Growth projections vary significantly across segments, reflecting varying consumer demand and regulatory landscapes. The competitive landscape is equally diverse, with varying degrees of market concentration. For example, the food and beverage segment is more fragmented than pharmaceuticals, resulting in more competitive intensity in the former.
Key Drivers of Phytosterols Industry Growth
Key drivers for phytosterols market growth include:
- Growing Health Consciousness: Increased consumer awareness of heart health and the benefits of phytosterols.
- Technological Advancements: Improvements in extraction and purification techniques have made phytosterols more accessible and cost-effective.
- Favorable Regulatory Environment: Growing regulatory support for the use of phytosterols in food and dietary supplements.
- Rise of Functional Foods: Increased demand for functional foods and beverages enriched with phytosterols.
Challenges in the Phytosterols Industry Sector
Challenges facing the industry include:
- Supply Chain Disruptions: Fluctuations in raw material availability, impacting production costs and supply reliability.
- Stringent Regulations: Varying regulatory frameworks across different regions, creating challenges for market access.
- Competition from Synthetic Alternatives: Competition from synthetic cholesterol-lowering drugs that still have a notable market share. This poses a major challenge to the continued market share growth of phytosterols.
Leading Players in the Phytosterols Industry Market
- Arboris LLC
- Cargill Incorporated
- Ashland Global Holdings Inc
- Gustav Parmentier GmbH
- Lubrizol Life Science Health
- DuPont de Nemours Inc
- Archer Daniels Midland Company
- BASF SE
- Berkshire Hathaway Inc
- Merck Group
Key Developments in Phytosterols Industry Sector
- June 2022: Kensing LLC acquired Vitae Naturals, expanding its portfolio of plant sterol-based products and strengthening its position in the skincare, food, and nutrition markets. This significantly impacts the market share dynamics and introduces synergies in product offerings.
- February 2022: Elicit Plant secured USD 17.26 Million in series funding to advance its phytosterol-based solutions for water stress in crops, showcasing the growing interest in sustainable and climate-resilient agriculture. This impacts the adoption of phytosterols in the agricultural industry.
Strategic Phytosterols Industry Market Outlook
The phytosterols market holds significant future potential, driven by increasing health awareness, technological advancements, and expanding applications. Strategic opportunities lie in developing innovative formulations, exploring new applications, and penetrating emerging markets. Companies focusing on sustainability and traceability will gain a competitive edge. The market's growth will be further fueled by collaborations and partnerships across the value chain, supporting innovation and market expansion.
Phytosterols Industry Segmentation
-
1. Product Type
- 1.1. Beta-Sitosterol
- 1.2. Campesterol
- 1.3. Stigmasterol
- 1.4. Other Product Types
-
2. Application
-
2.1. Food and Beverages
- 2.1.1. Dairy Products
- 2.1.2. Sauces and Condiments
- 2.1.3. Bakery and Confectionery
- 2.2. Pharmaceuticals
- 2.3. Cosmetics
- 2.4. Dietary Supplements
- 2.5. Animal Feed
-
2.1. Food and Beverages
Phytosterols Industry Segmentation By Geography
-
1. North America
- 1.1. United States
- 1.2. Canada
- 1.3. Mexico
- 1.4. Rest of North America
-
2. Europe
- 2.1. Germany
- 2.2. United Kingdom
- 2.3. France
- 2.4. Russia
- 2.5. Spain
- 2.6. Italy
- 2.7. Rest of Europe
-
3. Asia Pacific
- 3.1. India
- 3.2. China
- 3.3. Japan
- 3.4. Australia
- 3.5. Rest of Asia Pacific
-
4. South America
- 4.1. Brazil
- 4.2. Argentina
- 4.3. Rest of South America
- 5. Middle East
-
6. Saudi Arabia
- 6.1. South Africa
- 6.2. Rest of Middle East
Phytosterols Industry REPORT HIGHLIGHTS
| Aspects | Details |
|---|---|
| Study Period | 2019-2033 |
| Base Year | 2024 |
| Estimated Year | 2025 |
| Forecast Period | 2025-2033 |
| Historical Period | 2019-2024 |
| Growth Rate | CAGR of 8.60% from 2019-2033 |
| Segmentation |
|
Table of Contents
- 1. Introduction
- 1.1. Research Scope
- 1.2. Market Segmentation
- 1.3. Research Methodology
- 1.4. Definitions and Assumptions
- 2. Executive Summary
- 2.1. Introduction
- 3. Market Dynamics
- 3.1. Introduction
- 3.2. Market Drivers
- 3.2.1. Increasing awareness towards fitness among consumers; Demand for convenient fortified foods
- 3.3. Market Restrains
- 3.3.1. Prevalence of allergen intolerance among the consumers
- 3.4. Market Trends
- 3.4.1. Increasing Prevalence of Cardiovascular Disease
- 4. Market Factor Analysis
- 4.1. Porters Five Forces
- 4.2. Supply/Value Chain
- 4.3. PESTEL analysis
- 4.4. Market Entropy
- 4.5. Patent/Trademark Analysis
- 5. Global Phytosterols Industry Analysis, Insights and Forecast, 2019-2031
- 5.1. Market Analysis, Insights and Forecast - by Product Type
- 5.1.1. Beta-Sitosterol
- 5.1.2. Campesterol
- 5.1.3. Stigmasterol
- 5.1.4. Other Product Types
- 5.2. Market Analysis, Insights and Forecast - by Application
- 5.2.1. Food and Beverages
- 5.2.1.1. Dairy Products
- 5.2.1.2. Sauces and Condiments
- 5.2.1.3. Bakery and Confectionery
- 5.2.2. Pharmaceuticals
- 5.2.3. Cosmetics
- 5.2.4. Dietary Supplements
- 5.2.5. Animal Feed
- 5.2.1. Food and Beverages
- 5.3. Market Analysis, Insights and Forecast - by Region
- 5.3.1. North America
- 5.3.2. Europe
- 5.3.3. Asia Pacific
- 5.3.4. South America
- 5.3.5. Middle East
- 5.3.6. Saudi Arabia
- 5.1. Market Analysis, Insights and Forecast - by Product Type
- 6. North America Phytosterols Industry Analysis, Insights and Forecast, 2019-2031
- 6.1. Market Analysis, Insights and Forecast - by Product Type
- 6.1.1. Beta-Sitosterol
- 6.1.2. Campesterol
- 6.1.3. Stigmasterol
- 6.1.4. Other Product Types
- 6.2. Market Analysis, Insights and Forecast - by Application
- 6.2.1. Food and Beverages
- 6.2.1.1. Dairy Products
- 6.2.1.2. Sauces and Condiments
- 6.2.1.3. Bakery and Confectionery
- 6.2.2. Pharmaceuticals
- 6.2.3. Cosmetics
- 6.2.4. Dietary Supplements
- 6.2.5. Animal Feed
- 6.2.1. Food and Beverages
- 6.1. Market Analysis, Insights and Forecast - by Product Type
- 7. Europe Phytosterols Industry Analysis, Insights and Forecast, 2019-2031
- 7.1. Market Analysis, Insights and Forecast - by Product Type
- 7.1.1. Beta-Sitosterol
- 7.1.2. Campesterol
- 7.1.3. Stigmasterol
- 7.1.4. Other Product Types
- 7.2. Market Analysis, Insights and Forecast - by Application
- 7.2.1. Food and Beverages
- 7.2.1.1. Dairy Products
- 7.2.1.2. Sauces and Condiments
- 7.2.1.3. Bakery and Confectionery
- 7.2.2. Pharmaceuticals
- 7.2.3. Cosmetics
- 7.2.4. Dietary Supplements
- 7.2.5. Animal Feed
- 7.2.1. Food and Beverages
- 7.1. Market Analysis, Insights and Forecast - by Product Type
- 8. Asia Pacific Phytosterols Industry Analysis, Insights and Forecast, 2019-2031
- 8.1. Market Analysis, Insights and Forecast - by Product Type
- 8.1.1. Beta-Sitosterol
- 8.1.2. Campesterol
- 8.1.3. Stigmasterol
- 8.1.4. Other Product Types
- 8.2. Market Analysis, Insights and Forecast - by Application
- 8.2.1. Food and Beverages
- 8.2.1.1. Dairy Products
- 8.2.1.2. Sauces and Condiments
- 8.2.1.3. Bakery and Confectionery
- 8.2.2. Pharmaceuticals
- 8.2.3. Cosmetics
- 8.2.4. Dietary Supplements
- 8.2.5. Animal Feed
- 8.2.1. Food and Beverages
- 8.1. Market Analysis, Insights and Forecast - by Product Type
- 9. South America Phytosterols Industry Analysis, Insights and Forecast, 2019-2031
- 9.1. Market Analysis, Insights and Forecast - by Product Type
- 9.1.1. Beta-Sitosterol
- 9.1.2. Campesterol
- 9.1.3. Stigmasterol
- 9.1.4. Other Product Types
- 9.2. Market Analysis, Insights and Forecast - by Application
- 9.2.1. Food and Beverages
- 9.2.1.1. Dairy Products
- 9.2.1.2. Sauces and Condiments
- 9.2.1.3. Bakery and Confectionery
- 9.2.2. Pharmaceuticals
- 9.2.3. Cosmetics
- 9.2.4. Dietary Supplements
- 9.2.5. Animal Feed
- 9.2.1. Food and Beverages
- 9.1. Market Analysis, Insights and Forecast - by Product Type
- 10. Middle East Phytosterols Industry Analysis, Insights and Forecast, 2019-2031
- 10.1. Market Analysis, Insights and Forecast - by Product Type
- 10.1.1. Beta-Sitosterol
- 10.1.2. Campesterol
- 10.1.3. Stigmasterol
- 10.1.4. Other Product Types
- 10.2. Market Analysis, Insights and Forecast - by Application
- 10.2.1. Food and Beverages
- 10.2.1.1. Dairy Products
- 10.2.1.2. Sauces and Condiments
- 10.2.1.3. Bakery and Confectionery
- 10.2.2. Pharmaceuticals
- 10.2.3. Cosmetics
- 10.2.4. Dietary Supplements
- 10.2.5. Animal Feed
- 10.2.1. Food and Beverages
- 10.1. Market Analysis, Insights and Forecast - by Product Type
- 11. Saudi Arabia Phytosterols Industry Analysis, Insights and Forecast, 2019-2031
- 11.1. Market Analysis, Insights and Forecast - by Product Type
- 11.1.1. Beta-Sitosterol
- 11.1.2. Campesterol
- 11.1.3. Stigmasterol
- 11.1.4. Other Product Types
- 11.2. Market Analysis, Insights and Forecast - by Application
- 11.2.1. Food and Beverages
- 11.2.1.1. Dairy Products
- 11.2.1.2. Sauces and Condiments
- 11.2.1.3. Bakery and Confectionery
- 11.2.2. Pharmaceuticals
- 11.2.3. Cosmetics
- 11.2.4. Dietary Supplements
- 11.2.5. Animal Feed
- 11.2.1. Food and Beverages
- 11.1. Market Analysis, Insights and Forecast - by Product Type
- 12. North America Phytosterols Industry Analysis, Insights and Forecast, 2019-2031
- 12.1. Market Analysis, Insights and Forecast - By Country/Sub-region
- 12.1.1 United States
- 12.1.2 Canada
- 12.1.3 Mexico
- 12.1.4 Rest of North America
- 13. Europe Phytosterols Industry Analysis, Insights and Forecast, 2019-2031
- 13.1. Market Analysis, Insights and Forecast - By Country/Sub-region
- 13.1.1 Germany
- 13.1.2 United Kingdom
- 13.1.3 France
- 13.1.4 Russia
- 13.1.5 Spain
- 13.1.6 Italy
- 13.1.7 Rest of Europe
- 14. Asia Pacific Phytosterols Industry Analysis, Insights and Forecast, 2019-2031
- 14.1. Market Analysis, Insights and Forecast - By Country/Sub-region
- 14.1.1 India
- 14.1.2 China
- 14.1.3 Japan
- 14.1.4 Australia
- 14.1.5 Rest of Asia Pacific
- 15. South America Phytosterols Industry Analysis, Insights and Forecast, 2019-2031
- 15.1. Market Analysis, Insights and Forecast - By Country/Sub-region
- 15.1.1 Brazil
- 15.1.2 Argentina
- 15.1.3 Rest of South America
- 16. Middle East Phytosterols Industry Analysis, Insights and Forecast, 2019-2031
- 16.1. Market Analysis, Insights and Forecast - By Country/Sub-region
- 16.1.1 Middle East
- 16.1.2 Africa
- 17. Saudi Arabia Phytosterols Industry Analysis, Insights and Forecast, 2019-2031
- 17.1. Market Analysis, Insights and Forecast - By Country/Sub-region
- 17.1.1 South Africa
- 17.1.2 Rest of Middle East
- 18. Competitive Analysis
- 18.1. Global Market Share Analysis 2024
- 18.2. Company Profiles
- 18.2.1 Arboris LLC
- 18.2.1.1. Overview
- 18.2.1.2. Products
- 18.2.1.3. SWOT Analysis
- 18.2.1.4. Recent Developments
- 18.2.1.5. Financials (Based on Availability)
- 18.2.2 Cargill Incorporated
- 18.2.2.1. Overview
- 18.2.2.2. Products
- 18.2.2.3. SWOT Analysis
- 18.2.2.4. Recent Developments
- 18.2.2.5. Financials (Based on Availability)
- 18.2.3 Ashland Global Holdings Inc
- 18.2.3.1. Overview
- 18.2.3.2. Products
- 18.2.3.3. SWOT Analysis
- 18.2.3.4. Recent Developments
- 18.2.3.5. Financials (Based on Availability)
- 18.2.4 Gustav Parmentier GmbH*List Not Exhaustive
- 18.2.4.1. Overview
- 18.2.4.2. Products
- 18.2.4.3. SWOT Analysis
- 18.2.4.4. Recent Developments
- 18.2.4.5. Financials (Based on Availability)
- 18.2.5 Lubrizol Life Science Health
- 18.2.5.1. Overview
- 18.2.5.2. Products
- 18.2.5.3. SWOT Analysis
- 18.2.5.4. Recent Developments
- 18.2.5.5. Financials (Based on Availability)
- 18.2.6 DuPont de Nemours Inc
- 18.2.6.1. Overview
- 18.2.6.2. Products
- 18.2.6.3. SWOT Analysis
- 18.2.6.4. Recent Developments
- 18.2.6.5. Financials (Based on Availability)
- 18.2.7 Archer Daniels Midland Company
- 18.2.7.1. Overview
- 18.2.7.2. Products
- 18.2.7.3. SWOT Analysis
- 18.2.7.4. Recent Developments
- 18.2.7.5. Financials (Based on Availability)
- 18.2.8 BASF SE
- 18.2.8.1. Overview
- 18.2.8.2. Products
- 18.2.8.3. SWOT Analysis
- 18.2.8.4. Recent Developments
- 18.2.8.5. Financials (Based on Availability)
- 18.2.9 Berkshire Hathaway Inc
- 18.2.9.1. Overview
- 18.2.9.2. Products
- 18.2.9.3. SWOT Analysis
- 18.2.9.4. Recent Developments
- 18.2.9.5. Financials (Based on Availability)
- 18.2.10 Merck Group
- 18.2.10.1. Overview
- 18.2.10.2. Products
- 18.2.10.3. SWOT Analysis
- 18.2.10.4. Recent Developments
- 18.2.10.5. Financials (Based on Availability)
- 18.2.1 Arboris LLC
List of Figures
- Figure 1: Global Phytosterols Industry Revenue Breakdown (Million, %) by Region 2024 & 2032
- Figure 2: Global Phytosterols Industry Volume Breakdown (K Tons, %) by Region 2024 & 2032
- Figure 3: North America Phytosterols Industry Revenue (Million), by Country 2024 & 2032
- Figure 4: North America Phytosterols Industry Volume (K Tons), by Country 2024 & 2032
- Figure 5: North America Phytosterols Industry Revenue Share (%), by Country 2024 & 2032
- Figure 6: North America Phytosterols Industry Volume Share (%), by Country 2024 & 2032
- Figure 7: Europe Phytosterols Industry Revenue (Million), by Country 2024 & 2032
- Figure 8: Europe Phytosterols Industry Volume (K Tons), by Country 2024 & 2032
- Figure 9: Europe Phytosterols Industry Revenue Share (%), by Country 2024 & 2032
- Figure 10: Europe Phytosterols Industry Volume Share (%), by Country 2024 & 2032
- Figure 11: Asia Pacific Phytosterols Industry Revenue (Million), by Country 2024 & 2032
- Figure 12: Asia Pacific Phytosterols Industry Volume (K Tons), by Country 2024 & 2032
- Figure 13: Asia Pacific Phytosterols Industry Revenue Share (%), by Country 2024 & 2032
- Figure 14: Asia Pacific Phytosterols Industry Volume Share (%), by Country 2024 & 2032
- Figure 15: South America Phytosterols Industry Revenue (Million), by Country 2024 & 2032
- Figure 16: South America Phytosterols Industry Volume (K Tons), by Country 2024 & 2032
- Figure 17: South America Phytosterols Industry Revenue Share (%), by Country 2024 & 2032
- Figure 18: South America Phytosterols Industry Volume Share (%), by Country 2024 & 2032
- Figure 19: Middle East Phytosterols Industry Revenue (Million), by Country 2024 & 2032
- Figure 20: Middle East Phytosterols Industry Volume (K Tons), by Country 2024 & 2032
- Figure 21: Middle East Phytosterols Industry Revenue Share (%), by Country 2024 & 2032
- Figure 22: Middle East Phytosterols Industry Volume Share (%), by Country 2024 & 2032
- Figure 23: Saudi Arabia Phytosterols Industry Revenue (Million), by Country 2024 & 2032
- Figure 24: Saudi Arabia Phytosterols Industry Volume (K Tons), by Country 2024 & 2032
- Figure 25: Saudi Arabia Phytosterols Industry Revenue Share (%), by Country 2024 & 2032
- Figure 26: Saudi Arabia Phytosterols Industry Volume Share (%), by Country 2024 & 2032
- Figure 27: North America Phytosterols Industry Revenue (Million), by Product Type 2024 & 2032
- Figure 28: North America Phytosterols Industry Volume (K Tons), by Product Type 2024 & 2032
- Figure 29: North America Phytosterols Industry Revenue Share (%), by Product Type 2024 & 2032
- Figure 30: North America Phytosterols Industry Volume Share (%), by Product Type 2024 & 2032
- Figure 31: North America Phytosterols Industry Revenue (Million), by Application 2024 & 2032
- Figure 32: North America Phytosterols Industry Volume (K Tons), by Application 2024 & 2032
- Figure 33: North America Phytosterols Industry Revenue Share (%), by Application 2024 & 2032
- Figure 34: North America Phytosterols Industry Volume Share (%), by Application 2024 & 2032
- Figure 35: North America Phytosterols Industry Revenue (Million), by Country 2024 & 2032
- Figure 36: North America Phytosterols Industry Volume (K Tons), by Country 2024 & 2032
- Figure 37: North America Phytosterols Industry Revenue Share (%), by Country 2024 & 2032
- Figure 38: North America Phytosterols Industry Volume Share (%), by Country 2024 & 2032
- Figure 39: Europe Phytosterols Industry Revenue (Million), by Product Type 2024 & 2032
- Figure 40: Europe Phytosterols Industry Volume (K Tons), by Product Type 2024 & 2032
- Figure 41: Europe Phytosterols Industry Revenue Share (%), by Product Type 2024 & 2032
- Figure 42: Europe Phytosterols Industry Volume Share (%), by Product Type 2024 & 2032
- Figure 43: Europe Phytosterols Industry Revenue (Million), by Application 2024 & 2032
- Figure 44: Europe Phytosterols Industry Volume (K Tons), by Application 2024 & 2032
- Figure 45: Europe Phytosterols Industry Revenue Share (%), by Application 2024 & 2032
- Figure 46: Europe Phytosterols Industry Volume Share (%), by Application 2024 & 2032
- Figure 47: Europe Phytosterols Industry Revenue (Million), by Country 2024 & 2032
- Figure 48: Europe Phytosterols Industry Volume (K Tons), by Country 2024 & 2032
- Figure 49: Europe Phytosterols Industry Revenue Share (%), by Country 2024 & 2032
- Figure 50: Europe Phytosterols Industry Volume Share (%), by Country 2024 & 2032
- Figure 51: Asia Pacific Phytosterols Industry Revenue (Million), by Product Type 2024 & 2032
- Figure 52: Asia Pacific Phytosterols Industry Volume (K Tons), by Product Type 2024 & 2032
- Figure 53: Asia Pacific Phytosterols Industry Revenue Share (%), by Product Type 2024 & 2032
- Figure 54: Asia Pacific Phytosterols Industry Volume Share (%), by Product Type 2024 & 2032
- Figure 55: Asia Pacific Phytosterols Industry Revenue (Million), by Application 2024 & 2032
- Figure 56: Asia Pacific Phytosterols Industry Volume (K Tons), by Application 2024 & 2032
- Figure 57: Asia Pacific Phytosterols Industry Revenue Share (%), by Application 2024 & 2032
- Figure 58: Asia Pacific Phytosterols Industry Volume Share (%), by Application 2024 & 2032
- Figure 59: Asia Pacific Phytosterols Industry Revenue (Million), by Country 2024 & 2032
- Figure 60: Asia Pacific Phytosterols Industry Volume (K Tons), by Country 2024 & 2032
- Figure 61: Asia Pacific Phytosterols Industry Revenue Share (%), by Country 2024 & 2032
- Figure 62: Asia Pacific Phytosterols Industry Volume Share (%), by Country 2024 & 2032
- Figure 63: South America Phytosterols Industry Revenue (Million), by Product Type 2024 & 2032
- Figure 64: South America Phytosterols Industry Volume (K Tons), by Product Type 2024 & 2032
- Figure 65: South America Phytosterols Industry Revenue Share (%), by Product Type 2024 & 2032
- Figure 66: South America Phytosterols Industry Volume Share (%), by Product Type 2024 & 2032
- Figure 67: South America Phytosterols Industry Revenue (Million), by Application 2024 & 2032
- Figure 68: South America Phytosterols Industry Volume (K Tons), by Application 2024 & 2032
- Figure 69: South America Phytosterols Industry Revenue Share (%), by Application 2024 & 2032
- Figure 70: South America Phytosterols Industry Volume Share (%), by Application 2024 & 2032
- Figure 71: South America Phytosterols Industry Revenue (Million), by Country 2024 & 2032
- Figure 72: South America Phytosterols Industry Volume (K Tons), by Country 2024 & 2032
- Figure 73: South America Phytosterols Industry Revenue Share (%), by Country 2024 & 2032
- Figure 74: South America Phytosterols Industry Volume Share (%), by Country 2024 & 2032
- Figure 75: Middle East Phytosterols Industry Revenue (Million), by Product Type 2024 & 2032
- Figure 76: Middle East Phytosterols Industry Volume (K Tons), by Product Type 2024 & 2032
- Figure 77: Middle East Phytosterols Industry Revenue Share (%), by Product Type 2024 & 2032
- Figure 78: Middle East Phytosterols Industry Volume Share (%), by Product Type 2024 & 2032
- Figure 79: Middle East Phytosterols Industry Revenue (Million), by Application 2024 & 2032
- Figure 80: Middle East Phytosterols Industry Volume (K Tons), by Application 2024 & 2032
- Figure 81: Middle East Phytosterols Industry Revenue Share (%), by Application 2024 & 2032
- Figure 82: Middle East Phytosterols Industry Volume Share (%), by Application 2024 & 2032
- Figure 83: Middle East Phytosterols Industry Revenue (Million), by Country 2024 & 2032
- Figure 84: Middle East Phytosterols Industry Volume (K Tons), by Country 2024 & 2032
- Figure 85: Middle East Phytosterols Industry Revenue Share (%), by Country 2024 & 2032
- Figure 86: Middle East Phytosterols Industry Volume Share (%), by Country 2024 & 2032
- Figure 87: Saudi Arabia Phytosterols Industry Revenue (Million), by Product Type 2024 & 2032
- Figure 88: Saudi Arabia Phytosterols Industry Volume (K Tons), by Product Type 2024 & 2032
- Figure 89: Saudi Arabia Phytosterols Industry Revenue Share (%), by Product Type 2024 & 2032
- Figure 90: Saudi Arabia Phytosterols Industry Volume Share (%), by Product Type 2024 & 2032
- Figure 91: Saudi Arabia Phytosterols Industry Revenue (Million), by Application 2024 & 2032
- Figure 92: Saudi Arabia Phytosterols Industry Volume (K Tons), by Application 2024 & 2032
- Figure 93: Saudi Arabia Phytosterols Industry Revenue Share (%), by Application 2024 & 2032
- Figure 94: Saudi Arabia Phytosterols Industry Volume Share (%), by Application 2024 & 2032
- Figure 95: Saudi Arabia Phytosterols Industry Revenue (Million), by Country 2024 & 2032
- Figure 96: Saudi Arabia Phytosterols Industry Volume (K Tons), by Country 2024 & 2032
- Figure 97: Saudi Arabia Phytosterols Industry Revenue Share (%), by Country 2024 & 2032
- Figure 98: Saudi Arabia Phytosterols Industry Volume Share (%), by Country 2024 & 2032
List of Tables
- Table 1: Global Phytosterols Industry Revenue Million Forecast, by Region 2019 & 2032
- Table 2: Global Phytosterols Industry Volume K Tons Forecast, by Region 2019 & 2032
- Table 3: Global Phytosterols Industry Revenue Million Forecast, by Product Type 2019 & 2032
- Table 4: Global Phytosterols Industry Volume K Tons Forecast, by Product Type 2019 & 2032
- Table 5: Global Phytosterols Industry Revenue Million Forecast, by Application 2019 & 2032
- Table 6: Global Phytosterols Industry Volume K Tons Forecast, by Application 2019 & 2032
- Table 7: Global Phytosterols Industry Revenue Million Forecast, by Region 2019 & 2032
- Table 8: Global Phytosterols Industry Volume K Tons Forecast, by Region 2019 & 2032
- Table 9: Global Phytosterols Industry Revenue Million Forecast, by Country 2019 & 2032
- Table 10: Global Phytosterols Industry Volume K Tons Forecast, by Country 2019 & 2032
- Table 11: United States Phytosterols Industry Revenue (Million) Forecast, by Application 2019 & 2032
- Table 12: United States Phytosterols Industry Volume (K Tons) Forecast, by Application 2019 & 2032
- Table 13: Canada Phytosterols Industry Revenue (Million) Forecast, by Application 2019 & 2032
- Table 14: Canada Phytosterols Industry Volume (K Tons) Forecast, by Application 2019 & 2032
- Table 15: Mexico Phytosterols Industry Revenue (Million) Forecast, by Application 2019 & 2032
- Table 16: Mexico Phytosterols Industry Volume (K Tons) Forecast, by Application 2019 & 2032
- Table 17: Rest of North America Phytosterols Industry Revenue (Million) Forecast, by Application 2019 & 2032
- Table 18: Rest of North America Phytosterols Industry Volume (K Tons) Forecast, by Application 2019 & 2032
- Table 19: Global Phytosterols Industry Revenue Million Forecast, by Country 2019 & 2032
- Table 20: Global Phytosterols Industry Volume K Tons Forecast, by Country 2019 & 2032
- Table 21: Germany Phytosterols Industry Revenue (Million) Forecast, by Application 2019 & 2032
- Table 22: Germany Phytosterols Industry Volume (K Tons) Forecast, by Application 2019 & 2032
- Table 23: United Kingdom Phytosterols Industry Revenue (Million) Forecast, by Application 2019 & 2032
- Table 24: United Kingdom Phytosterols Industry Volume (K Tons) Forecast, by Application 2019 & 2032
- Table 25: France Phytosterols Industry Revenue (Million) Forecast, by Application 2019 & 2032
- Table 26: France Phytosterols Industry Volume (K Tons) Forecast, by Application 2019 & 2032
- Table 27: Russia Phytosterols Industry Revenue (Million) Forecast, by Application 2019 & 2032
- Table 28: Russia Phytosterols Industry Volume (K Tons) Forecast, by Application 2019 & 2032
- Table 29: Spain Phytosterols Industry Revenue (Million) Forecast, by Application 2019 & 2032
- Table 30: Spain Phytosterols Industry Volume (K Tons) Forecast, by Application 2019 & 2032
- Table 31: Italy Phytosterols Industry Revenue (Million) Forecast, by Application 2019 & 2032
- Table 32: Italy Phytosterols Industry Volume (K Tons) Forecast, by Application 2019 & 2032
- Table 33: Rest of Europe Phytosterols Industry Revenue (Million) Forecast, by Application 2019 & 2032
- Table 34: Rest of Europe Phytosterols Industry Volume (K Tons) Forecast, by Application 2019 & 2032
- Table 35: Global Phytosterols Industry Revenue Million Forecast, by Country 2019 & 2032
- Table 36: Global Phytosterols Industry Volume K Tons Forecast, by Country 2019 & 2032
- Table 37: India Phytosterols Industry Revenue (Million) Forecast, by Application 2019 & 2032
- Table 38: India Phytosterols Industry Volume (K Tons) Forecast, by Application 2019 & 2032
- Table 39: China Phytosterols Industry Revenue (Million) Forecast, by Application 2019 & 2032
- Table 40: China Phytosterols Industry Volume (K Tons) Forecast, by Application 2019 & 2032
- Table 41: Japan Phytosterols Industry Revenue (Million) Forecast, by Application 2019 & 2032
- Table 42: Japan Phytosterols Industry Volume (K Tons) Forecast, by Application 2019 & 2032
- Table 43: Australia Phytosterols Industry Revenue (Million) Forecast, by Application 2019 & 2032
- Table 44: Australia Phytosterols Industry Volume (K Tons) Forecast, by Application 2019 & 2032
- Table 45: Rest of Asia Pacific Phytosterols Industry Revenue (Million) Forecast, by Application 2019 & 2032
- Table 46: Rest of Asia Pacific Phytosterols Industry Volume (K Tons) Forecast, by Application 2019 & 2032
- Table 47: Global Phytosterols Industry Revenue Million Forecast, by Country 2019 & 2032
- Table 48: Global Phytosterols Industry Volume K Tons Forecast, by Country 2019 & 2032
- Table 49: Brazil Phytosterols Industry Revenue (Million) Forecast, by Application 2019 & 2032
- Table 50: Brazil Phytosterols Industry Volume (K Tons) Forecast, by Application 2019 & 2032
- Table 51: Argentina Phytosterols Industry Revenue (Million) Forecast, by Application 2019 & 2032
- Table 52: Argentina Phytosterols Industry Volume (K Tons) Forecast, by Application 2019 & 2032
- Table 53: Rest of South America Phytosterols Industry Revenue (Million) Forecast, by Application 2019 & 2032
- Table 54: Rest of South America Phytosterols Industry Volume (K Tons) Forecast, by Application 2019 & 2032
- Table 55: Global Phytosterols Industry Revenue Million Forecast, by Country 2019 & 2032
- Table 56: Global Phytosterols Industry Volume K Tons Forecast, by Country 2019 & 2032
- Table 57: Middle East Phytosterols Industry Revenue (Million) Forecast, by Application 2019 & 2032
- Table 58: Middle East Phytosterols Industry Volume (K Tons) Forecast, by Application 2019 & 2032
- Table 59: Africa Phytosterols Industry Revenue (Million) Forecast, by Application 2019 & 2032
- Table 60: Africa Phytosterols Industry Volume (K Tons) Forecast, by Application 2019 & 2032
- Table 61: Global Phytosterols Industry Revenue Million Forecast, by Country 2019 & 2032
- Table 62: Global Phytosterols Industry Volume K Tons Forecast, by Country 2019 & 2032
- Table 63: South Africa Phytosterols Industry Revenue (Million) Forecast, by Application 2019 & 2032
- Table 64: South Africa Phytosterols Industry Volume (K Tons) Forecast, by Application 2019 & 2032
- Table 65: Rest of Middle East Phytosterols Industry Revenue (Million) Forecast, by Application 2019 & 2032
- Table 66: Rest of Middle East Phytosterols Industry Volume (K Tons) Forecast, by Application 2019 & 2032
- Table 67: Global Phytosterols Industry Revenue Million Forecast, by Product Type 2019 & 2032
- Table 68: Global Phytosterols Industry Volume K Tons Forecast, by Product Type 2019 & 2032
- Table 69: Global Phytosterols Industry Revenue Million Forecast, by Application 2019 & 2032
- Table 70: Global Phytosterols Industry Volume K Tons Forecast, by Application 2019 & 2032
- Table 71: Global Phytosterols Industry Revenue Million Forecast, by Country 2019 & 2032
- Table 72: Global Phytosterols Industry Volume K Tons Forecast, by Country 2019 & 2032
- Table 73: United States Phytosterols Industry Revenue (Million) Forecast, by Application 2019 & 2032
- Table 74: United States Phytosterols Industry Volume (K Tons) Forecast, by Application 2019 & 2032
- Table 75: Canada Phytosterols Industry Revenue (Million) Forecast, by Application 2019 & 2032
- Table 76: Canada Phytosterols Industry Volume (K Tons) Forecast, by Application 2019 & 2032
- Table 77: Mexico Phytosterols Industry Revenue (Million) Forecast, by Application 2019 & 2032
- Table 78: Mexico Phytosterols Industry Volume (K Tons) Forecast, by Application 2019 & 2032
- Table 79: Rest of North America Phytosterols Industry Revenue (Million) Forecast, by Application 2019 & 2032
- Table 80: Rest of North America Phytosterols Industry Volume (K Tons) Forecast, by Application 2019 & 2032
- Table 81: Global Phytosterols Industry Revenue Million Forecast, by Product Type 2019 & 2032
- Table 82: Global Phytosterols Industry Volume K Tons Forecast, by Product Type 2019 & 2032
- Table 83: Global Phytosterols Industry Revenue Million Forecast, by Application 2019 & 2032
- Table 84: Global Phytosterols Industry Volume K Tons Forecast, by Application 2019 & 2032
- Table 85: Global Phytosterols Industry Revenue Million Forecast, by Country 2019 & 2032
- Table 86: Global Phytosterols Industry Volume K Tons Forecast, by Country 2019 & 2032
- Table 87: Germany Phytosterols Industry Revenue (Million) Forecast, by Application 2019 & 2032
- Table 88: Germany Phytosterols Industry Volume (K Tons) Forecast, by Application 2019 & 2032
- Table 89: United Kingdom Phytosterols Industry Revenue (Million) Forecast, by Application 2019 & 2032
- Table 90: United Kingdom Phytosterols Industry Volume (K Tons) Forecast, by Application 2019 & 2032
- Table 91: France Phytosterols Industry Revenue (Million) Forecast, by Application 2019 & 2032
- Table 92: France Phytosterols Industry Volume (K Tons) Forecast, by Application 2019 & 2032
- Table 93: Russia Phytosterols Industry Revenue (Million) Forecast, by Application 2019 & 2032
- Table 94: Russia Phytosterols Industry Volume (K Tons) Forecast, by Application 2019 & 2032
- Table 95: Spain Phytosterols Industry Revenue (Million) Forecast, by Application 2019 & 2032
- Table 96: Spain Phytosterols Industry Volume (K Tons) Forecast, by Application 2019 & 2032
- Table 97: Italy Phytosterols Industry Revenue (Million) Forecast, by Application 2019 & 2032
- Table 98: Italy Phytosterols Industry Volume (K Tons) Forecast, by Application 2019 & 2032
- Table 99: Rest of Europe Phytosterols Industry Revenue (Million) Forecast, by Application 2019 & 2032
- Table 100: Rest of Europe Phytosterols Industry Volume (K Tons) Forecast, by Application 2019 & 2032
- Table 101: Global Phytosterols Industry Revenue Million Forecast, by Product Type 2019 & 2032
- Table 102: Global Phytosterols Industry Volume K Tons Forecast, by Product Type 2019 & 2032
- Table 103: Global Phytosterols Industry Revenue Million Forecast, by Application 2019 & 2032
- Table 104: Global Phytosterols Industry Volume K Tons Forecast, by Application 2019 & 2032
- Table 105: Global Phytosterols Industry Revenue Million Forecast, by Country 2019 & 2032
- Table 106: Global Phytosterols Industry Volume K Tons Forecast, by Country 2019 & 2032
- Table 107: India Phytosterols Industry Revenue (Million) Forecast, by Application 2019 & 2032
- Table 108: India Phytosterols Industry Volume (K Tons) Forecast, by Application 2019 & 2032
- Table 109: China Phytosterols Industry Revenue (Million) Forecast, by Application 2019 & 2032
- Table 110: China Phytosterols Industry Volume (K Tons) Forecast, by Application 2019 & 2032
- Table 111: Japan Phytosterols Industry Revenue (Million) Forecast, by Application 2019 & 2032
- Table 112: Japan Phytosterols Industry Volume (K Tons) Forecast, by Application 2019 & 2032
- Table 113: Australia Phytosterols Industry Revenue (Million) Forecast, by Application 2019 & 2032
- Table 114: Australia Phytosterols Industry Volume (K Tons) Forecast, by Application 2019 & 2032
- Table 115: Rest of Asia Pacific Phytosterols Industry Revenue (Million) Forecast, by Application 2019 & 2032
- Table 116: Rest of Asia Pacific Phytosterols Industry Volume (K Tons) Forecast, by Application 2019 & 2032
- Table 117: Global Phytosterols Industry Revenue Million Forecast, by Product Type 2019 & 2032
- Table 118: Global Phytosterols Industry Volume K Tons Forecast, by Product Type 2019 & 2032
- Table 119: Global Phytosterols Industry Revenue Million Forecast, by Application 2019 & 2032
- Table 120: Global Phytosterols Industry Volume K Tons Forecast, by Application 2019 & 2032
- Table 121: Global Phytosterols Industry Revenue Million Forecast, by Country 2019 & 2032
- Table 122: Global Phytosterols Industry Volume K Tons Forecast, by Country 2019 & 2032
- Table 123: Brazil Phytosterols Industry Revenue (Million) Forecast, by Application 2019 & 2032
- Table 124: Brazil Phytosterols Industry Volume (K Tons) Forecast, by Application 2019 & 2032
- Table 125: Argentina Phytosterols Industry Revenue (Million) Forecast, by Application 2019 & 2032
- Table 126: Argentina Phytosterols Industry Volume (K Tons) Forecast, by Application 2019 & 2032
- Table 127: Rest of South America Phytosterols Industry Revenue (Million) Forecast, by Application 2019 & 2032
- Table 128: Rest of South America Phytosterols Industry Volume (K Tons) Forecast, by Application 2019 & 2032
- Table 129: Global Phytosterols Industry Revenue Million Forecast, by Product Type 2019 & 2032
- Table 130: Global Phytosterols Industry Volume K Tons Forecast, by Product Type 2019 & 2032
- Table 131: Global Phytosterols Industry Revenue Million Forecast, by Application 2019 & 2032
- Table 132: Global Phytosterols Industry Volume K Tons Forecast, by Application 2019 & 2032
- Table 133: Global Phytosterols Industry Revenue Million Forecast, by Country 2019 & 2032
- Table 134: Global Phytosterols Industry Volume K Tons Forecast, by Country 2019 & 2032
- Table 135: Global Phytosterols Industry Revenue Million Forecast, by Product Type 2019 & 2032
- Table 136: Global Phytosterols Industry Volume K Tons Forecast, by Product Type 2019 & 2032
- Table 137: Global Phytosterols Industry Revenue Million Forecast, by Application 2019 & 2032
- Table 138: Global Phytosterols Industry Volume K Tons Forecast, by Application 2019 & 2032
- Table 139: Global Phytosterols Industry Revenue Million Forecast, by Country 2019 & 2032
- Table 140: Global Phytosterols Industry Volume K Tons Forecast, by Country 2019 & 2032
- Table 141: South Africa Phytosterols Industry Revenue (Million) Forecast, by Application 2019 & 2032
- Table 142: South Africa Phytosterols Industry Volume (K Tons) Forecast, by Application 2019 & 2032
- Table 143: Rest of Middle East Phytosterols Industry Revenue (Million) Forecast, by Application 2019 & 2032
- Table 144: Rest of Middle East Phytosterols Industry Volume (K Tons) Forecast, by Application 2019 & 2032
Frequently Asked Questions
1. What is the projected Compound Annual Growth Rate (CAGR) of the Phytosterols Industry?
The projected CAGR is approximately 8.60%.
2. Which companies are prominent players in the Phytosterols Industry?
Key companies in the market include Arboris LLC, Cargill Incorporated, Ashland Global Holdings Inc, Gustav Parmentier GmbH*List Not Exhaustive, Lubrizol Life Science Health, DuPont de Nemours Inc, Archer Daniels Midland Company, BASF SE, Berkshire Hathaway Inc, Merck Group.
3. What are the main segments of the Phytosterols Industry?
The market segments include Product Type, Application.
4. Can you provide details about the market size?
The market size is estimated to be USD 890.2 Million as of 2022.
5. What are some drivers contributing to market growth?
Increasing awareness towards fitness among consumers; Demand for convenient fortified foods.
6. What are the notable trends driving market growth?
Increasing Prevalence of Cardiovascular Disease.
7. Are there any restraints impacting market growth?
Prevalence of allergen intolerance among the consumers.
8. Can you provide examples of recent developments in the market?
June 2022: Kensing LLC, a manufacturer of plant sterols, natural vitamin E, and high-purity surfactants, announced the acquisition of Vitae Naturals, a manufacturer of plant sterol esters and non-GMO vitamin E derivatives which have their applications in skincare, food, and nutrition end-use industry.
9. What pricing options are available for accessing the report?
Pricing options include single-user, multi-user, and enterprise licenses priced at USD 4750, USD 5250, and USD 8750 respectively.
10. Is the market size provided in terms of value or volume?
The market size is provided in terms of value, measured in Million and volume, measured in K Tons.
11. Are there any specific market keywords associated with the report?
Yes, the market keyword associated with the report is "Phytosterols Industry," which aids in identifying and referencing the specific market segment covered.
12. How do I determine which pricing option suits my needs best?
The pricing options vary based on user requirements and access needs. Individual users may opt for single-user licenses, while businesses requiring broader access may choose multi-user or enterprise licenses for cost-effective access to the report.
13. Are there any additional resources or data provided in the Phytosterols Industry report?
While the report offers comprehensive insights, it's advisable to review the specific contents or supplementary materials provided to ascertain if additional resources or data are available.
14. How can I stay updated on further developments or reports in the Phytosterols Industry?
To stay informed about further developments, trends, and reports in the Phytosterols Industry, consider subscribing to industry newsletters, following relevant companies and organizations, or regularly checking reputable industry news sources and publications.
Methodology
Step 1 - Identification of Relevant Samples Size from Population Database


Step 2 - Approaches for Defining Global Market Size (Value, Volume* & Price*)

Note*: In applicable scenarios
Step 3 - Data Sources
Primary Research
- Web Analytics
- Survey Reports
- Research Institute
- Latest Research Reports
- Opinion Leaders
Secondary Research
- Annual Reports
- White Paper
- Latest Press Release
- Industry Association
- Paid Database
- Investor Presentations

Step 4 - Data Triangulation
Involves using different sources of information in order to increase the validity of a study
These sources are likely to be stakeholders in a program - participants, other researchers, program staff, other community members, and so on.
Then we put all data in single framework & apply various statistical tools to find out the dynamic on the market.
During the analysis stage, feedback from the stakeholder groups would be compared to determine areas of agreement as well as areas of divergence


