
Key Insights
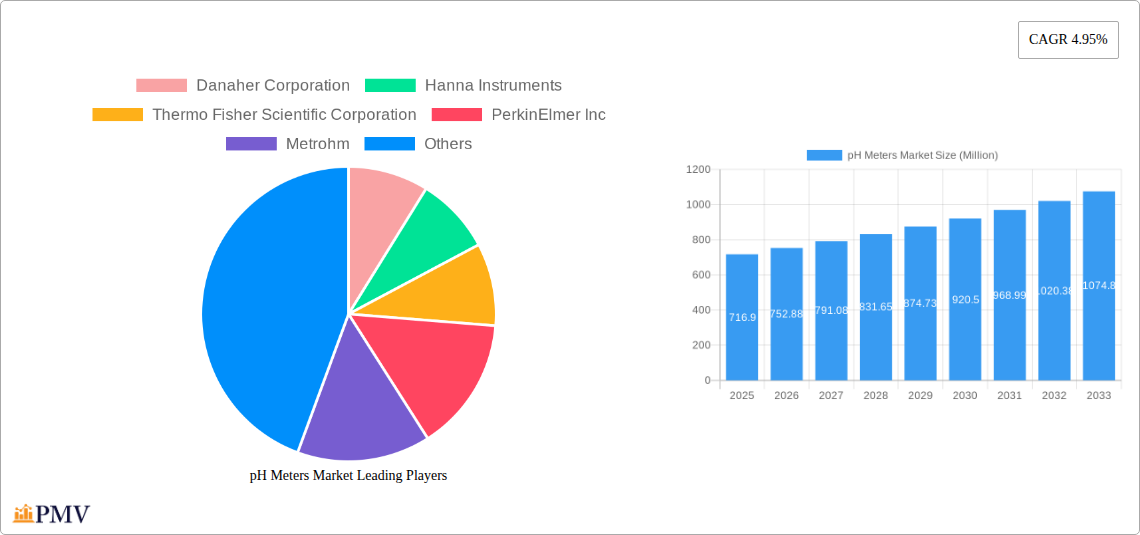
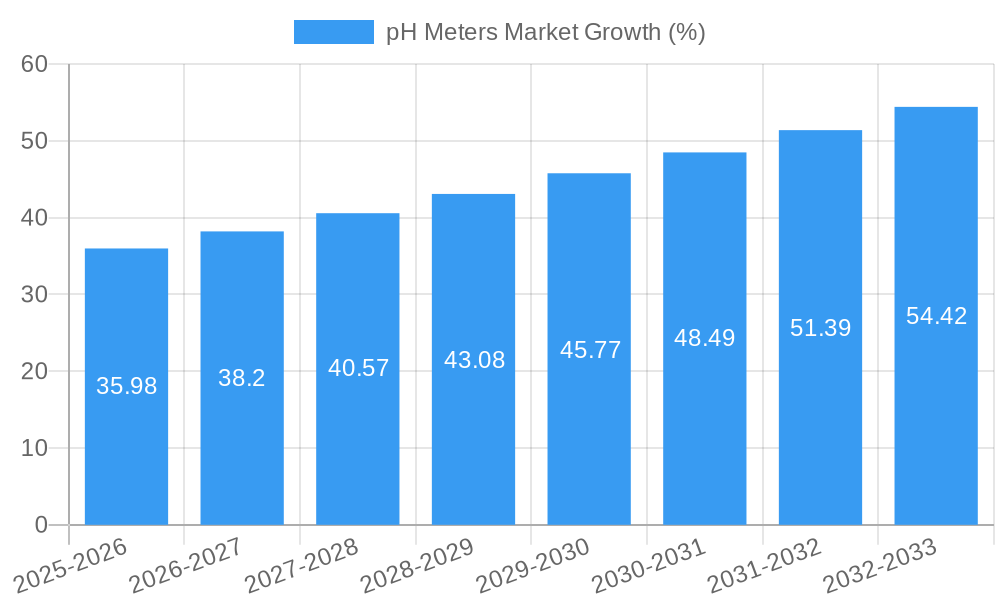
The global pH meters market, valued at $716.90 million in 2025, is projected to experience robust growth, driven by increasing demand across diverse sectors. The market's Compound Annual Growth Rate (CAGR) of 4.95% from 2025 to 2033 indicates a significant expansion, fueled by several key factors. Rising adoption in environmental monitoring, water treatment, and the pharmaceutical and food & beverage industries is a major contributor. Advancements in sensor technology, leading to more accurate, portable, and cost-effective pH meters, are further accelerating market growth. The increasing need for precise pH measurements in research and development, particularly in life sciences, also fuels this expansion. While data limitations prevent precise regional breakdowns, we can anticipate strong growth in regions with developing economies and burgeoning industrial sectors. Competitive landscape analysis reveals key players such as Danaher Corporation, Thermo Fisher Scientific, and Metrohm, actively engaged in product innovation and strategic acquisitions to consolidate their market shares. However, factors like the high initial investment cost for advanced pH meters and the availability of substitute technologies could potentially restrain market growth to some extent.
The forecast period of 2025-2033 presents significant opportunities for market expansion. The growing awareness of environmental protection and the need for stringent quality control across various industries contribute to increased demand. The incorporation of smart functionalities and digital connectivity in newer pH meter models is expected to drive market penetration. Furthermore, the continuous development of specialized pH meters tailored for niche applications like soil testing and blood analysis is poised to unlock new market segments. Companies are focusing on developing portable and wireless pH meters, which are expected to gain popularity, especially in the field applications. This combination of technological advancement and growing application areas ensures that the pH meters market will maintain a trajectory of consistent growth throughout the forecast period.
pH Meters Market: A Comprehensive Report (2019-2033)
This in-depth report provides a comprehensive analysis of the global pH Meters market, covering the historical period (2019-2024), the base year (2025), and the forecast period (2025-2033). The report delves into market structure, competitive dynamics, industry trends, and future growth potential, offering valuable insights for stakeholders across the value chain. The global market size is estimated at xx Million in 2025 and is projected to reach xx Million by 2033, exhibiting a CAGR of xx% during the forecast period.
pH Meters Market Market Structure & Competitive Dynamics
The pH meters market is characterized by a moderately consolidated structure, with several key players holding significant market share. The market concentration is influenced by factors such as economies of scale, technological advancements, and brand recognition. Leading players such as Danaher Corporation, Hanna Instruments, Thermo Fisher Scientific Corporation, PerkinElmer Inc, Metrohm, Fann Instrument, Xylem, Bante Instruments, and OMEGA (list not exhaustive) compete fiercely based on product innovation, pricing strategies, and distribution networks. Innovation ecosystems play a crucial role, with continuous research and development leading to the introduction of advanced features, such as improved accuracy, portability, and connectivity. Regulatory frameworks, such as those related to safety and environmental standards, impact market dynamics. The presence of substitute technologies, although limited, influences market competition. End-user trends, particularly the increasing adoption of pH meters in diverse applications across various industries, drive market growth. Mergers and acquisitions (M&A) activity within the sector further shapes market dynamics. For instance, a recent M&A deal valued at xx Million significantly altered market shares in [Specific region or segment].
- Market Share: Danaher Corporation holds approximately xx% market share, followed by Hanna Instruments at xx%.
- M&A Activity: Significant M&A deals totaling approximately xx Million have been observed in the past five years, primarily driven by strategic acquisitions to expand product portfolios and geographical reach.
- Innovation Ecosystems: Collaboration between manufacturers and research institutions has led to the development of sophisticated pH meters with enhanced features.
pH Meters Market Industry Trends & Insights
The pH Meters market is experiencing robust growth driven by several key factors. The increasing demand for accurate and reliable pH measurement across diverse industries, including pharmaceuticals, food and beverages, water treatment, and environmental monitoring, is a significant driver. Technological advancements, such as the incorporation of advanced sensors and data logging capabilities, are enhancing the functionality and usability of pH meters. Consumer preferences are shifting towards portable, user-friendly, and cost-effective instruments. The competitive landscape is characterized by continuous innovation and product differentiation. Market penetration in emerging economies is expected to accelerate as industrialization and infrastructure development progress. The global market is projected to register a CAGR of xx% over the forecast period, reflecting the strong industry growth trajectory.
Dominant Markets & Segments in pH Meters Market
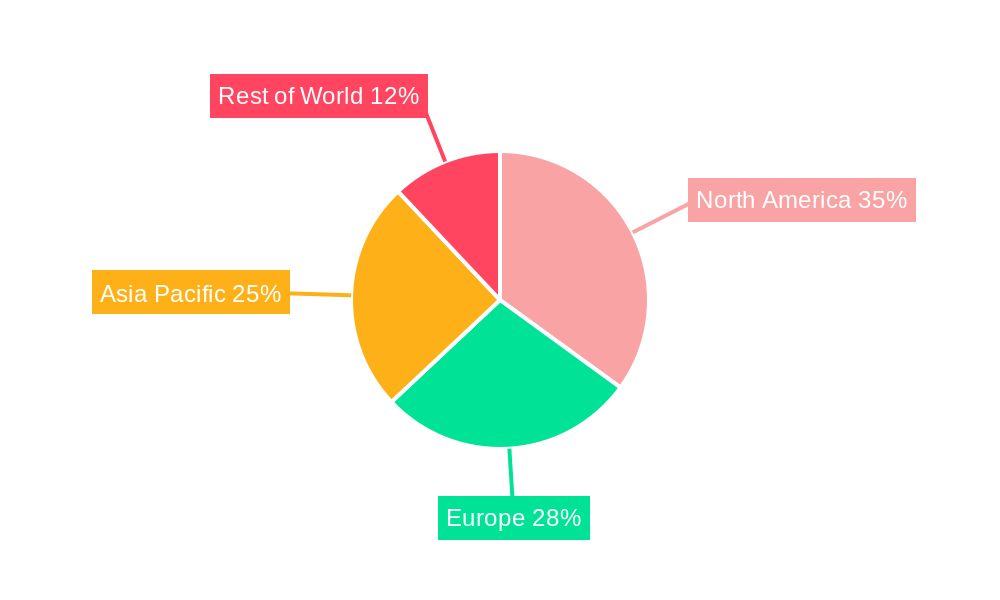
The North American region currently dominates the pH Meters market, driven by robust technological advancements, strong regulatory frameworks, and high adoption rates in diverse applications. This dominance is attributable to factors such as:
- Strong Research & Development: Significant investments in R&D foster technological innovations in the pH meter sector.
- Established Infrastructure: Advanced infrastructure facilitates efficient manufacturing and distribution networks.
- High Adoption Rates: A high level of awareness and technological adoption fuels market demand.
However, the Asia-Pacific region is poised for significant growth due to increasing industrialization, rising disposable income, and expanding application areas. The European market shows stable growth fueled by stringent environmental regulations and increasing focus on water quality monitoring. Within the market segments, the benchtop pH meters segment currently holds the largest market share owing to their superior accuracy and advanced features. However, the portable pH meters segment is expected to witness significant growth due to their convenience and portability.
pH Meters Market Product Innovations
Recent product innovations focus on enhancing accuracy, portability, and connectivity. Wireless connectivity features allow for seamless data transfer and remote monitoring. Miniaturized sensors and improved electrode designs are enhancing measurement precision and durability. The integration of advanced algorithms and data analysis tools is enabling more efficient and insightful results. These innovations are tailored to specific market needs, providing competitive advantages through enhanced functionality and user experience.
Report Segmentation & Scope
The report segments the pH meters market based on product type (benchtop, portable, online), technology (glass electrode, ISFET), application (water treatment, food and beverage, pharmaceutical, environmental monitoring), and geography (North America, Europe, Asia-Pacific, Rest of the World). Each segment's growth projections, market sizes, and competitive dynamics are meticulously analyzed, providing a granular understanding of the market landscape. For example, the benchtop segment is expected to grow at xx% CAGR, while the portable segment is projected to achieve xx% CAGR. The variations are primarily driven by the unique demands of each application and the associated technological developments.
Key Drivers of pH Meters Market Growth
Several factors are driving the expansion of the pH meters market. Firstly, stringent environmental regulations across the globe mandate accurate pH monitoring, particularly in water treatment and environmental monitoring applications. Secondly, the growing demand for quality control and process optimization in various industries, including pharmaceuticals and food & beverages, fuels the need for advanced pH measurement tools. Thirdly, technological advancements leading to improved accuracy, portability, and data management capabilities are creating attractive propositions for end-users.
Challenges in the pH Meters Market Sector
The pH meters market faces challenges including the high initial investment cost associated with advanced instruments and the potential for electrode degradation, affecting measurement accuracy over time. Moreover, competition among key players can exert price pressure. Supply chain disruptions can also impact availability and pricing. Furthermore, the need for skilled technicians for calibration and maintenance adds to the operational costs, creating a barrier for some potential users. These factors can hinder the market's growth, although technological and operational innovations are progressively mitigating these issues.
Leading Players in the pH Meters Market Market
- Danaher Corporation
- Hanna Instruments
- Thermo Fisher Scientific Corporation
- PerkinElmer Inc
- Metrohm
- Fann Instrument
- Xylem
- Bante Instruments
- OMEGA
Key Developments in pH Meters Market Sector
- November 2023: SUNTEX launched the 2000 Series Benchtop pH Meter, including the SP-2310 Benchtop pH/ORP Meter and SP-2510 Benchtop ION/pH/ORP Meter. This expansion strengthens SUNTEX's position in the benchtop pH meter segment.
- January 2023: Metravi Instruments Pvt. Ltd launched the PH-700 Digital pH Meter, a compact and portable option expanding the choices for users requiring on-site or field testing.
Strategic pH Meters Market Market Outlook
The pH meters market is poised for continued growth, fueled by increasing industrialization, stringent environmental regulations, and technological advancements. Strategic opportunities exist in developing innovative, user-friendly, and cost-effective instruments tailored to specific application needs. Expansion into emerging markets and strategic partnerships will play a crucial role in shaping market dynamics and driving future growth. The focus on enhanced data analytics and connectivity features will further enhance the value proposition of pH meters, bolstering market growth in the coming years.
pH Meters Market Segmentation
-
1. Product Type
- 1.1. Benchtop pH Meters
- 1.2. Portable pH Meters
- 1.3. Continuous pH Meters
-
2. Application
- 2.1. Pharmaceuticals Industry
- 2.2. Biopharmaceutical Industry
- 2.3. Diagnostic Centers
- 2.4. Others Apllications
pH Meters Market Segmentation By Geography
-
1. North America
- 1.1. United States
- 1.2. Canada
- 1.3. Mexico
-
2. Europe
- 2.1. Germany
- 2.2. United Kingdom
- 2.3. France
- 2.4. Italy
- 2.5. Spain
- 2.6. Rest of Europe
-
3. Asia Pacific
- 3.1. China
- 3.2. Japan
- 3.3. India
- 3.4. Australia
- 3.5. South Korea
- 3.6. Rest of Asia Pacific
-
4. Middle East and Africa
- 4.1. GCC
- 4.2. South Africa
- 4.3. Rest of Middle East and Africa
-
5. South America
- 5.1. Brazil
- 5.2. Argentina
- 5.3. Rest of South America
pH Meters Market REPORT HIGHLIGHTS
| Aspects | Details |
|---|---|
| Study Period | 2019-2033 |
| Base Year | 2024 |
| Estimated Year | 2025 |
| Forecast Period | 2025-2033 |
| Historical Period | 2019-2024 |
| Growth Rate | CAGR of 4.95% from 2019-2033 |
| Segmentation |
|
Table of Contents
- 1. Introduction
- 1.1. Research Scope
- 1.2. Market Segmentation
- 1.3. Research Methodology
- 1.4. Definitions and Assumptions
- 2. Executive Summary
- 2.1. Introduction
- 3. Market Dynamics
- 3.1. Introduction
- 3.2. Market Drivers
- 3.2.1. Rising Research and Development Activities; Growing Technological Advancements of pH Meters
- 3.3. Market Restrains
- 3.3.1. Rising Research and Development Activities; Growing Technological Advancements of pH Meters
- 3.4. Market Trends
- 3.4.1. The Benchtop pH Meter Segment is Expected to Hold the Significant Market Share During the Forecast Period
- 4. Market Factor Analysis
- 4.1. Porters Five Forces
- 4.2. Supply/Value Chain
- 4.3. PESTEL analysis
- 4.4. Market Entropy
- 4.5. Patent/Trademark Analysis
- 5. Global pH Meters Market Analysis, Insights and Forecast, 2019-2031
- 5.1. Market Analysis, Insights and Forecast - by Product Type
- 5.1.1. Benchtop pH Meters
- 5.1.2. Portable pH Meters
- 5.1.3. Continuous pH Meters
- 5.2. Market Analysis, Insights and Forecast - by Application
- 5.2.1. Pharmaceuticals Industry
- 5.2.2. Biopharmaceutical Industry
- 5.2.3. Diagnostic Centers
- 5.2.4. Others Apllications
- 5.3. Market Analysis, Insights and Forecast - by Region
- 5.3.1. North America
- 5.3.2. Europe
- 5.3.3. Asia Pacific
- 5.3.4. Middle East and Africa
- 5.3.5. South America
- 5.1. Market Analysis, Insights and Forecast - by Product Type
- 6. North America pH Meters Market Analysis, Insights and Forecast, 2019-2031
- 6.1. Market Analysis, Insights and Forecast - by Product Type
- 6.1.1. Benchtop pH Meters
- 6.1.2. Portable pH Meters
- 6.1.3. Continuous pH Meters
- 6.2. Market Analysis, Insights and Forecast - by Application
- 6.2.1. Pharmaceuticals Industry
- 6.2.2. Biopharmaceutical Industry
- 6.2.3. Diagnostic Centers
- 6.2.4. Others Apllications
- 6.1. Market Analysis, Insights and Forecast - by Product Type
- 7. Europe pH Meters Market Analysis, Insights and Forecast, 2019-2031
- 7.1. Market Analysis, Insights and Forecast - by Product Type
- 7.1.1. Benchtop pH Meters
- 7.1.2. Portable pH Meters
- 7.1.3. Continuous pH Meters
- 7.2. Market Analysis, Insights and Forecast - by Application
- 7.2.1. Pharmaceuticals Industry
- 7.2.2. Biopharmaceutical Industry
- 7.2.3. Diagnostic Centers
- 7.2.4. Others Apllications
- 7.1. Market Analysis, Insights and Forecast - by Product Type
- 8. Asia Pacific pH Meters Market Analysis, Insights and Forecast, 2019-2031
- 8.1. Market Analysis, Insights and Forecast - by Product Type
- 8.1.1. Benchtop pH Meters
- 8.1.2. Portable pH Meters
- 8.1.3. Continuous pH Meters
- 8.2. Market Analysis, Insights and Forecast - by Application
- 8.2.1. Pharmaceuticals Industry
- 8.2.2. Biopharmaceutical Industry
- 8.2.3. Diagnostic Centers
- 8.2.4. Others Apllications
- 8.1. Market Analysis, Insights and Forecast - by Product Type
- 9. Middle East and Africa pH Meters Market Analysis, Insights and Forecast, 2019-2031
- 9.1. Market Analysis, Insights and Forecast - by Product Type
- 9.1.1. Benchtop pH Meters
- 9.1.2. Portable pH Meters
- 9.1.3. Continuous pH Meters
- 9.2. Market Analysis, Insights and Forecast - by Application
- 9.2.1. Pharmaceuticals Industry
- 9.2.2. Biopharmaceutical Industry
- 9.2.3. Diagnostic Centers
- 9.2.4. Others Apllications
- 9.1. Market Analysis, Insights and Forecast - by Product Type
- 10. South America pH Meters Market Analysis, Insights and Forecast, 2019-2031
- 10.1. Market Analysis, Insights and Forecast - by Product Type
- 10.1.1. Benchtop pH Meters
- 10.1.2. Portable pH Meters
- 10.1.3. Continuous pH Meters
- 10.2. Market Analysis, Insights and Forecast - by Application
- 10.2.1. Pharmaceuticals Industry
- 10.2.2. Biopharmaceutical Industry
- 10.2.3. Diagnostic Centers
- 10.2.4. Others Apllications
- 10.1. Market Analysis, Insights and Forecast - by Product Type
- 11. Competitive Analysis
- 11.1. Global Market Share Analysis 2024
- 11.2. Company Profiles
- 11.2.1 Danaher Corporation
- 11.2.1.1. Overview
- 11.2.1.2. Products
- 11.2.1.3. SWOT Analysis
- 11.2.1.4. Recent Developments
- 11.2.1.5. Financials (Based on Availability)
- 11.2.2 Hanna Instruments
- 11.2.2.1. Overview
- 11.2.2.2. Products
- 11.2.2.3. SWOT Analysis
- 11.2.2.4. Recent Developments
- 11.2.2.5. Financials (Based on Availability)
- 11.2.3 Thermo Fisher Scientific Corporation
- 11.2.3.1. Overview
- 11.2.3.2. Products
- 11.2.3.3. SWOT Analysis
- 11.2.3.4. Recent Developments
- 11.2.3.5. Financials (Based on Availability)
- 11.2.4 PerkinElmer Inc
- 11.2.4.1. Overview
- 11.2.4.2. Products
- 11.2.4.3. SWOT Analysis
- 11.2.4.4. Recent Developments
- 11.2.4.5. Financials (Based on Availability)
- 11.2.5 Metrohm
- 11.2.5.1. Overview
- 11.2.5.2. Products
- 11.2.5.3. SWOT Analysis
- 11.2.5.4. Recent Developments
- 11.2.5.5. Financials (Based on Availability)
- 11.2.6 Fann Instrument
- 11.2.6.1. Overview
- 11.2.6.2. Products
- 11.2.6.3. SWOT Analysis
- 11.2.6.4. Recent Developments
- 11.2.6.5. Financials (Based on Availability)
- 11.2.7 Xylem
- 11.2.7.1. Overview
- 11.2.7.2. Products
- 11.2.7.3. SWOT Analysis
- 11.2.7.4. Recent Developments
- 11.2.7.5. Financials (Based on Availability)
- 11.2.8 Bante Instruments
- 11.2.8.1. Overview
- 11.2.8.2. Products
- 11.2.8.3. SWOT Analysis
- 11.2.8.4. Recent Developments
- 11.2.8.5. Financials (Based on Availability)
- 11.2.9 OMEGA*List Not Exhaustive
- 11.2.9.1. Overview
- 11.2.9.2. Products
- 11.2.9.3. SWOT Analysis
- 11.2.9.4. Recent Developments
- 11.2.9.5. Financials (Based on Availability)
- 11.2.1 Danaher Corporation
List of Figures
- Figure 1: Global pH Meters Market Revenue Breakdown (Million, %) by Region 2024 & 2032
- Figure 2: Global pH Meters Market Volume Breakdown (Million, %) by Region 2024 & 2032
- Figure 3: North America pH Meters Market Revenue (Million), by Product Type 2024 & 2032
- Figure 4: North America pH Meters Market Volume (Million), by Product Type 2024 & 2032
- Figure 5: North America pH Meters Market Revenue Share (%), by Product Type 2024 & 2032
- Figure 6: North America pH Meters Market Volume Share (%), by Product Type 2024 & 2032
- Figure 7: North America pH Meters Market Revenue (Million), by Application 2024 & 2032
- Figure 8: North America pH Meters Market Volume (Million), by Application 2024 & 2032
- Figure 9: North America pH Meters Market Revenue Share (%), by Application 2024 & 2032
- Figure 10: North America pH Meters Market Volume Share (%), by Application 2024 & 2032
- Figure 11: North America pH Meters Market Revenue (Million), by Country 2024 & 2032
- Figure 12: North America pH Meters Market Volume (Million), by Country 2024 & 2032
- Figure 13: North America pH Meters Market Revenue Share (%), by Country 2024 & 2032
- Figure 14: North America pH Meters Market Volume Share (%), by Country 2024 & 2032
- Figure 15: Europe pH Meters Market Revenue (Million), by Product Type 2024 & 2032
- Figure 16: Europe pH Meters Market Volume (Million), by Product Type 2024 & 2032
- Figure 17: Europe pH Meters Market Revenue Share (%), by Product Type 2024 & 2032
- Figure 18: Europe pH Meters Market Volume Share (%), by Product Type 2024 & 2032
- Figure 19: Europe pH Meters Market Revenue (Million), by Application 2024 & 2032
- Figure 20: Europe pH Meters Market Volume (Million), by Application 2024 & 2032
- Figure 21: Europe pH Meters Market Revenue Share (%), by Application 2024 & 2032
- Figure 22: Europe pH Meters Market Volume Share (%), by Application 2024 & 2032
- Figure 23: Europe pH Meters Market Revenue (Million), by Country 2024 & 2032
- Figure 24: Europe pH Meters Market Volume (Million), by Country 2024 & 2032
- Figure 25: Europe pH Meters Market Revenue Share (%), by Country 2024 & 2032
- Figure 26: Europe pH Meters Market Volume Share (%), by Country 2024 & 2032
- Figure 27: Asia Pacific pH Meters Market Revenue (Million), by Product Type 2024 & 2032
- Figure 28: Asia Pacific pH Meters Market Volume (Million), by Product Type 2024 & 2032
- Figure 29: Asia Pacific pH Meters Market Revenue Share (%), by Product Type 2024 & 2032
- Figure 30: Asia Pacific pH Meters Market Volume Share (%), by Product Type 2024 & 2032
- Figure 31: Asia Pacific pH Meters Market Revenue (Million), by Application 2024 & 2032
- Figure 32: Asia Pacific pH Meters Market Volume (Million), by Application 2024 & 2032
- Figure 33: Asia Pacific pH Meters Market Revenue Share (%), by Application 2024 & 2032
- Figure 34: Asia Pacific pH Meters Market Volume Share (%), by Application 2024 & 2032
- Figure 35: Asia Pacific pH Meters Market Revenue (Million), by Country 2024 & 2032
- Figure 36: Asia Pacific pH Meters Market Volume (Million), by Country 2024 & 2032
- Figure 37: Asia Pacific pH Meters Market Revenue Share (%), by Country 2024 & 2032
- Figure 38: Asia Pacific pH Meters Market Volume Share (%), by Country 2024 & 2032
- Figure 39: Middle East and Africa pH Meters Market Revenue (Million), by Product Type 2024 & 2032
- Figure 40: Middle East and Africa pH Meters Market Volume (Million), by Product Type 2024 & 2032
- Figure 41: Middle East and Africa pH Meters Market Revenue Share (%), by Product Type 2024 & 2032
- Figure 42: Middle East and Africa pH Meters Market Volume Share (%), by Product Type 2024 & 2032
- Figure 43: Middle East and Africa pH Meters Market Revenue (Million), by Application 2024 & 2032
- Figure 44: Middle East and Africa pH Meters Market Volume (Million), by Application 2024 & 2032
- Figure 45: Middle East and Africa pH Meters Market Revenue Share (%), by Application 2024 & 2032
- Figure 46: Middle East and Africa pH Meters Market Volume Share (%), by Application 2024 & 2032
- Figure 47: Middle East and Africa pH Meters Market Revenue (Million), by Country 2024 & 2032
- Figure 48: Middle East and Africa pH Meters Market Volume (Million), by Country 2024 & 2032
- Figure 49: Middle East and Africa pH Meters Market Revenue Share (%), by Country 2024 & 2032
- Figure 50: Middle East and Africa pH Meters Market Volume Share (%), by Country 2024 & 2032
- Figure 51: South America pH Meters Market Revenue (Million), by Product Type 2024 & 2032
- Figure 52: South America pH Meters Market Volume (Million), by Product Type 2024 & 2032
- Figure 53: South America pH Meters Market Revenue Share (%), by Product Type 2024 & 2032
- Figure 54: South America pH Meters Market Volume Share (%), by Product Type 2024 & 2032
- Figure 55: South America pH Meters Market Revenue (Million), by Application 2024 & 2032
- Figure 56: South America pH Meters Market Volume (Million), by Application 2024 & 2032
- Figure 57: South America pH Meters Market Revenue Share (%), by Application 2024 & 2032
- Figure 58: South America pH Meters Market Volume Share (%), by Application 2024 & 2032
- Figure 59: South America pH Meters Market Revenue (Million), by Country 2024 & 2032
- Figure 60: South America pH Meters Market Volume (Million), by Country 2024 & 2032
- Figure 61: South America pH Meters Market Revenue Share (%), by Country 2024 & 2032
- Figure 62: South America pH Meters Market Volume Share (%), by Country 2024 & 2032
List of Tables
- Table 1: Global pH Meters Market Revenue Million Forecast, by Region 2019 & 2032
- Table 2: Global pH Meters Market Volume Million Forecast, by Region 2019 & 2032
- Table 3: Global pH Meters Market Revenue Million Forecast, by Product Type 2019 & 2032
- Table 4: Global pH Meters Market Volume Million Forecast, by Product Type 2019 & 2032
- Table 5: Global pH Meters Market Revenue Million Forecast, by Application 2019 & 2032
- Table 6: Global pH Meters Market Volume Million Forecast, by Application 2019 & 2032
- Table 7: Global pH Meters Market Revenue Million Forecast, by Region 2019 & 2032
- Table 8: Global pH Meters Market Volume Million Forecast, by Region 2019 & 2032
- Table 9: Global pH Meters Market Revenue Million Forecast, by Product Type 2019 & 2032
- Table 10: Global pH Meters Market Volume Million Forecast, by Product Type 2019 & 2032
- Table 11: Global pH Meters Market Revenue Million Forecast, by Application 2019 & 2032
- Table 12: Global pH Meters Market Volume Million Forecast, by Application 2019 & 2032
- Table 13: Global pH Meters Market Revenue Million Forecast, by Country 2019 & 2032
- Table 14: Global pH Meters Market Volume Million Forecast, by Country 2019 & 2032
- Table 15: United States pH Meters Market Revenue (Million) Forecast, by Application 2019 & 2032
- Table 16: United States pH Meters Market Volume (Million) Forecast, by Application 2019 & 2032
- Table 17: Canada pH Meters Market Revenue (Million) Forecast, by Application 2019 & 2032
- Table 18: Canada pH Meters Market Volume (Million) Forecast, by Application 2019 & 2032
- Table 19: Mexico pH Meters Market Revenue (Million) Forecast, by Application 2019 & 2032
- Table 20: Mexico pH Meters Market Volume (Million) Forecast, by Application 2019 & 2032
- Table 21: Global pH Meters Market Revenue Million Forecast, by Product Type 2019 & 2032
- Table 22: Global pH Meters Market Volume Million Forecast, by Product Type 2019 & 2032
- Table 23: Global pH Meters Market Revenue Million Forecast, by Application 2019 & 2032
- Table 24: Global pH Meters Market Volume Million Forecast, by Application 2019 & 2032
- Table 25: Global pH Meters Market Revenue Million Forecast, by Country 2019 & 2032
- Table 26: Global pH Meters Market Volume Million Forecast, by Country 2019 & 2032
- Table 27: Germany pH Meters Market Revenue (Million) Forecast, by Application 2019 & 2032
- Table 28: Germany pH Meters Market Volume (Million) Forecast, by Application 2019 & 2032
- Table 29: United Kingdom pH Meters Market Revenue (Million) Forecast, by Application 2019 & 2032
- Table 30: United Kingdom pH Meters Market Volume (Million) Forecast, by Application 2019 & 2032
- Table 31: France pH Meters Market Revenue (Million) Forecast, by Application 2019 & 2032
- Table 32: France pH Meters Market Volume (Million) Forecast, by Application 2019 & 2032
- Table 33: Italy pH Meters Market Revenue (Million) Forecast, by Application 2019 & 2032
- Table 34: Italy pH Meters Market Volume (Million) Forecast, by Application 2019 & 2032
- Table 35: Spain pH Meters Market Revenue (Million) Forecast, by Application 2019 & 2032
- Table 36: Spain pH Meters Market Volume (Million) Forecast, by Application 2019 & 2032
- Table 37: Rest of Europe pH Meters Market Revenue (Million) Forecast, by Application 2019 & 2032
- Table 38: Rest of Europe pH Meters Market Volume (Million) Forecast, by Application 2019 & 2032
- Table 39: Global pH Meters Market Revenue Million Forecast, by Product Type 2019 & 2032
- Table 40: Global pH Meters Market Volume Million Forecast, by Product Type 2019 & 2032
- Table 41: Global pH Meters Market Revenue Million Forecast, by Application 2019 & 2032
- Table 42: Global pH Meters Market Volume Million Forecast, by Application 2019 & 2032
- Table 43: Global pH Meters Market Revenue Million Forecast, by Country 2019 & 2032
- Table 44: Global pH Meters Market Volume Million Forecast, by Country 2019 & 2032
- Table 45: China pH Meters Market Revenue (Million) Forecast, by Application 2019 & 2032
- Table 46: China pH Meters Market Volume (Million) Forecast, by Application 2019 & 2032
- Table 47: Japan pH Meters Market Revenue (Million) Forecast, by Application 2019 & 2032
- Table 48: Japan pH Meters Market Volume (Million) Forecast, by Application 2019 & 2032
- Table 49: India pH Meters Market Revenue (Million) Forecast, by Application 2019 & 2032
- Table 50: India pH Meters Market Volume (Million) Forecast, by Application 2019 & 2032
- Table 51: Australia pH Meters Market Revenue (Million) Forecast, by Application 2019 & 2032
- Table 52: Australia pH Meters Market Volume (Million) Forecast, by Application 2019 & 2032
- Table 53: South Korea pH Meters Market Revenue (Million) Forecast, by Application 2019 & 2032
- Table 54: South Korea pH Meters Market Volume (Million) Forecast, by Application 2019 & 2032
- Table 55: Rest of Asia Pacific pH Meters Market Revenue (Million) Forecast, by Application 2019 & 2032
- Table 56: Rest of Asia Pacific pH Meters Market Volume (Million) Forecast, by Application 2019 & 2032
- Table 57: Global pH Meters Market Revenue Million Forecast, by Product Type 2019 & 2032
- Table 58: Global pH Meters Market Volume Million Forecast, by Product Type 2019 & 2032
- Table 59: Global pH Meters Market Revenue Million Forecast, by Application 2019 & 2032
- Table 60: Global pH Meters Market Volume Million Forecast, by Application 2019 & 2032
- Table 61: Global pH Meters Market Revenue Million Forecast, by Country 2019 & 2032
- Table 62: Global pH Meters Market Volume Million Forecast, by Country 2019 & 2032
- Table 63: GCC pH Meters Market Revenue (Million) Forecast, by Application 2019 & 2032
- Table 64: GCC pH Meters Market Volume (Million) Forecast, by Application 2019 & 2032
- Table 65: South Africa pH Meters Market Revenue (Million) Forecast, by Application 2019 & 2032
- Table 66: South Africa pH Meters Market Volume (Million) Forecast, by Application 2019 & 2032
- Table 67: Rest of Middle East and Africa pH Meters Market Revenue (Million) Forecast, by Application 2019 & 2032
- Table 68: Rest of Middle East and Africa pH Meters Market Volume (Million) Forecast, by Application 2019 & 2032
- Table 69: Global pH Meters Market Revenue Million Forecast, by Product Type 2019 & 2032
- Table 70: Global pH Meters Market Volume Million Forecast, by Product Type 2019 & 2032
- Table 71: Global pH Meters Market Revenue Million Forecast, by Application 2019 & 2032
- Table 72: Global pH Meters Market Volume Million Forecast, by Application 2019 & 2032
- Table 73: Global pH Meters Market Revenue Million Forecast, by Country 2019 & 2032
- Table 74: Global pH Meters Market Volume Million Forecast, by Country 2019 & 2032
- Table 75: Brazil pH Meters Market Revenue (Million) Forecast, by Application 2019 & 2032
- Table 76: Brazil pH Meters Market Volume (Million) Forecast, by Application 2019 & 2032
- Table 77: Argentina pH Meters Market Revenue (Million) Forecast, by Application 2019 & 2032
- Table 78: Argentina pH Meters Market Volume (Million) Forecast, by Application 2019 & 2032
- Table 79: Rest of South America pH Meters Market Revenue (Million) Forecast, by Application 2019 & 2032
- Table 80: Rest of South America pH Meters Market Volume (Million) Forecast, by Application 2019 & 2032
Frequently Asked Questions
1. What is the projected Compound Annual Growth Rate (CAGR) of the pH Meters Market?
The projected CAGR is approximately 4.95%.
2. Which companies are prominent players in the pH Meters Market?
Key companies in the market include Danaher Corporation, Hanna Instruments, Thermo Fisher Scientific Corporation, PerkinElmer Inc, Metrohm, Fann Instrument, Xylem, Bante Instruments, OMEGA*List Not Exhaustive.
3. What are the main segments of the pH Meters Market?
The market segments include Product Type, Application.
4. Can you provide details about the market size?
The market size is estimated to be USD 716.90 Million as of 2022.
5. What are some drivers contributing to market growth?
Rising Research and Development Activities; Growing Technological Advancements of pH Meters.
6. What are the notable trends driving market growth?
The Benchtop pH Meter Segment is Expected to Hold the Significant Market Share During the Forecast Period.
7. Are there any restraints impacting market growth?
Rising Research and Development Activities; Growing Technological Advancements of pH Meters.
8. Can you provide examples of recent developments in the market?
November 2023: SUNTEX, a laboratory instrument provider, launched 2000 Series Benchtop pH Meter such as SP-2310 Benchtop pH/ORP Meter and SP-2510 Benchtop ION/pH/ORP Meter.
9. What pricing options are available for accessing the report?
Pricing options include single-user, multi-user, and enterprise licenses priced at USD 4750, USD 5250, and USD 8750 respectively.
10. Is the market size provided in terms of value or volume?
The market size is provided in terms of value, measured in Million and volume, measured in Million.
11. Are there any specific market keywords associated with the report?
Yes, the market keyword associated with the report is "pH Meters Market," which aids in identifying and referencing the specific market segment covered.
12. How do I determine which pricing option suits my needs best?
The pricing options vary based on user requirements and access needs. Individual users may opt for single-user licenses, while businesses requiring broader access may choose multi-user or enterprise licenses for cost-effective access to the report.
13. Are there any additional resources or data provided in the pH Meters Market report?
While the report offers comprehensive insights, it's advisable to review the specific contents or supplementary materials provided to ascertain if additional resources or data are available.
14. How can I stay updated on further developments or reports in the pH Meters Market?
To stay informed about further developments, trends, and reports in the pH Meters Market, consider subscribing to industry newsletters, following relevant companies and organizations, or regularly checking reputable industry news sources and publications.
Methodology
Step 1 - Identification of Relevant Samples Size from Population Database


Step 2 - Approaches for Defining Global Market Size (Value, Volume* & Price*)

Note*: In applicable scenarios
Step 3 - Data Sources
Primary Research
- Web Analytics
- Survey Reports
- Research Institute
- Latest Research Reports
- Opinion Leaders
Secondary Research
- Annual Reports
- White Paper
- Latest Press Release
- Industry Association
- Paid Database
- Investor Presentations

Step 4 - Data Triangulation
Involves using different sources of information in order to increase the validity of a study
These sources are likely to be stakeholders in a program - participants, other researchers, program staff, other community members, and so on.
Then we put all data in single framework & apply various statistical tools to find out the dynamic on the market.
During the analysis stage, feedback from the stakeholder groups would be compared to determine areas of agreement as well as areas of divergence


