
Key Insights
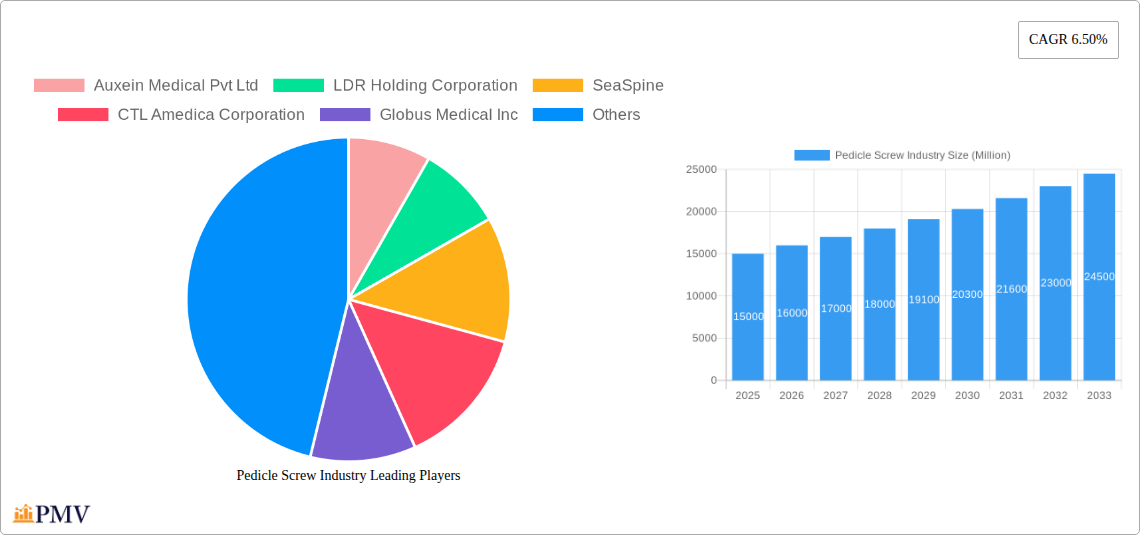
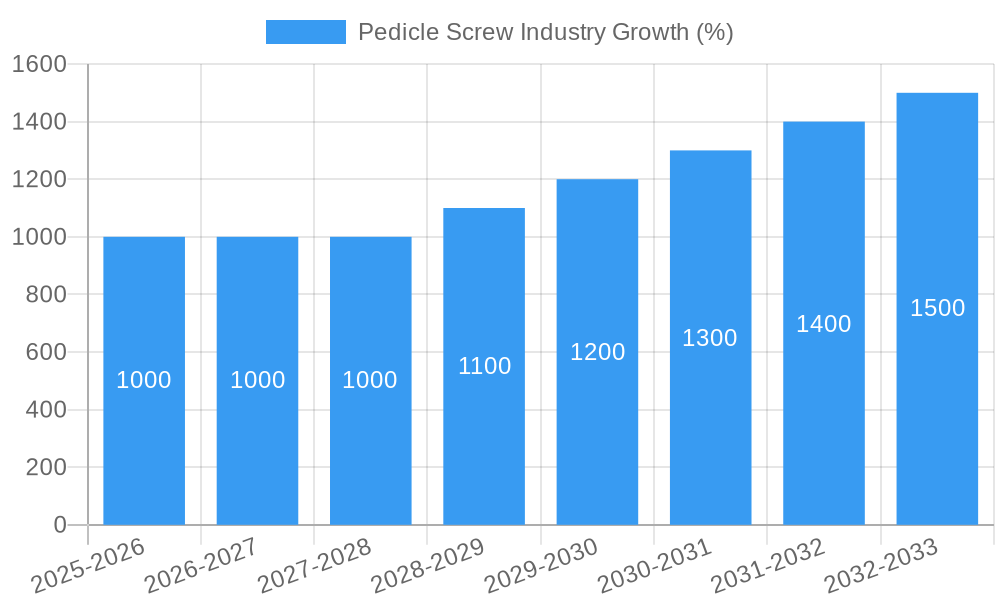
The global pedicle screw market is experiencing robust growth, projected to reach a significant size by 2033. A compound annual growth rate (CAGR) of 6.50% from 2025 to 2033 indicates a consistently expanding market fueled by several key drivers. The increasing prevalence of spinal disorders like trauma, deformities, and degeneration, coupled with a rising geriatric population susceptible to these conditions, is a primary factor driving demand. Advances in minimally invasive surgical techniques (MIS) are further contributing to market expansion, offering patients less invasive procedures with faster recovery times. The adoption of innovative pedicle screw designs, such as polyaxial screws offering greater precision and flexibility during surgery, is also positively impacting market growth. Technological advancements in imaging and navigation systems enhance surgical accuracy, boosting confidence amongst surgeons and contributing to the market's positive trajectory. Competition among established players like Medtronic, Johnson & Johnson, and Stryker, alongside emerging companies, fosters innovation and drives down costs, making pedicle screw systems more accessible. However, potential restraints include the high cost of surgeries, particularly in developing regions, and the risk of complications associated with pedicle screw implantation. Nevertheless, the ongoing technological advancements and the escalating prevalence of spinal pathologies are anticipated to outweigh these limitations, ensuring continued market growth throughout the forecast period.
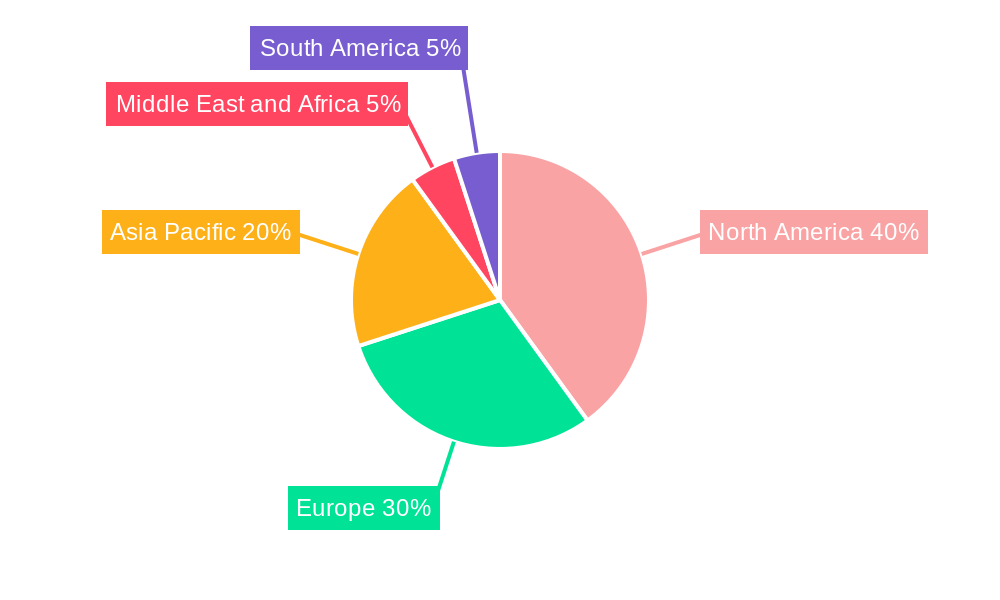
The market segmentation reveals significant opportunities within specific areas. Minimally invasive surgery is witnessing rapid growth due to its advantages. Polyaxial pedicle screws hold a larger market share compared to monoaxial screws owing to their superior functionality. Spinal trauma injuries and spinal deformities represent substantial segments, reflecting the high incidence of these conditions. Geographically, North America and Europe currently dominate the market due to higher healthcare expenditure and advanced medical infrastructure. However, the Asia-Pacific region is exhibiting significant growth potential, driven by increasing healthcare awareness and improving healthcare infrastructure in emerging economies like India and China. The forecast period will likely see continued market expansion across all segments and regions, driven by technological innovation, improved surgical techniques, and an aging global population.
Pedicle Screw Industry Market Report: 2019-2033
This comprehensive report provides a detailed analysis of the global pedicle screw industry, offering invaluable insights for stakeholders across the value chain. Covering the period from 2019 to 2033, with a focus on 2025, this report meticulously examines market dynamics, competitive landscapes, and future growth prospects. The study period (2019-2024) and forecast period (2025-2033) provide a holistic view, enabling informed strategic decision-making. The base year for this analysis is 2025, and the estimated year is also 2025. The report value is in Millions.
Pedicle Screw Industry Market Structure & Competitive Dynamics
The global pedicle screw market is characterized by a moderately concentrated structure, with several multinational corporations dominating the landscape. Key players such as Medtronic PLC, Johnson & Johnson, Stryker Corporation, and Zimmer Biomet hold significant market share, influencing pricing strategies and technological advancements. The market exhibits a dynamic innovation ecosystem, with ongoing R&D efforts focusing on minimally invasive surgical techniques, improved biomaterial properties, and advanced implant designs. Stringent regulatory frameworks, particularly in developed markets like the US and Europe, necessitate compliance with stringent safety and efficacy standards, influencing product development timelines and market entry strategies. Substitute products, such as interbody fusion devices and dynamic stabilization systems, present competitive challenges, but the demand for pedicle screws remains robust due to their established efficacy and wide applicability. End-user trends increasingly favor minimally invasive procedures, driving demand for smaller, less-invasive devices. Significant M&A activity in the past decade has reshaped the competitive landscape; deal values have ranged from xx Million to xx Million, with larger companies acquiring smaller, specialized firms to broaden their product portfolios and geographical reach. Market concentration, measured by the Herfindahl-Hirschman Index (HHI), is estimated to be xx.
- Market Share (2025 Estimate): Medtronic PLC (xx%), Johnson & Johnson (xx%), Stryker Corporation (xx%), Zimmer Biomet (xx%), Others (xx%).
- Recent M&A Activity: While specific deal values aren't publicly available for all transactions, the average deal value in the last 5 years has been approximately xx Million.
Pedicle Screw Industry Trends & Insights
The global pedicle screw market is experiencing robust growth, driven by an aging global population, an increase in the incidence of spinal disorders (spinal degeneration, trauma, and deformities), and technological advancements that enhance surgical precision and patient outcomes. The market is witnessing a significant shift toward minimally invasive surgery (MIS), fueled by reduced patient trauma, shorter hospital stays, and faster recovery times. This trend is propelling the demand for smaller, more adaptable pedicle screw systems designed for MIS procedures. Technological advancements, such as 3D-printed implants, navigation systems, and robotics, are improving surgical precision, reducing complications, and boosting patient satisfaction. These innovations, combined with increasing disposable incomes in emerging economies, are key growth drivers. Consumer preferences are aligning with less invasive options, pushing demand for MIS-compatible devices and streamlined surgical workflows. The competitive dynamics are intensifying, with companies investing heavily in R&D, pursuing strategic partnerships, and launching innovative products to gain a competitive edge. The compound annual growth rate (CAGR) during the forecast period (2025-2033) is estimated to be xx%, indicating strong market expansion. Market penetration for MIS pedicle screws is projected to reach xx% by 2033, significantly increasing from the current xx%.
Dominant Markets & Segments in Pedicle Screw Industry
The North American region currently dominates the global pedicle screw market, driven by high healthcare expenditure, advanced medical infrastructure, and a relatively high prevalence of spinal disorders. Within North America, the United States holds the largest market share. Europe follows as a significant market, exhibiting substantial growth potential. The Asia-Pacific region is anticipated to register the highest CAGR during the forecast period, fueled by rising disposable incomes, expanding healthcare infrastructure, and increasing awareness of spinal conditions.
- By Surgery Type: Minimally Invasive Surgery is the fastest-growing segment, driven by patient preference and technological advancements.
- By Product: Polyaxial pedicle screws hold a larger market share compared to monoaxial screws due to their enhanced flexibility and adaptability in complex spinal surgeries.
- By Indication: Spinal Degeneration and Spinal Deformities are the leading indications for pedicle screw usage, owing to their high prevalence globally.
Key Drivers for Regional Dominance:
- North America: High healthcare expenditure, advanced medical infrastructure, high prevalence of spinal disorders.
- Europe: Well-established healthcare systems, increasing adoption of advanced surgical techniques.
- Asia-Pacific: Rising disposable incomes, growing awareness about spinal health, and expanding healthcare infrastructure.
Pedicle Screw Industry Product Innovations
Recent innovations in the pedicle screw market focus on improving surgical precision, minimizing invasiveness, and enhancing implant biocompatibility. This includes the development of smaller, less-invasive screws, improved locking mechanisms, and the incorporation of advanced materials for enhanced osseointegration. Technological advancements such as 3D printing and robotics are further enhancing surgical accuracy and reducing procedure times. These innovations cater to growing demand for less invasive surgeries and superior patient outcomes, contributing to market expansion. For example, the recent FDA clearance of SurGenTec's ION Screw signifies a step forward in stand-alone spine fixation technology.
Report Segmentation & Scope
This report segments the pedicle screw market comprehensively:
- By Surgery Type: Open Surgery and Minimally Invasive Surgery. Minimally invasive surgery is expected to experience faster growth due to its advantages. Open surgery continues to hold a significant market share, but its growth is projected to be slower.
- By Product: Monoaxial Pedicle Screw, Polyaxial Pedicle Screw, and Other Products (e.g., supplemental fixation devices). Polyaxial screws dominate due to their versatility.
- By Indication: Spinal Trauma Injuries, Spinal Deformities, Spinal Degeneration, and Other Indications. Spinal degeneration and deformities represent the largest segments.
Each segment's market size, growth projections, and competitive dynamics are detailed within the full report.
Key Drivers of Pedicle Screw Industry Growth
The pedicle screw market is driven by several factors: a growing geriatric population with increased spinal disorders, technological advancements leading to minimally invasive surgeries and improved implant designs, rising healthcare expenditure globally, and favorable regulatory environments promoting innovation. The increasing awareness of spinal health and the growing demand for better patient outcomes further fuel market growth. Government initiatives promoting healthcare infrastructure development in emerging markets also contribute to this expansion.
Challenges in the Pedicle Screw Industry Sector
The pedicle screw industry faces challenges including stringent regulatory approvals, complexities in supply chain management due to the specialized nature of the products, and intense competition among established players. High manufacturing and research costs, coupled with the potential for product recalls and lawsuits related to adverse events, present financial risks. Furthermore, the availability of substitute treatment modalities can affect market penetration. These challenges impact profitability and necessitate strategic planning.
Leading Players in the Pedicle Screw Industry Market
- Medtronic PLC
- Johnson & Johnson
- Stryker Corporation
- Zimmer Biomet
- Globus Medical Inc
- Alphatec Holding Inc
- Auxein Medical Pvt Ltd
- B Braun SE
- CTL Amedica Corporation
- LDR Holding Corporation
- SeaSpine
Key Developments in Pedicle Screw Industry Sector
- March 2022: SurGenTec received FDA clearance for its ION Screw, a proprietary stand-alone spine fixation implant. This enhances the company’s product portfolio and competitiveness.
- February 2022: OsteoCentric Technologies entered a private label agreement with Altus Spine to launch its subsidiary, OsteoCentric Spine, LLC, into the pedicle screw market. This strategic move expands market presence for both companies.
Strategic Pedicle Screw Industry Market Outlook
The future of the pedicle screw industry appears promising, driven by continuous technological innovation, growing awareness about spinal health, and an expanding geriatric population. Strategic opportunities lie in developing minimally invasive systems, personalized implants, and smart technologies for improved surgical outcomes. Companies focusing on R&D, strategic partnerships, and effective market penetration strategies are poised for significant growth in this dynamic market. The increasing focus on value-based healthcare will also influence the industry, with a growing emphasis on cost-effectiveness and improved patient outcomes.
Pedicle Screw Industry Segmentation
-
1. Surgery Type
- 1.1. Open Surgery
- 1.2. Minimally Invasive Surgery
-
2. Product
- 2.1. Monoaxial Pedicle Screw
- 2.2. Polyaxial Pedicle Screw
- 2.3. Other Products
-
3. Indication
- 3.1. Spinal Trauma Injuries
- 3.2. Spinal Deformities
- 3.3. Spinal Degeneration
- 3.4. Other Indications
Pedicle Screw Industry Segmentation By Geography
-
1. North America
- 1.1. United States
- 1.2. Canada
- 1.3. Mexico
-
2. Europe
- 2.1. Germany
- 2.2. United Kingdom
- 2.3. France
- 2.4. Italy
- 2.5. Spain
- 2.6. Rest of Europe
-
3. Asia Pacific
- 3.1. China
- 3.2. Japan
- 3.3. India
- 3.4. Australia
- 3.5. South Korea
- 3.6. Rest of Asia Pacific
-
4. Middle East and Africa
- 4.1. GCC
- 4.2. South Africa
- 4.3. Rest of Middle East and Africa
-
5. South America
- 5.1. Brazil
- 5.2. Argentina
- 5.3. Rest of South America
Pedicle Screw Industry REPORT HIGHLIGHTS
| Aspects | Details |
|---|---|
| Study Period | 2019-2033 |
| Base Year | 2024 |
| Estimated Year | 2025 |
| Forecast Period | 2025-2033 |
| Historical Period | 2019-2024 |
| Growth Rate | CAGR of 6.50% from 2019-2033 |
| Segmentation |
|
Table of Contents
- 1. Introduction
- 1.1. Research Scope
- 1.2. Market Segmentation
- 1.3. Research Methodology
- 1.4. Definitions and Assumptions
- 2. Executive Summary
- 2.1. Introduction
- 3. Market Dynamics
- 3.1. Introduction
- 3.2. Market Drivers
- 3.2.1. Growing Prevalence of Spinal Cord Injuries and Orthopedic Disorders; Technological Advancements in the Minimally Invasive Surgery
- 3.3. Market Restrains
- 3.3.1. Lack of Skilled Healthcare Professionals; Expensive Treatments and Lack of Proper Reimbursement Policies
- 3.4. Market Trends
- 3.4.1. Minimally Invasive Surgery by Surgery Type is Expected to Hold Significant Share in the Market Over the Forecast Period
- 4. Market Factor Analysis
- 4.1. Porters Five Forces
- 4.2. Supply/Value Chain
- 4.3. PESTEL analysis
- 4.4. Market Entropy
- 4.5. Patent/Trademark Analysis
- 5. Global Pedicle Screw Industry Analysis, Insights and Forecast, 2019-2031
- 5.1. Market Analysis, Insights and Forecast - by Surgery Type
- 5.1.1. Open Surgery
- 5.1.2. Minimally Invasive Surgery
- 5.2. Market Analysis, Insights and Forecast - by Product
- 5.2.1. Monoaxial Pedicle Screw
- 5.2.2. Polyaxial Pedicle Screw
- 5.2.3. Other Products
- 5.3. Market Analysis, Insights and Forecast - by Indication
- 5.3.1. Spinal Trauma Injuries
- 5.3.2. Spinal Deformities
- 5.3.3. Spinal Degeneration
- 5.3.4. Other Indications
- 5.4. Market Analysis, Insights and Forecast - by Region
- 5.4.1. North America
- 5.4.2. Europe
- 5.4.3. Asia Pacific
- 5.4.4. Middle East and Africa
- 5.4.5. South America
- 5.1. Market Analysis, Insights and Forecast - by Surgery Type
- 6. North America Pedicle Screw Industry Analysis, Insights and Forecast, 2019-2031
- 6.1. Market Analysis, Insights and Forecast - by Surgery Type
- 6.1.1. Open Surgery
- 6.1.2. Minimally Invasive Surgery
- 6.2. Market Analysis, Insights and Forecast - by Product
- 6.2.1. Monoaxial Pedicle Screw
- 6.2.2. Polyaxial Pedicle Screw
- 6.2.3. Other Products
- 6.3. Market Analysis, Insights and Forecast - by Indication
- 6.3.1. Spinal Trauma Injuries
- 6.3.2. Spinal Deformities
- 6.3.3. Spinal Degeneration
- 6.3.4. Other Indications
- 6.1. Market Analysis, Insights and Forecast - by Surgery Type
- 7. Europe Pedicle Screw Industry Analysis, Insights and Forecast, 2019-2031
- 7.1. Market Analysis, Insights and Forecast - by Surgery Type
- 7.1.1. Open Surgery
- 7.1.2. Minimally Invasive Surgery
- 7.2. Market Analysis, Insights and Forecast - by Product
- 7.2.1. Monoaxial Pedicle Screw
- 7.2.2. Polyaxial Pedicle Screw
- 7.2.3. Other Products
- 7.3. Market Analysis, Insights and Forecast - by Indication
- 7.3.1. Spinal Trauma Injuries
- 7.3.2. Spinal Deformities
- 7.3.3. Spinal Degeneration
- 7.3.4. Other Indications
- 7.1. Market Analysis, Insights and Forecast - by Surgery Type
- 8. Asia Pacific Pedicle Screw Industry Analysis, Insights and Forecast, 2019-2031
- 8.1. Market Analysis, Insights and Forecast - by Surgery Type
- 8.1.1. Open Surgery
- 8.1.2. Minimally Invasive Surgery
- 8.2. Market Analysis, Insights and Forecast - by Product
- 8.2.1. Monoaxial Pedicle Screw
- 8.2.2. Polyaxial Pedicle Screw
- 8.2.3. Other Products
- 8.3. Market Analysis, Insights and Forecast - by Indication
- 8.3.1. Spinal Trauma Injuries
- 8.3.2. Spinal Deformities
- 8.3.3. Spinal Degeneration
- 8.3.4. Other Indications
- 8.1. Market Analysis, Insights and Forecast - by Surgery Type
- 9. Middle East and Africa Pedicle Screw Industry Analysis, Insights and Forecast, 2019-2031
- 9.1. Market Analysis, Insights and Forecast - by Surgery Type
- 9.1.1. Open Surgery
- 9.1.2. Minimally Invasive Surgery
- 9.2. Market Analysis, Insights and Forecast - by Product
- 9.2.1. Monoaxial Pedicle Screw
- 9.2.2. Polyaxial Pedicle Screw
- 9.2.3. Other Products
- 9.3. Market Analysis, Insights and Forecast - by Indication
- 9.3.1. Spinal Trauma Injuries
- 9.3.2. Spinal Deformities
- 9.3.3. Spinal Degeneration
- 9.3.4. Other Indications
- 9.1. Market Analysis, Insights and Forecast - by Surgery Type
- 10. South America Pedicle Screw Industry Analysis, Insights and Forecast, 2019-2031
- 10.1. Market Analysis, Insights and Forecast - by Surgery Type
- 10.1.1. Open Surgery
- 10.1.2. Minimally Invasive Surgery
- 10.2. Market Analysis, Insights and Forecast - by Product
- 10.2.1. Monoaxial Pedicle Screw
- 10.2.2. Polyaxial Pedicle Screw
- 10.2.3. Other Products
- 10.3. Market Analysis, Insights and Forecast - by Indication
- 10.3.1. Spinal Trauma Injuries
- 10.3.2. Spinal Deformities
- 10.3.3. Spinal Degeneration
- 10.3.4. Other Indications
- 10.1. Market Analysis, Insights and Forecast - by Surgery Type
- 11. North America Pedicle Screw Industry Analysis, Insights and Forecast, 2019-2031
- 11.1. Market Analysis, Insights and Forecast - By Country/Sub-region
- 11.1.1 United States
- 11.1.2 Canada
- 11.1.3 Mexico
- 12. Europe Pedicle Screw Industry Analysis, Insights and Forecast, 2019-2031
- 12.1. Market Analysis, Insights and Forecast - By Country/Sub-region
- 12.1.1 Germany
- 12.1.2 United Kingdom
- 12.1.3 France
- 12.1.4 Italy
- 12.1.5 Spain
- 12.1.6 Rest of Europe
- 13. Asia Pacific Pedicle Screw Industry Analysis, Insights and Forecast, 2019-2031
- 13.1. Market Analysis, Insights and Forecast - By Country/Sub-region
- 13.1.1 China
- 13.1.2 Japan
- 13.1.3 India
- 13.1.4 Australia
- 13.1.5 South Korea
- 13.1.6 Rest of Asia Pacific
- 14. Middle East and Africa Pedicle Screw Industry Analysis, Insights and Forecast, 2019-2031
- 14.1. Market Analysis, Insights and Forecast - By Country/Sub-region
- 14.1.1 GCC
- 14.1.2 South Africa
- 14.1.3 Rest of Middle East and Africa
- 15. South America Pedicle Screw Industry Analysis, Insights and Forecast, 2019-2031
- 15.1. Market Analysis, Insights and Forecast - By Country/Sub-region
- 15.1.1 Brazil
- 15.1.2 Argentina
- 15.1.3 Rest of South America
- 16. Competitive Analysis
- 16.1. Global Market Share Analysis 2024
- 16.2. Company Profiles
- 16.2.1 Auxein Medical Pvt Ltd
- 16.2.1.1. Overview
- 16.2.1.2. Products
- 16.2.1.3. SWOT Analysis
- 16.2.1.4. Recent Developments
- 16.2.1.5. Financials (Based on Availability)
- 16.2.2 LDR Holding Corporation
- 16.2.2.1. Overview
- 16.2.2.2. Products
- 16.2.2.3. SWOT Analysis
- 16.2.2.4. Recent Developments
- 16.2.2.5. Financials (Based on Availability)
- 16.2.3 SeaSpine
- 16.2.3.1. Overview
- 16.2.3.2. Products
- 16.2.3.3. SWOT Analysis
- 16.2.3.4. Recent Developments
- 16.2.3.5. Financials (Based on Availability)
- 16.2.4 CTL Amedica Corporation
- 16.2.4.1. Overview
- 16.2.4.2. Products
- 16.2.4.3. SWOT Analysis
- 16.2.4.4. Recent Developments
- 16.2.4.5. Financials (Based on Availability)
- 16.2.5 Globus Medical Inc
- 16.2.5.1. Overview
- 16.2.5.2. Products
- 16.2.5.3. SWOT Analysis
- 16.2.5.4. Recent Developments
- 16.2.5.5. Financials (Based on Availability)
- 16.2.6 Medtronic PLC
- 16.2.6.1. Overview
- 16.2.6.2. Products
- 16.2.6.3. SWOT Analysis
- 16.2.6.4. Recent Developments
- 16.2.6.5. Financials (Based on Availability)
- 16.2.7 Johnson and Johnson
- 16.2.7.1. Overview
- 16.2.7.2. Products
- 16.2.7.3. SWOT Analysis
- 16.2.7.4. Recent Developments
- 16.2.7.5. Financials (Based on Availability)
- 16.2.8 Alphatec Holding Inc
- 16.2.8.1. Overview
- 16.2.8.2. Products
- 16.2.8.3. SWOT Analysis
- 16.2.8.4. Recent Developments
- 16.2.8.5. Financials (Based on Availability)
- 16.2.9 Stryker Corporation
- 16.2.9.1. Overview
- 16.2.9.2. Products
- 16.2.9.3. SWOT Analysis
- 16.2.9.4. Recent Developments
- 16.2.9.5. Financials (Based on Availability)
- 16.2.10 Zimmer Biomet
- 16.2.10.1. Overview
- 16.2.10.2. Products
- 16.2.10.3. SWOT Analysis
- 16.2.10.4. Recent Developments
- 16.2.10.5. Financials (Based on Availability)
- 16.2.11 B Braun SE
- 16.2.11.1. Overview
- 16.2.11.2. Products
- 16.2.11.3. SWOT Analysis
- 16.2.11.4. Recent Developments
- 16.2.11.5. Financials (Based on Availability)
- 16.2.1 Auxein Medical Pvt Ltd
List of Figures
- Figure 1: Global Pedicle Screw Industry Revenue Breakdown (Million, %) by Region 2024 & 2032
- Figure 2: Global Pedicle Screw Industry Volume Breakdown (K Unit, %) by Region 2024 & 2032
- Figure 3: North America Pedicle Screw Industry Revenue (Million), by Country 2024 & 2032
- Figure 4: North America Pedicle Screw Industry Volume (K Unit), by Country 2024 & 2032
- Figure 5: North America Pedicle Screw Industry Revenue Share (%), by Country 2024 & 2032
- Figure 6: North America Pedicle Screw Industry Volume Share (%), by Country 2024 & 2032
- Figure 7: Europe Pedicle Screw Industry Revenue (Million), by Country 2024 & 2032
- Figure 8: Europe Pedicle Screw Industry Volume (K Unit), by Country 2024 & 2032
- Figure 9: Europe Pedicle Screw Industry Revenue Share (%), by Country 2024 & 2032
- Figure 10: Europe Pedicle Screw Industry Volume Share (%), by Country 2024 & 2032
- Figure 11: Asia Pacific Pedicle Screw Industry Revenue (Million), by Country 2024 & 2032
- Figure 12: Asia Pacific Pedicle Screw Industry Volume (K Unit), by Country 2024 & 2032
- Figure 13: Asia Pacific Pedicle Screw Industry Revenue Share (%), by Country 2024 & 2032
- Figure 14: Asia Pacific Pedicle Screw Industry Volume Share (%), by Country 2024 & 2032
- Figure 15: Middle East and Africa Pedicle Screw Industry Revenue (Million), by Country 2024 & 2032
- Figure 16: Middle East and Africa Pedicle Screw Industry Volume (K Unit), by Country 2024 & 2032
- Figure 17: Middle East and Africa Pedicle Screw Industry Revenue Share (%), by Country 2024 & 2032
- Figure 18: Middle East and Africa Pedicle Screw Industry Volume Share (%), by Country 2024 & 2032
- Figure 19: South America Pedicle Screw Industry Revenue (Million), by Country 2024 & 2032
- Figure 20: South America Pedicle Screw Industry Volume (K Unit), by Country 2024 & 2032
- Figure 21: South America Pedicle Screw Industry Revenue Share (%), by Country 2024 & 2032
- Figure 22: South America Pedicle Screw Industry Volume Share (%), by Country 2024 & 2032
- Figure 23: North America Pedicle Screw Industry Revenue (Million), by Surgery Type 2024 & 2032
- Figure 24: North America Pedicle Screw Industry Volume (K Unit), by Surgery Type 2024 & 2032
- Figure 25: North America Pedicle Screw Industry Revenue Share (%), by Surgery Type 2024 & 2032
- Figure 26: North America Pedicle Screw Industry Volume Share (%), by Surgery Type 2024 & 2032
- Figure 27: North America Pedicle Screw Industry Revenue (Million), by Product 2024 & 2032
- Figure 28: North America Pedicle Screw Industry Volume (K Unit), by Product 2024 & 2032
- Figure 29: North America Pedicle Screw Industry Revenue Share (%), by Product 2024 & 2032
- Figure 30: North America Pedicle Screw Industry Volume Share (%), by Product 2024 & 2032
- Figure 31: North America Pedicle Screw Industry Revenue (Million), by Indication 2024 & 2032
- Figure 32: North America Pedicle Screw Industry Volume (K Unit), by Indication 2024 & 2032
- Figure 33: North America Pedicle Screw Industry Revenue Share (%), by Indication 2024 & 2032
- Figure 34: North America Pedicle Screw Industry Volume Share (%), by Indication 2024 & 2032
- Figure 35: North America Pedicle Screw Industry Revenue (Million), by Country 2024 & 2032
- Figure 36: North America Pedicle Screw Industry Volume (K Unit), by Country 2024 & 2032
- Figure 37: North America Pedicle Screw Industry Revenue Share (%), by Country 2024 & 2032
- Figure 38: North America Pedicle Screw Industry Volume Share (%), by Country 2024 & 2032
- Figure 39: Europe Pedicle Screw Industry Revenue (Million), by Surgery Type 2024 & 2032
- Figure 40: Europe Pedicle Screw Industry Volume (K Unit), by Surgery Type 2024 & 2032
- Figure 41: Europe Pedicle Screw Industry Revenue Share (%), by Surgery Type 2024 & 2032
- Figure 42: Europe Pedicle Screw Industry Volume Share (%), by Surgery Type 2024 & 2032
- Figure 43: Europe Pedicle Screw Industry Revenue (Million), by Product 2024 & 2032
- Figure 44: Europe Pedicle Screw Industry Volume (K Unit), by Product 2024 & 2032
- Figure 45: Europe Pedicle Screw Industry Revenue Share (%), by Product 2024 & 2032
- Figure 46: Europe Pedicle Screw Industry Volume Share (%), by Product 2024 & 2032
- Figure 47: Europe Pedicle Screw Industry Revenue (Million), by Indication 2024 & 2032
- Figure 48: Europe Pedicle Screw Industry Volume (K Unit), by Indication 2024 & 2032
- Figure 49: Europe Pedicle Screw Industry Revenue Share (%), by Indication 2024 & 2032
- Figure 50: Europe Pedicle Screw Industry Volume Share (%), by Indication 2024 & 2032
- Figure 51: Europe Pedicle Screw Industry Revenue (Million), by Country 2024 & 2032
- Figure 52: Europe Pedicle Screw Industry Volume (K Unit), by Country 2024 & 2032
- Figure 53: Europe Pedicle Screw Industry Revenue Share (%), by Country 2024 & 2032
- Figure 54: Europe Pedicle Screw Industry Volume Share (%), by Country 2024 & 2032
- Figure 55: Asia Pacific Pedicle Screw Industry Revenue (Million), by Surgery Type 2024 & 2032
- Figure 56: Asia Pacific Pedicle Screw Industry Volume (K Unit), by Surgery Type 2024 & 2032
- Figure 57: Asia Pacific Pedicle Screw Industry Revenue Share (%), by Surgery Type 2024 & 2032
- Figure 58: Asia Pacific Pedicle Screw Industry Volume Share (%), by Surgery Type 2024 & 2032
- Figure 59: Asia Pacific Pedicle Screw Industry Revenue (Million), by Product 2024 & 2032
- Figure 60: Asia Pacific Pedicle Screw Industry Volume (K Unit), by Product 2024 & 2032
- Figure 61: Asia Pacific Pedicle Screw Industry Revenue Share (%), by Product 2024 & 2032
- Figure 62: Asia Pacific Pedicle Screw Industry Volume Share (%), by Product 2024 & 2032
- Figure 63: Asia Pacific Pedicle Screw Industry Revenue (Million), by Indication 2024 & 2032
- Figure 64: Asia Pacific Pedicle Screw Industry Volume (K Unit), by Indication 2024 & 2032
- Figure 65: Asia Pacific Pedicle Screw Industry Revenue Share (%), by Indication 2024 & 2032
- Figure 66: Asia Pacific Pedicle Screw Industry Volume Share (%), by Indication 2024 & 2032
- Figure 67: Asia Pacific Pedicle Screw Industry Revenue (Million), by Country 2024 & 2032
- Figure 68: Asia Pacific Pedicle Screw Industry Volume (K Unit), by Country 2024 & 2032
- Figure 69: Asia Pacific Pedicle Screw Industry Revenue Share (%), by Country 2024 & 2032
- Figure 70: Asia Pacific Pedicle Screw Industry Volume Share (%), by Country 2024 & 2032
- Figure 71: Middle East and Africa Pedicle Screw Industry Revenue (Million), by Surgery Type 2024 & 2032
- Figure 72: Middle East and Africa Pedicle Screw Industry Volume (K Unit), by Surgery Type 2024 & 2032
- Figure 73: Middle East and Africa Pedicle Screw Industry Revenue Share (%), by Surgery Type 2024 & 2032
- Figure 74: Middle East and Africa Pedicle Screw Industry Volume Share (%), by Surgery Type 2024 & 2032
- Figure 75: Middle East and Africa Pedicle Screw Industry Revenue (Million), by Product 2024 & 2032
- Figure 76: Middle East and Africa Pedicle Screw Industry Volume (K Unit), by Product 2024 & 2032
- Figure 77: Middle East and Africa Pedicle Screw Industry Revenue Share (%), by Product 2024 & 2032
- Figure 78: Middle East and Africa Pedicle Screw Industry Volume Share (%), by Product 2024 & 2032
- Figure 79: Middle East and Africa Pedicle Screw Industry Revenue (Million), by Indication 2024 & 2032
- Figure 80: Middle East and Africa Pedicle Screw Industry Volume (K Unit), by Indication 2024 & 2032
- Figure 81: Middle East and Africa Pedicle Screw Industry Revenue Share (%), by Indication 2024 & 2032
- Figure 82: Middle East and Africa Pedicle Screw Industry Volume Share (%), by Indication 2024 & 2032
- Figure 83: Middle East and Africa Pedicle Screw Industry Revenue (Million), by Country 2024 & 2032
- Figure 84: Middle East and Africa Pedicle Screw Industry Volume (K Unit), by Country 2024 & 2032
- Figure 85: Middle East and Africa Pedicle Screw Industry Revenue Share (%), by Country 2024 & 2032
- Figure 86: Middle East and Africa Pedicle Screw Industry Volume Share (%), by Country 2024 & 2032
- Figure 87: South America Pedicle Screw Industry Revenue (Million), by Surgery Type 2024 & 2032
- Figure 88: South America Pedicle Screw Industry Volume (K Unit), by Surgery Type 2024 & 2032
- Figure 89: South America Pedicle Screw Industry Revenue Share (%), by Surgery Type 2024 & 2032
- Figure 90: South America Pedicle Screw Industry Volume Share (%), by Surgery Type 2024 & 2032
- Figure 91: South America Pedicle Screw Industry Revenue (Million), by Product 2024 & 2032
- Figure 92: South America Pedicle Screw Industry Volume (K Unit), by Product 2024 & 2032
- Figure 93: South America Pedicle Screw Industry Revenue Share (%), by Product 2024 & 2032
- Figure 94: South America Pedicle Screw Industry Volume Share (%), by Product 2024 & 2032
- Figure 95: South America Pedicle Screw Industry Revenue (Million), by Indication 2024 & 2032
- Figure 96: South America Pedicle Screw Industry Volume (K Unit), by Indication 2024 & 2032
- Figure 97: South America Pedicle Screw Industry Revenue Share (%), by Indication 2024 & 2032
- Figure 98: South America Pedicle Screw Industry Volume Share (%), by Indication 2024 & 2032
- Figure 99: South America Pedicle Screw Industry Revenue (Million), by Country 2024 & 2032
- Figure 100: South America Pedicle Screw Industry Volume (K Unit), by Country 2024 & 2032
- Figure 101: South America Pedicle Screw Industry Revenue Share (%), by Country 2024 & 2032
- Figure 102: South America Pedicle Screw Industry Volume Share (%), by Country 2024 & 2032
List of Tables
- Table 1: Global Pedicle Screw Industry Revenue Million Forecast, by Region 2019 & 2032
- Table 2: Global Pedicle Screw Industry Volume K Unit Forecast, by Region 2019 & 2032
- Table 3: Global Pedicle Screw Industry Revenue Million Forecast, by Surgery Type 2019 & 2032
- Table 4: Global Pedicle Screw Industry Volume K Unit Forecast, by Surgery Type 2019 & 2032
- Table 5: Global Pedicle Screw Industry Revenue Million Forecast, by Product 2019 & 2032
- Table 6: Global Pedicle Screw Industry Volume K Unit Forecast, by Product 2019 & 2032
- Table 7: Global Pedicle Screw Industry Revenue Million Forecast, by Indication 2019 & 2032
- Table 8: Global Pedicle Screw Industry Volume K Unit Forecast, by Indication 2019 & 2032
- Table 9: Global Pedicle Screw Industry Revenue Million Forecast, by Region 2019 & 2032
- Table 10: Global Pedicle Screw Industry Volume K Unit Forecast, by Region 2019 & 2032
- Table 11: Global Pedicle Screw Industry Revenue Million Forecast, by Country 2019 & 2032
- Table 12: Global Pedicle Screw Industry Volume K Unit Forecast, by Country 2019 & 2032
- Table 13: United States Pedicle Screw Industry Revenue (Million) Forecast, by Application 2019 & 2032
- Table 14: United States Pedicle Screw Industry Volume (K Unit) Forecast, by Application 2019 & 2032
- Table 15: Canada Pedicle Screw Industry Revenue (Million) Forecast, by Application 2019 & 2032
- Table 16: Canada Pedicle Screw Industry Volume (K Unit) Forecast, by Application 2019 & 2032
- Table 17: Mexico Pedicle Screw Industry Revenue (Million) Forecast, by Application 2019 & 2032
- Table 18: Mexico Pedicle Screw Industry Volume (K Unit) Forecast, by Application 2019 & 2032
- Table 19: Global Pedicle Screw Industry Revenue Million Forecast, by Country 2019 & 2032
- Table 20: Global Pedicle Screw Industry Volume K Unit Forecast, by Country 2019 & 2032
- Table 21: Germany Pedicle Screw Industry Revenue (Million) Forecast, by Application 2019 & 2032
- Table 22: Germany Pedicle Screw Industry Volume (K Unit) Forecast, by Application 2019 & 2032
- Table 23: United Kingdom Pedicle Screw Industry Revenue (Million) Forecast, by Application 2019 & 2032
- Table 24: United Kingdom Pedicle Screw Industry Volume (K Unit) Forecast, by Application 2019 & 2032
- Table 25: France Pedicle Screw Industry Revenue (Million) Forecast, by Application 2019 & 2032
- Table 26: France Pedicle Screw Industry Volume (K Unit) Forecast, by Application 2019 & 2032
- Table 27: Italy Pedicle Screw Industry Revenue (Million) Forecast, by Application 2019 & 2032
- Table 28: Italy Pedicle Screw Industry Volume (K Unit) Forecast, by Application 2019 & 2032
- Table 29: Spain Pedicle Screw Industry Revenue (Million) Forecast, by Application 2019 & 2032
- Table 30: Spain Pedicle Screw Industry Volume (K Unit) Forecast, by Application 2019 & 2032
- Table 31: Rest of Europe Pedicle Screw Industry Revenue (Million) Forecast, by Application 2019 & 2032
- Table 32: Rest of Europe Pedicle Screw Industry Volume (K Unit) Forecast, by Application 2019 & 2032
- Table 33: Global Pedicle Screw Industry Revenue Million Forecast, by Country 2019 & 2032
- Table 34: Global Pedicle Screw Industry Volume K Unit Forecast, by Country 2019 & 2032
- Table 35: China Pedicle Screw Industry Revenue (Million) Forecast, by Application 2019 & 2032
- Table 36: China Pedicle Screw Industry Volume (K Unit) Forecast, by Application 2019 & 2032
- Table 37: Japan Pedicle Screw Industry Revenue (Million) Forecast, by Application 2019 & 2032
- Table 38: Japan Pedicle Screw Industry Volume (K Unit) Forecast, by Application 2019 & 2032
- Table 39: India Pedicle Screw Industry Revenue (Million) Forecast, by Application 2019 & 2032
- Table 40: India Pedicle Screw Industry Volume (K Unit) Forecast, by Application 2019 & 2032
- Table 41: Australia Pedicle Screw Industry Revenue (Million) Forecast, by Application 2019 & 2032
- Table 42: Australia Pedicle Screw Industry Volume (K Unit) Forecast, by Application 2019 & 2032
- Table 43: South Korea Pedicle Screw Industry Revenue (Million) Forecast, by Application 2019 & 2032
- Table 44: South Korea Pedicle Screw Industry Volume (K Unit) Forecast, by Application 2019 & 2032
- Table 45: Rest of Asia Pacific Pedicle Screw Industry Revenue (Million) Forecast, by Application 2019 & 2032
- Table 46: Rest of Asia Pacific Pedicle Screw Industry Volume (K Unit) Forecast, by Application 2019 & 2032
- Table 47: Global Pedicle Screw Industry Revenue Million Forecast, by Country 2019 & 2032
- Table 48: Global Pedicle Screw Industry Volume K Unit Forecast, by Country 2019 & 2032
- Table 49: GCC Pedicle Screw Industry Revenue (Million) Forecast, by Application 2019 & 2032
- Table 50: GCC Pedicle Screw Industry Volume (K Unit) Forecast, by Application 2019 & 2032
- Table 51: South Africa Pedicle Screw Industry Revenue (Million) Forecast, by Application 2019 & 2032
- Table 52: South Africa Pedicle Screw Industry Volume (K Unit) Forecast, by Application 2019 & 2032
- Table 53: Rest of Middle East and Africa Pedicle Screw Industry Revenue (Million) Forecast, by Application 2019 & 2032
- Table 54: Rest of Middle East and Africa Pedicle Screw Industry Volume (K Unit) Forecast, by Application 2019 & 2032
- Table 55: Global Pedicle Screw Industry Revenue Million Forecast, by Country 2019 & 2032
- Table 56: Global Pedicle Screw Industry Volume K Unit Forecast, by Country 2019 & 2032
- Table 57: Brazil Pedicle Screw Industry Revenue (Million) Forecast, by Application 2019 & 2032
- Table 58: Brazil Pedicle Screw Industry Volume (K Unit) Forecast, by Application 2019 & 2032
- Table 59: Argentina Pedicle Screw Industry Revenue (Million) Forecast, by Application 2019 & 2032
- Table 60: Argentina Pedicle Screw Industry Volume (K Unit) Forecast, by Application 2019 & 2032
- Table 61: Rest of South America Pedicle Screw Industry Revenue (Million) Forecast, by Application 2019 & 2032
- Table 62: Rest of South America Pedicle Screw Industry Volume (K Unit) Forecast, by Application 2019 & 2032
- Table 63: Global Pedicle Screw Industry Revenue Million Forecast, by Surgery Type 2019 & 2032
- Table 64: Global Pedicle Screw Industry Volume K Unit Forecast, by Surgery Type 2019 & 2032
- Table 65: Global Pedicle Screw Industry Revenue Million Forecast, by Product 2019 & 2032
- Table 66: Global Pedicle Screw Industry Volume K Unit Forecast, by Product 2019 & 2032
- Table 67: Global Pedicle Screw Industry Revenue Million Forecast, by Indication 2019 & 2032
- Table 68: Global Pedicle Screw Industry Volume K Unit Forecast, by Indication 2019 & 2032
- Table 69: Global Pedicle Screw Industry Revenue Million Forecast, by Country 2019 & 2032
- Table 70: Global Pedicle Screw Industry Volume K Unit Forecast, by Country 2019 & 2032
- Table 71: United States Pedicle Screw Industry Revenue (Million) Forecast, by Application 2019 & 2032
- Table 72: United States Pedicle Screw Industry Volume (K Unit) Forecast, by Application 2019 & 2032
- Table 73: Canada Pedicle Screw Industry Revenue (Million) Forecast, by Application 2019 & 2032
- Table 74: Canada Pedicle Screw Industry Volume (K Unit) Forecast, by Application 2019 & 2032
- Table 75: Mexico Pedicle Screw Industry Revenue (Million) Forecast, by Application 2019 & 2032
- Table 76: Mexico Pedicle Screw Industry Volume (K Unit) Forecast, by Application 2019 & 2032
- Table 77: Global Pedicle Screw Industry Revenue Million Forecast, by Surgery Type 2019 & 2032
- Table 78: Global Pedicle Screw Industry Volume K Unit Forecast, by Surgery Type 2019 & 2032
- Table 79: Global Pedicle Screw Industry Revenue Million Forecast, by Product 2019 & 2032
- Table 80: Global Pedicle Screw Industry Volume K Unit Forecast, by Product 2019 & 2032
- Table 81: Global Pedicle Screw Industry Revenue Million Forecast, by Indication 2019 & 2032
- Table 82: Global Pedicle Screw Industry Volume K Unit Forecast, by Indication 2019 & 2032
- Table 83: Global Pedicle Screw Industry Revenue Million Forecast, by Country 2019 & 2032
- Table 84: Global Pedicle Screw Industry Volume K Unit Forecast, by Country 2019 & 2032
- Table 85: Germany Pedicle Screw Industry Revenue (Million) Forecast, by Application 2019 & 2032
- Table 86: Germany Pedicle Screw Industry Volume (K Unit) Forecast, by Application 2019 & 2032
- Table 87: United Kingdom Pedicle Screw Industry Revenue (Million) Forecast, by Application 2019 & 2032
- Table 88: United Kingdom Pedicle Screw Industry Volume (K Unit) Forecast, by Application 2019 & 2032
- Table 89: France Pedicle Screw Industry Revenue (Million) Forecast, by Application 2019 & 2032
- Table 90: France Pedicle Screw Industry Volume (K Unit) Forecast, by Application 2019 & 2032
- Table 91: Italy Pedicle Screw Industry Revenue (Million) Forecast, by Application 2019 & 2032
- Table 92: Italy Pedicle Screw Industry Volume (K Unit) Forecast, by Application 2019 & 2032
- Table 93: Spain Pedicle Screw Industry Revenue (Million) Forecast, by Application 2019 & 2032
- Table 94: Spain Pedicle Screw Industry Volume (K Unit) Forecast, by Application 2019 & 2032
- Table 95: Rest of Europe Pedicle Screw Industry Revenue (Million) Forecast, by Application 2019 & 2032
- Table 96: Rest of Europe Pedicle Screw Industry Volume (K Unit) Forecast, by Application 2019 & 2032
- Table 97: Global Pedicle Screw Industry Revenue Million Forecast, by Surgery Type 2019 & 2032
- Table 98: Global Pedicle Screw Industry Volume K Unit Forecast, by Surgery Type 2019 & 2032
- Table 99: Global Pedicle Screw Industry Revenue Million Forecast, by Product 2019 & 2032
- Table 100: Global Pedicle Screw Industry Volume K Unit Forecast, by Product 2019 & 2032
- Table 101: Global Pedicle Screw Industry Revenue Million Forecast, by Indication 2019 & 2032
- Table 102: Global Pedicle Screw Industry Volume K Unit Forecast, by Indication 2019 & 2032
- Table 103: Global Pedicle Screw Industry Revenue Million Forecast, by Country 2019 & 2032
- Table 104: Global Pedicle Screw Industry Volume K Unit Forecast, by Country 2019 & 2032
- Table 105: China Pedicle Screw Industry Revenue (Million) Forecast, by Application 2019 & 2032
- Table 106: China Pedicle Screw Industry Volume (K Unit) Forecast, by Application 2019 & 2032
- Table 107: Japan Pedicle Screw Industry Revenue (Million) Forecast, by Application 2019 & 2032
- Table 108: Japan Pedicle Screw Industry Volume (K Unit) Forecast, by Application 2019 & 2032
- Table 109: India Pedicle Screw Industry Revenue (Million) Forecast, by Application 2019 & 2032
- Table 110: India Pedicle Screw Industry Volume (K Unit) Forecast, by Application 2019 & 2032
- Table 111: Australia Pedicle Screw Industry Revenue (Million) Forecast, by Application 2019 & 2032
- Table 112: Australia Pedicle Screw Industry Volume (K Unit) Forecast, by Application 2019 & 2032
- Table 113: South Korea Pedicle Screw Industry Revenue (Million) Forecast, by Application 2019 & 2032
- Table 114: South Korea Pedicle Screw Industry Volume (K Unit) Forecast, by Application 2019 & 2032
- Table 115: Rest of Asia Pacific Pedicle Screw Industry Revenue (Million) Forecast, by Application 2019 & 2032
- Table 116: Rest of Asia Pacific Pedicle Screw Industry Volume (K Unit) Forecast, by Application 2019 & 2032
- Table 117: Global Pedicle Screw Industry Revenue Million Forecast, by Surgery Type 2019 & 2032
- Table 118: Global Pedicle Screw Industry Volume K Unit Forecast, by Surgery Type 2019 & 2032
- Table 119: Global Pedicle Screw Industry Revenue Million Forecast, by Product 2019 & 2032
- Table 120: Global Pedicle Screw Industry Volume K Unit Forecast, by Product 2019 & 2032
- Table 121: Global Pedicle Screw Industry Revenue Million Forecast, by Indication 2019 & 2032
- Table 122: Global Pedicle Screw Industry Volume K Unit Forecast, by Indication 2019 & 2032
- Table 123: Global Pedicle Screw Industry Revenue Million Forecast, by Country 2019 & 2032
- Table 124: Global Pedicle Screw Industry Volume K Unit Forecast, by Country 2019 & 2032
- Table 125: GCC Pedicle Screw Industry Revenue (Million) Forecast, by Application 2019 & 2032
- Table 126: GCC Pedicle Screw Industry Volume (K Unit) Forecast, by Application 2019 & 2032
- Table 127: South Africa Pedicle Screw Industry Revenue (Million) Forecast, by Application 2019 & 2032
- Table 128: South Africa Pedicle Screw Industry Volume (K Unit) Forecast, by Application 2019 & 2032
- Table 129: Rest of Middle East and Africa Pedicle Screw Industry Revenue (Million) Forecast, by Application 2019 & 2032
- Table 130: Rest of Middle East and Africa Pedicle Screw Industry Volume (K Unit) Forecast, by Application 2019 & 2032
- Table 131: Global Pedicle Screw Industry Revenue Million Forecast, by Surgery Type 2019 & 2032
- Table 132: Global Pedicle Screw Industry Volume K Unit Forecast, by Surgery Type 2019 & 2032
- Table 133: Global Pedicle Screw Industry Revenue Million Forecast, by Product 2019 & 2032
- Table 134: Global Pedicle Screw Industry Volume K Unit Forecast, by Product 2019 & 2032
- Table 135: Global Pedicle Screw Industry Revenue Million Forecast, by Indication 2019 & 2032
- Table 136: Global Pedicle Screw Industry Volume K Unit Forecast, by Indication 2019 & 2032
- Table 137: Global Pedicle Screw Industry Revenue Million Forecast, by Country 2019 & 2032
- Table 138: Global Pedicle Screw Industry Volume K Unit Forecast, by Country 2019 & 2032
- Table 139: Brazil Pedicle Screw Industry Revenue (Million) Forecast, by Application 2019 & 2032
- Table 140: Brazil Pedicle Screw Industry Volume (K Unit) Forecast, by Application 2019 & 2032
- Table 141: Argentina Pedicle Screw Industry Revenue (Million) Forecast, by Application 2019 & 2032
- Table 142: Argentina Pedicle Screw Industry Volume (K Unit) Forecast, by Application 2019 & 2032
- Table 143: Rest of South America Pedicle Screw Industry Revenue (Million) Forecast, by Application 2019 & 2032
- Table 144: Rest of South America Pedicle Screw Industry Volume (K Unit) Forecast, by Application 2019 & 2032
Frequently Asked Questions
1. What is the projected Compound Annual Growth Rate (CAGR) of the Pedicle Screw Industry?
The projected CAGR is approximately 6.50%.
2. Which companies are prominent players in the Pedicle Screw Industry?
Key companies in the market include Auxein Medical Pvt Ltd, LDR Holding Corporation, SeaSpine, CTL Amedica Corporation, Globus Medical Inc, Medtronic PLC, Johnson and Johnson, Alphatec Holding Inc, Stryker Corporation, Zimmer Biomet, B Braun SE.
3. What are the main segments of the Pedicle Screw Industry?
The market segments include Surgery Type, Product, Indication.
4. Can you provide details about the market size?
The market size is estimated to be USD XX Million as of 2022.
5. What are some drivers contributing to market growth?
Growing Prevalence of Spinal Cord Injuries and Orthopedic Disorders; Technological Advancements in the Minimally Invasive Surgery.
6. What are the notable trends driving market growth?
Minimally Invasive Surgery by Surgery Type is Expected to Hold Significant Share in the Market Over the Forecast Period.
7. Are there any restraints impacting market growth?
Lack of Skilled Healthcare Professionals; Expensive Treatments and Lack of Proper Reimbursement Policies.
8. Can you provide examples of recent developments in the market?
In March 2022, SurGenTec received clearance from the United States FDA for ION Screw, which is their proprietary stand-alone spine fixation implant.
9. What pricing options are available for accessing the report?
Pricing options include single-user, multi-user, and enterprise licenses priced at USD 4750, USD 5250, and USD 8750 respectively.
10. Is the market size provided in terms of value or volume?
The market size is provided in terms of value, measured in Million and volume, measured in K Unit.
11. Are there any specific market keywords associated with the report?
Yes, the market keyword associated with the report is "Pedicle Screw Industry," which aids in identifying and referencing the specific market segment covered.
12. How do I determine which pricing option suits my needs best?
The pricing options vary based on user requirements and access needs. Individual users may opt for single-user licenses, while businesses requiring broader access may choose multi-user or enterprise licenses for cost-effective access to the report.
13. Are there any additional resources or data provided in the Pedicle Screw Industry report?
While the report offers comprehensive insights, it's advisable to review the specific contents or supplementary materials provided to ascertain if additional resources or data are available.
14. How can I stay updated on further developments or reports in the Pedicle Screw Industry?
To stay informed about further developments, trends, and reports in the Pedicle Screw Industry, consider subscribing to industry newsletters, following relevant companies and organizations, or regularly checking reputable industry news sources and publications.
Methodology
Step 1 - Identification of Relevant Samples Size from Population Database


Step 2 - Approaches for Defining Global Market Size (Value, Volume* & Price*)

Note*: In applicable scenarios
Step 3 - Data Sources
Primary Research
- Web Analytics
- Survey Reports
- Research Institute
- Latest Research Reports
- Opinion Leaders
Secondary Research
- Annual Reports
- White Paper
- Latest Press Release
- Industry Association
- Paid Database
- Investor Presentations

Step 4 - Data Triangulation
Involves using different sources of information in order to increase the validity of a study
These sources are likely to be stakeholders in a program - participants, other researchers, program staff, other community members, and so on.
Then we put all data in single framework & apply various statistical tools to find out the dynamic on the market.
During the analysis stage, feedback from the stakeholder groups would be compared to determine areas of agreement as well as areas of divergence


