
Key Insights
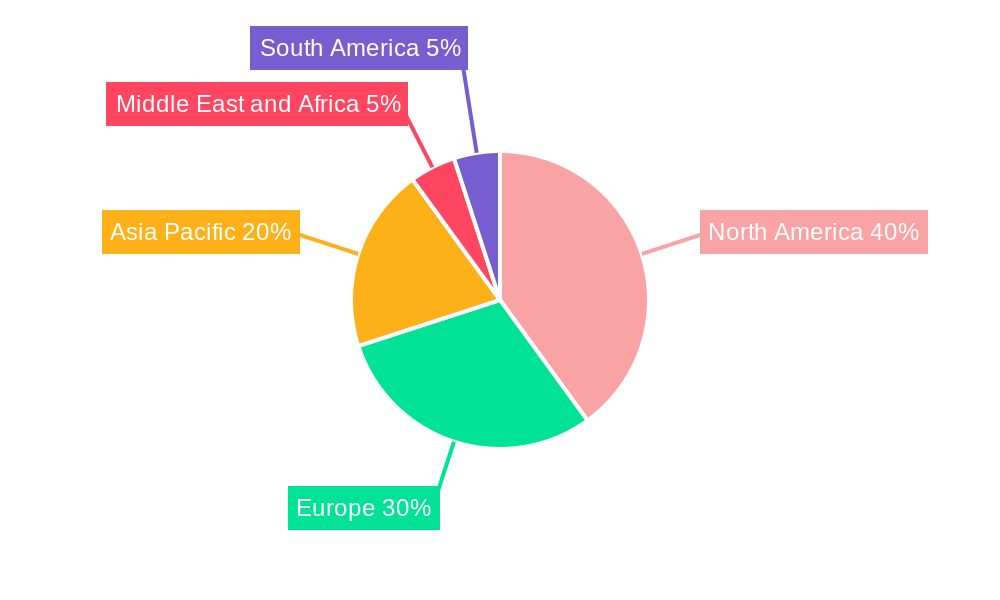
The pediatric drugs market, valued at $130.37 billion in 2025, is projected to experience robust growth, driven by several key factors. Increasing prevalence of chronic diseases like asthma, diabetes, and autoimmune disorders in children, coupled with rising healthcare expenditure and improved access to specialized pediatric care, are significant contributors to market expansion. Furthermore, advancements in drug development, leading to safer and more effective therapies targeted specifically at pediatric populations, are fueling market growth. The development of novel drug delivery systems, such as oral disintegrating tablets and transdermal patches, designed to enhance medication compliance in children, also presents a significant opportunity. The market is segmented by drug type (respiratory, autoimmune, gastrointestinal, cardiovascular, and others), route of administration (oral, topical, parenteral, and others), and geographic region. North America and Europe currently hold significant market shares, attributed to higher healthcare spending and advanced healthcare infrastructure. However, rapidly developing economies in Asia-Pacific and other regions are expected to exhibit considerable growth in the coming years, driven by increasing awareness of pediatric health and improved healthcare accessibility.
The competitive landscape is characterized by a mix of large multinational pharmaceutical companies and smaller specialized firms. Key players like Pfizer, Sanofi, and Johnson & Johnson are leveraging their established infrastructure and research capabilities to maintain a strong presence. However, smaller companies are making inroads by focusing on niche therapeutic areas and innovative drug delivery mechanisms. While regulatory hurdles and the stringent requirements for pediatric drug development pose challenges, the overall market outlook remains positive, indicating substantial growth opportunities for companies investing in research, development, and commercialization of innovative pediatric drugs over the forecast period (2025-2033). The market's future growth hinges on continued innovation, regulatory approvals, and a sustained focus on improving the health outcomes for children globally.
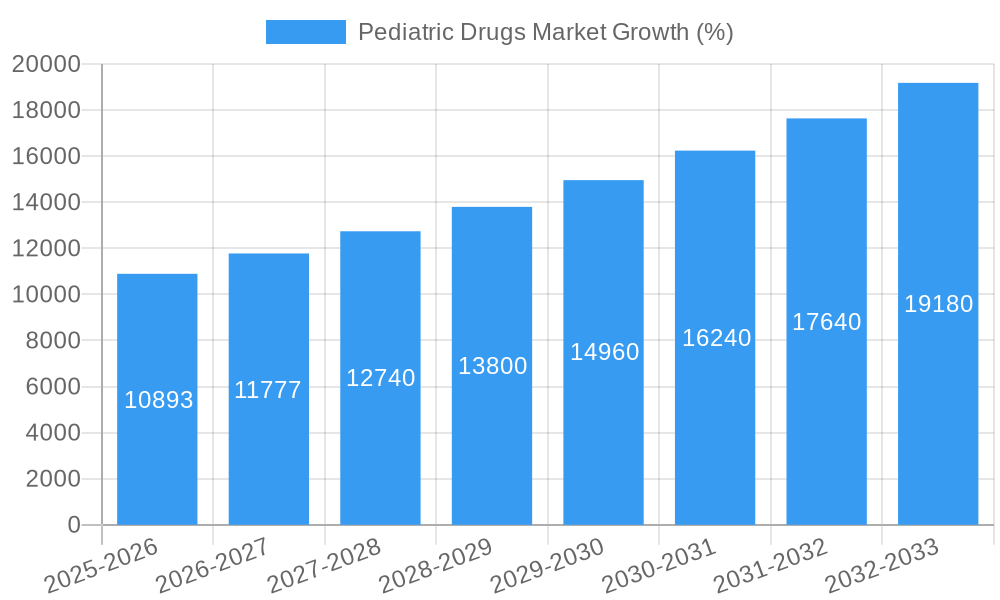
This detailed report provides a comprehensive analysis of the Pediatric Drugs Market, offering invaluable insights for industry stakeholders, investors, and researchers. Covering the period from 2019 to 2033, with a base year of 2025 and a forecast period from 2025 to 2033, this report offers a granular view of market dynamics, segmentation, and key players. The market is segmented by drug type and route of administration, providing a detailed understanding of growth opportunities across various therapeutic areas.
Pediatric Drugs Market Market Structure & Competitive Dynamics
The pediatric drugs market exhibits a moderately consolidated structure, with several multinational pharmaceutical companies holding significant market share. Market concentration is influenced by factors such as R&D investments, regulatory approvals, and successful product launches. The competitive landscape is characterized by intense innovation, with companies focusing on developing novel therapies targeting unmet medical needs in pediatric populations. Regulatory frameworks, including stringent safety and efficacy requirements, play a crucial role in shaping market dynamics. The availability of substitute treatments and evolving end-user preferences (pediatricians, parents) also impact market share. M&A activity has been moderate in recent years, with deal values ranging from xx Million to xx Million, primarily driven by companies seeking to expand their pediatric drug portfolios and enhance their market presence. Key players are leveraging strategic alliances and partnerships to accelerate drug development and market access. Market share distribution among the top 10 players is estimated at approximately xx%, reflecting the competitive intensity within the sector.
Pediatric Drugs Market Industry Trends & Insights
The pediatric drugs market is experiencing robust growth, driven by several factors. Increasing prevalence of chronic diseases in children, rising healthcare expenditure, and growing awareness regarding pediatric health are key growth stimulants. Technological advancements, such as targeted therapies and personalized medicine, are revolutionizing treatment approaches, leading to improved efficacy and reduced side effects. Consumer preferences are shifting towards safer and more effective drugs with minimal adverse effects. The market is also witnessing the emergence of biosimilars, contributing to increased competition and affordability. The CAGR for the forecast period (2025-2033) is projected to be xx%, while market penetration in key therapeutic areas is expected to reach xx% by 2033. Competitive dynamics are largely shaped by the continuous introduction of novel therapies and the ongoing efforts of pharmaceutical companies to secure regulatory approvals.
Dominant Markets & Segments in Pediatric Drugs Market
Dominant Regions & Countries: North America currently dominates the pediatric drugs market, primarily due to high healthcare expenditure, advanced healthcare infrastructure, and a robust regulatory environment. However, emerging markets in Asia-Pacific are expected to witness significant growth in the coming years due to factors such as rising disposable incomes, increasing healthcare awareness, and government initiatives aimed at improving healthcare infrastructure. Europe also represents a substantial market with significant growth potential.
Dominant Drug Types:
- Respiratory Disorder Drugs: This segment is currently the largest, driven by the high prevalence of asthma and other respiratory conditions in children. Key drivers include increasing air pollution, and better diagnosis techniques.
- Autoimmune Disorder Drugs: This segment is experiencing rapid growth, driven by the increasing incidence of autoimmune diseases in children and the availability of more effective therapies.
- Gastrointestinal Drugs: This segment exhibits steady growth, driven by the prevalence of gastrointestinal disorders in children and increasing demand for specialized treatments.
- Cardiovascular Drugs: This segment is growing moderately, driven by the increasing prevalence of congenital heart defects and other cardiovascular issues.
- Other Drug Types: This includes various therapeutic areas, such as oncology, neurology, and infectious diseases, which are exhibiting substantial growth potential.
Dominant Routes of Administration:
- Oral: This is the most dominant route of administration due to ease of use and patient compliance.
- Parenteral: This segment is growing due to the need for targeted drug delivery in severe cases.
- Topical: Topical medications are increasingly preferred for localized treatments.
- Other Routes of Administration: This includes inhalation and transdermal routes.
Pediatric Drugs Market Product Innovations
Recent years have witnessed significant advancements in pediatric drug development, driven by technological innovations and an increasing focus on personalized medicine. The development of novel drug delivery systems, targeted therapies, and biosimilars has expanded treatment options for various pediatric conditions. These advancements enhance therapeutic efficacy, minimize side effects, and improve patient outcomes, leading to improved market fit and strong competitive advantages.
Report Segmentation & Scope
This report segments the pediatric drugs market based on drug type (Respiratory Disorder Drugs, Autoimmune Disorder Drugs, Gastrointestinal Drugs, Cardiovascular Drugs, Other Drug Types) and route of administration (Oral, Topical, Parenteral, Other Routes of Administration). Each segment is analyzed in detail, offering insights into its growth projections, market size, and competitive landscape. Growth projections vary across segments, with faster growth expected in areas like autoimmune disorder drugs and targeted therapies due to the availability of newer and more effective drugs. The competitive dynamics within each segment are influenced by factors such as the number of players, the intensity of competition, and the availability of innovative products. Market sizes are projected to increase significantly across all segments over the forecast period.
Key Drivers of Pediatric Drugs Market Growth
Several factors drive the growth of the pediatric drugs market. Technological advancements, such as the development of targeted therapies and personalized medicine, are leading to more effective and safer treatments. The rising prevalence of chronic diseases in children fuels demand for effective pediatric medications. Favorable regulatory frameworks that encourage pediatric drug development also contribute to market growth. Furthermore, increasing healthcare expenditure and improved healthcare infrastructure in many regions are boosting market expansion. The rising awareness about pediatric health among parents and healthcare professionals further fuels this growth.
Challenges in the Pediatric Drugs Market Sector
The pediatric drugs market faces several challenges. Stringent regulatory requirements for pediatric drug approvals increase development time and costs. The complexities involved in pediatric drug development, including considerations for age-specific pharmacokinetics and pharmacodynamics, pose significant hurdles. Supply chain disruptions can impact drug availability and affordability. The intense competition among pharmaceutical companies necessitates continuous innovation and aggressive marketing strategies to capture market share. These challenges can collectively impact market growth and profitability.
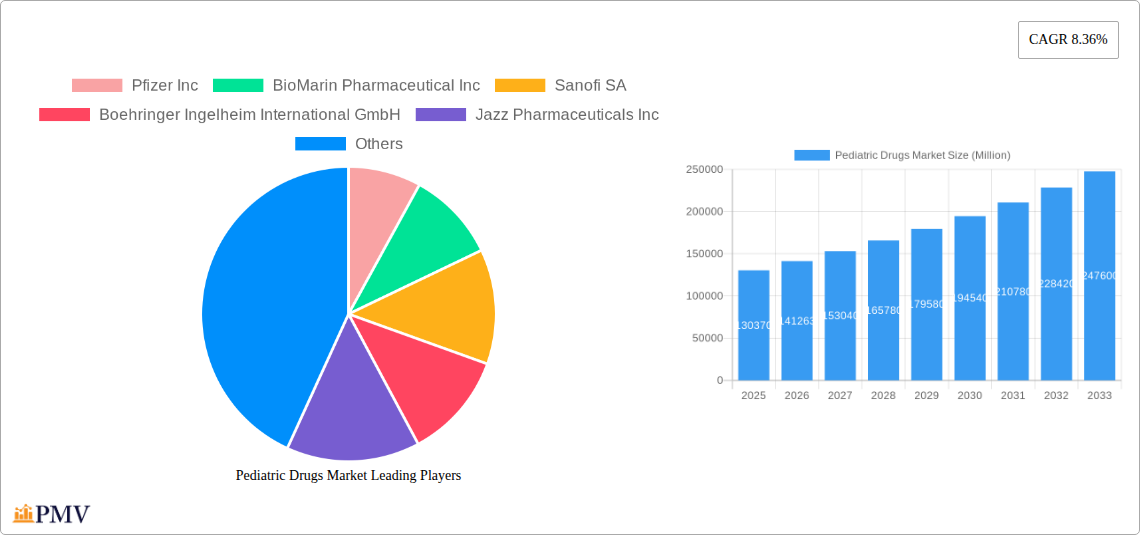
Leading Players in the Pediatric Drugs Market Market
- Pfizer Inc (Pfizer Inc)
- BioMarin Pharmaceutical Inc (BioMarin Pharmaceutical Inc)
- Sanofi SA (Sanofi SA)
- Boehringer Ingelheim International GmbH (Boehringer Ingelheim International GmbH)
- Jazz Pharmaceuticals Inc (Jazz Pharmaceuticals Inc)
- PTC Therapeutics Inc (PTC Therapeutics Inc)
- Glaxosmithkline PLC (Glaxosmithkline PLC)
- Horizon Therapeutics PLC (Horizon Therapeutics PLC)
- Sumitomo Dainippon Pharma Co Ltd (Sumitomo Dainippon Pharma Co Ltd)
- Novartis AG (Novartis AG)
- Johnson & Johnson (Johnson & Johnson)
- Gilead Sciences Inc (Gilead Sciences Inc)
Key Developments in Pediatric Drugs Market Sector
- December 2021: Novartis announced the US FDA's approval for Cosentyx (secukinumab) in treating active enthesitis-related arthritis (ERA) in children four years and older and active juvenile psoriatic arthritis (JPsA) in children two years and older. This significantly expands the treatment options for these conditions.
- October 2021: The US FDA approved Rethymic for treating pediatric patients with congenital athymia, a rare immune disorder. This approval marked a significant advancement in treating this previously challenging condition.
Strategic Pediatric Drugs Market Market Outlook
The pediatric drugs market presents substantial growth potential over the forecast period. Continued innovation in drug development, particularly in personalized medicine and targeted therapies, will drive market expansion. Growing awareness regarding pediatric health, along with increased healthcare expenditure, will further contribute to market growth. Strategic partnerships and collaborations between pharmaceutical companies and research institutions will accelerate drug development and enhance market penetration. Focusing on unmet medical needs and developing novel therapies for rare pediatric diseases presents significant opportunities for growth and market leadership.
Pediatric Drugs Market Segmentation
-
1. Drug Type
- 1.1. Respiratory Disorder Drugs
- 1.2. Autoimmune Disorder Drugs
- 1.3. Gastrointestinal Drugs
- 1.4. Cardiovascular Drugs
- 1.5. Other Drug Types
-
2. Route of Administration
- 2.1. Oral
- 2.2. Topical
- 2.3. Parenteral
- 2.4. Other Routes of Administration
Pediatric Drugs Market Segmentation By Geography
-
1. North America
- 1.1. United States
- 1.2. Canada
- 1.3. Mexico
-
2. Europe
- 2.1. Germany
- 2.2. United Kingdom
- 2.3. France
- 2.4. Italy
- 2.5. Spain
- 2.6. Rest of Europe
-
3. Asia Pacific
- 3.1. China
- 3.2. Japan
- 3.3. India
- 3.4. Australia
- 3.5. South Korea
- 3.6. Rest of Asia Pacific
-
4. Middle East and Africa
- 4.1. GCC
- 4.2. South Africa
- 4.3. Rest of Middle East and Africa
-
5. South America
- 5.1. Brazil
- 5.2. Argentina
- 5.3. Rest of South America
Pediatric Drugs Market REPORT HIGHLIGHTS
| Aspects | Details |
|---|---|
| Study Period | 2019-2033 |
| Base Year | 2024 |
| Estimated Year | 2025 |
| Forecast Period | 2025-2033 |
| Historical Period | 2019-2024 |
| Growth Rate | CAGR of 8.36% from 2019-2033 |
| Segmentation |
|
Table of Contents
- 1. Introduction
- 1.1. Research Scope
- 1.2. Market Segmentation
- 1.3. Research Methodology
- 1.4. Definitions and Assumptions
- 2. Executive Summary
- 2.1. Introduction
- 3. Market Dynamics
- 3.1. Introduction
- 3.2. Market Drivers
- 3.2.1 Increasing Burden of Pediatric Diseases such as Diabetes
- 3.2.2 Respiratory Disorders
- 3.2.3 and Rise in Affordability with Disposable Income; Increased R&D Activities and Awareness of Pediatric Medicine Among Public
- 3.3. Market Restrains
- 3.3.1. Small Size of Study Population and Ethical Issues in Pediatric Research; Risk of Severe Complications Associated with Medicines that may lead to Death
- 3.4. Market Trends
- 3.4.1. Respiratory Disorder Drugs Segment By Indication is Expected to Hold the Major Market Share in the Pediatric Drugs Market
- 4. Market Factor Analysis
- 4.1. Porters Five Forces
- 4.2. Supply/Value Chain
- 4.3. PESTEL analysis
- 4.4. Market Entropy
- 4.5. Patent/Trademark Analysis
- 5. Global Pediatric Drugs Market Analysis, Insights and Forecast, 2019-2031
- 5.1. Market Analysis, Insights and Forecast - by Drug Type
- 5.1.1. Respiratory Disorder Drugs
- 5.1.2. Autoimmune Disorder Drugs
- 5.1.3. Gastrointestinal Drugs
- 5.1.4. Cardiovascular Drugs
- 5.1.5. Other Drug Types
- 5.2. Market Analysis, Insights and Forecast - by Route of Administration
- 5.2.1. Oral
- 5.2.2. Topical
- 5.2.3. Parenteral
- 5.2.4. Other Routes of Administration
- 5.3. Market Analysis, Insights and Forecast - by Region
- 5.3.1. North America
- 5.3.2. Europe
- 5.3.3. Asia Pacific
- 5.3.4. Middle East and Africa
- 5.3.5. South America
- 5.1. Market Analysis, Insights and Forecast - by Drug Type
- 6. North America Pediatric Drugs Market Analysis, Insights and Forecast, 2019-2031
- 6.1. Market Analysis, Insights and Forecast - by Drug Type
- 6.1.1. Respiratory Disorder Drugs
- 6.1.2. Autoimmune Disorder Drugs
- 6.1.3. Gastrointestinal Drugs
- 6.1.4. Cardiovascular Drugs
- 6.1.5. Other Drug Types
- 6.2. Market Analysis, Insights and Forecast - by Route of Administration
- 6.2.1. Oral
- 6.2.2. Topical
- 6.2.3. Parenteral
- 6.2.4. Other Routes of Administration
- 6.1. Market Analysis, Insights and Forecast - by Drug Type
- 7. Europe Pediatric Drugs Market Analysis, Insights and Forecast, 2019-2031
- 7.1. Market Analysis, Insights and Forecast - by Drug Type
- 7.1.1. Respiratory Disorder Drugs
- 7.1.2. Autoimmune Disorder Drugs
- 7.1.3. Gastrointestinal Drugs
- 7.1.4. Cardiovascular Drugs
- 7.1.5. Other Drug Types
- 7.2. Market Analysis, Insights and Forecast - by Route of Administration
- 7.2.1. Oral
- 7.2.2. Topical
- 7.2.3. Parenteral
- 7.2.4. Other Routes of Administration
- 7.1. Market Analysis, Insights and Forecast - by Drug Type
- 8. Asia Pacific Pediatric Drugs Market Analysis, Insights and Forecast, 2019-2031
- 8.1. Market Analysis, Insights and Forecast - by Drug Type
- 8.1.1. Respiratory Disorder Drugs
- 8.1.2. Autoimmune Disorder Drugs
- 8.1.3. Gastrointestinal Drugs
- 8.1.4. Cardiovascular Drugs
- 8.1.5. Other Drug Types
- 8.2. Market Analysis, Insights and Forecast - by Route of Administration
- 8.2.1. Oral
- 8.2.2. Topical
- 8.2.3. Parenteral
- 8.2.4. Other Routes of Administration
- 8.1. Market Analysis, Insights and Forecast - by Drug Type
- 9. Middle East and Africa Pediatric Drugs Market Analysis, Insights and Forecast, 2019-2031
- 9.1. Market Analysis, Insights and Forecast - by Drug Type
- 9.1.1. Respiratory Disorder Drugs
- 9.1.2. Autoimmune Disorder Drugs
- 9.1.3. Gastrointestinal Drugs
- 9.1.4. Cardiovascular Drugs
- 9.1.5. Other Drug Types
- 9.2. Market Analysis, Insights and Forecast - by Route of Administration
- 9.2.1. Oral
- 9.2.2. Topical
- 9.2.3. Parenteral
- 9.2.4. Other Routes of Administration
- 9.1. Market Analysis, Insights and Forecast - by Drug Type
- 10. South America Pediatric Drugs Market Analysis, Insights and Forecast, 2019-2031
- 10.1. Market Analysis, Insights and Forecast - by Drug Type
- 10.1.1. Respiratory Disorder Drugs
- 10.1.2. Autoimmune Disorder Drugs
- 10.1.3. Gastrointestinal Drugs
- 10.1.4. Cardiovascular Drugs
- 10.1.5. Other Drug Types
- 10.2. Market Analysis, Insights and Forecast - by Route of Administration
- 10.2.1. Oral
- 10.2.2. Topical
- 10.2.3. Parenteral
- 10.2.4. Other Routes of Administration
- 10.1. Market Analysis, Insights and Forecast - by Drug Type
- 11. North America Pediatric Drugs Market Analysis, Insights and Forecast, 2019-2031
- 11.1. Market Analysis, Insights and Forecast - By Country/Sub-region
- 11.1.1 United States
- 11.1.2 Canada
- 11.1.3 Mexico
- 12. Europe Pediatric Drugs Market Analysis, Insights and Forecast, 2019-2031
- 12.1. Market Analysis, Insights and Forecast - By Country/Sub-region
- 12.1.1 Germany
- 12.1.2 United Kingdom
- 12.1.3 France
- 12.1.4 Italy
- 12.1.5 Spain
- 12.1.6 Rest of Europe
- 13. Asia Pacific Pediatric Drugs Market Analysis, Insights and Forecast, 2019-2031
- 13.1. Market Analysis, Insights and Forecast - By Country/Sub-region
- 13.1.1 China
- 13.1.2 Japan
- 13.1.3 India
- 13.1.4 Australia
- 13.1.5 South Korea
- 13.1.6 Rest of Asia Pacific
- 14. Middle East and Africa Pediatric Drugs Market Analysis, Insights and Forecast, 2019-2031
- 14.1. Market Analysis, Insights and Forecast - By Country/Sub-region
- 14.1.1 GCC
- 14.1.2 South Africa
- 14.1.3 Rest of Middle East and Africa
- 15. South America Pediatric Drugs Market Analysis, Insights and Forecast, 2019-2031
- 15.1. Market Analysis, Insights and Forecast - By Country/Sub-region
- 15.1.1 Brazil
- 15.1.2 Argentina
- 15.1.3 Rest of South America
- 16. Competitive Analysis
- 16.1. Global Market Share Analysis 2024
- 16.2. Company Profiles
- 16.2.1 Pfizer Inc
- 16.2.1.1. Overview
- 16.2.1.2. Products
- 16.2.1.3. SWOT Analysis
- 16.2.1.4. Recent Developments
- 16.2.1.5. Financials (Based on Availability)
- 16.2.2 BioMarin Pharmaceutical Inc
- 16.2.2.1. Overview
- 16.2.2.2. Products
- 16.2.2.3. SWOT Analysis
- 16.2.2.4. Recent Developments
- 16.2.2.5. Financials (Based on Availability)
- 16.2.3 Sanofi SA
- 16.2.3.1. Overview
- 16.2.3.2. Products
- 16.2.3.3. SWOT Analysis
- 16.2.3.4. Recent Developments
- 16.2.3.5. Financials (Based on Availability)
- 16.2.4 Boehringer Ingelheim International GmbH
- 16.2.4.1. Overview
- 16.2.4.2. Products
- 16.2.4.3. SWOT Analysis
- 16.2.4.4. Recent Developments
- 16.2.4.5. Financials (Based on Availability)
- 16.2.5 Jazz Pharmaceuticals Inc
- 16.2.5.1. Overview
- 16.2.5.2. Products
- 16.2.5.3. SWOT Analysis
- 16.2.5.4. Recent Developments
- 16.2.5.5. Financials (Based on Availability)
- 16.2.6 PTC Therapeutics Inc
- 16.2.6.1. Overview
- 16.2.6.2. Products
- 16.2.6.3. SWOT Analysis
- 16.2.6.4. Recent Developments
- 16.2.6.5. Financials (Based on Availability)
- 16.2.7 Glaxosmithkline PLC
- 16.2.7.1. Overview
- 16.2.7.2. Products
- 16.2.7.3. SWOT Analysis
- 16.2.7.4. Recent Developments
- 16.2.7.5. Financials (Based on Availability)
- 16.2.8 Horizon Therapeutics PLC
- 16.2.8.1. Overview
- 16.2.8.2. Products
- 16.2.8.3. SWOT Analysis
- 16.2.8.4. Recent Developments
- 16.2.8.5. Financials (Based on Availability)
- 16.2.9 Sumitomo Dainippon Pharma Co Ltd
- 16.2.9.1. Overview
- 16.2.9.2. Products
- 16.2.9.3. SWOT Analysis
- 16.2.9.4. Recent Developments
- 16.2.9.5. Financials (Based on Availability)
- 16.2.10 Novartis AG
- 16.2.10.1. Overview
- 16.2.10.2. Products
- 16.2.10.3. SWOT Analysis
- 16.2.10.4. Recent Developments
- 16.2.10.5. Financials (Based on Availability)
- 16.2.11 Johnson & Johnson
- 16.2.11.1. Overview
- 16.2.11.2. Products
- 16.2.11.3. SWOT Analysis
- 16.2.11.4. Recent Developments
- 16.2.11.5. Financials (Based on Availability)
- 16.2.12 Gilead Sciences Inc
- 16.2.12.1. Overview
- 16.2.12.2. Products
- 16.2.12.3. SWOT Analysis
- 16.2.12.4. Recent Developments
- 16.2.12.5. Financials (Based on Availability)
- 16.2.1 Pfizer Inc
List of Figures
- Figure 1: Global Pediatric Drugs Market Revenue Breakdown (Million, %) by Region 2024 & 2032
- Figure 2: Global Pediatric Drugs Market Volume Breakdown (K Unit, %) by Region 2024 & 2032
- Figure 3: North America Pediatric Drugs Market Revenue (Million), by Country 2024 & 2032
- Figure 4: North America Pediatric Drugs Market Volume (K Unit), by Country 2024 & 2032
- Figure 5: North America Pediatric Drugs Market Revenue Share (%), by Country 2024 & 2032
- Figure 6: North America Pediatric Drugs Market Volume Share (%), by Country 2024 & 2032
- Figure 7: Europe Pediatric Drugs Market Revenue (Million), by Country 2024 & 2032
- Figure 8: Europe Pediatric Drugs Market Volume (K Unit), by Country 2024 & 2032
- Figure 9: Europe Pediatric Drugs Market Revenue Share (%), by Country 2024 & 2032
- Figure 10: Europe Pediatric Drugs Market Volume Share (%), by Country 2024 & 2032
- Figure 11: Asia Pacific Pediatric Drugs Market Revenue (Million), by Country 2024 & 2032
- Figure 12: Asia Pacific Pediatric Drugs Market Volume (K Unit), by Country 2024 & 2032
- Figure 13: Asia Pacific Pediatric Drugs Market Revenue Share (%), by Country 2024 & 2032
- Figure 14: Asia Pacific Pediatric Drugs Market Volume Share (%), by Country 2024 & 2032
- Figure 15: Middle East and Africa Pediatric Drugs Market Revenue (Million), by Country 2024 & 2032
- Figure 16: Middle East and Africa Pediatric Drugs Market Volume (K Unit), by Country 2024 & 2032
- Figure 17: Middle East and Africa Pediatric Drugs Market Revenue Share (%), by Country 2024 & 2032
- Figure 18: Middle East and Africa Pediatric Drugs Market Volume Share (%), by Country 2024 & 2032
- Figure 19: South America Pediatric Drugs Market Revenue (Million), by Country 2024 & 2032
- Figure 20: South America Pediatric Drugs Market Volume (K Unit), by Country 2024 & 2032
- Figure 21: South America Pediatric Drugs Market Revenue Share (%), by Country 2024 & 2032
- Figure 22: South America Pediatric Drugs Market Volume Share (%), by Country 2024 & 2032
- Figure 23: North America Pediatric Drugs Market Revenue (Million), by Drug Type 2024 & 2032
- Figure 24: North America Pediatric Drugs Market Volume (K Unit), by Drug Type 2024 & 2032
- Figure 25: North America Pediatric Drugs Market Revenue Share (%), by Drug Type 2024 & 2032
- Figure 26: North America Pediatric Drugs Market Volume Share (%), by Drug Type 2024 & 2032
- Figure 27: North America Pediatric Drugs Market Revenue (Million), by Route of Administration 2024 & 2032
- Figure 28: North America Pediatric Drugs Market Volume (K Unit), by Route of Administration 2024 & 2032
- Figure 29: North America Pediatric Drugs Market Revenue Share (%), by Route of Administration 2024 & 2032
- Figure 30: North America Pediatric Drugs Market Volume Share (%), by Route of Administration 2024 & 2032
- Figure 31: North America Pediatric Drugs Market Revenue (Million), by Country 2024 & 2032
- Figure 32: North America Pediatric Drugs Market Volume (K Unit), by Country 2024 & 2032
- Figure 33: North America Pediatric Drugs Market Revenue Share (%), by Country 2024 & 2032
- Figure 34: North America Pediatric Drugs Market Volume Share (%), by Country 2024 & 2032
- Figure 35: Europe Pediatric Drugs Market Revenue (Million), by Drug Type 2024 & 2032
- Figure 36: Europe Pediatric Drugs Market Volume (K Unit), by Drug Type 2024 & 2032
- Figure 37: Europe Pediatric Drugs Market Revenue Share (%), by Drug Type 2024 & 2032
- Figure 38: Europe Pediatric Drugs Market Volume Share (%), by Drug Type 2024 & 2032
- Figure 39: Europe Pediatric Drugs Market Revenue (Million), by Route of Administration 2024 & 2032
- Figure 40: Europe Pediatric Drugs Market Volume (K Unit), by Route of Administration 2024 & 2032
- Figure 41: Europe Pediatric Drugs Market Revenue Share (%), by Route of Administration 2024 & 2032
- Figure 42: Europe Pediatric Drugs Market Volume Share (%), by Route of Administration 2024 & 2032
- Figure 43: Europe Pediatric Drugs Market Revenue (Million), by Country 2024 & 2032
- Figure 44: Europe Pediatric Drugs Market Volume (K Unit), by Country 2024 & 2032
- Figure 45: Europe Pediatric Drugs Market Revenue Share (%), by Country 2024 & 2032
- Figure 46: Europe Pediatric Drugs Market Volume Share (%), by Country 2024 & 2032
- Figure 47: Asia Pacific Pediatric Drugs Market Revenue (Million), by Drug Type 2024 & 2032
- Figure 48: Asia Pacific Pediatric Drugs Market Volume (K Unit), by Drug Type 2024 & 2032
- Figure 49: Asia Pacific Pediatric Drugs Market Revenue Share (%), by Drug Type 2024 & 2032
- Figure 50: Asia Pacific Pediatric Drugs Market Volume Share (%), by Drug Type 2024 & 2032
- Figure 51: Asia Pacific Pediatric Drugs Market Revenue (Million), by Route of Administration 2024 & 2032
- Figure 52: Asia Pacific Pediatric Drugs Market Volume (K Unit), by Route of Administration 2024 & 2032
- Figure 53: Asia Pacific Pediatric Drugs Market Revenue Share (%), by Route of Administration 2024 & 2032
- Figure 54: Asia Pacific Pediatric Drugs Market Volume Share (%), by Route of Administration 2024 & 2032
- Figure 55: Asia Pacific Pediatric Drugs Market Revenue (Million), by Country 2024 & 2032
- Figure 56: Asia Pacific Pediatric Drugs Market Volume (K Unit), by Country 2024 & 2032
- Figure 57: Asia Pacific Pediatric Drugs Market Revenue Share (%), by Country 2024 & 2032
- Figure 58: Asia Pacific Pediatric Drugs Market Volume Share (%), by Country 2024 & 2032
- Figure 59: Middle East and Africa Pediatric Drugs Market Revenue (Million), by Drug Type 2024 & 2032
- Figure 60: Middle East and Africa Pediatric Drugs Market Volume (K Unit), by Drug Type 2024 & 2032
- Figure 61: Middle East and Africa Pediatric Drugs Market Revenue Share (%), by Drug Type 2024 & 2032
- Figure 62: Middle East and Africa Pediatric Drugs Market Volume Share (%), by Drug Type 2024 & 2032
- Figure 63: Middle East and Africa Pediatric Drugs Market Revenue (Million), by Route of Administration 2024 & 2032
- Figure 64: Middle East and Africa Pediatric Drugs Market Volume (K Unit), by Route of Administration 2024 & 2032
- Figure 65: Middle East and Africa Pediatric Drugs Market Revenue Share (%), by Route of Administration 2024 & 2032
- Figure 66: Middle East and Africa Pediatric Drugs Market Volume Share (%), by Route of Administration 2024 & 2032
- Figure 67: Middle East and Africa Pediatric Drugs Market Revenue (Million), by Country 2024 & 2032
- Figure 68: Middle East and Africa Pediatric Drugs Market Volume (K Unit), by Country 2024 & 2032
- Figure 69: Middle East and Africa Pediatric Drugs Market Revenue Share (%), by Country 2024 & 2032
- Figure 70: Middle East and Africa Pediatric Drugs Market Volume Share (%), by Country 2024 & 2032
- Figure 71: South America Pediatric Drugs Market Revenue (Million), by Drug Type 2024 & 2032
- Figure 72: South America Pediatric Drugs Market Volume (K Unit), by Drug Type 2024 & 2032
- Figure 73: South America Pediatric Drugs Market Revenue Share (%), by Drug Type 2024 & 2032
- Figure 74: South America Pediatric Drugs Market Volume Share (%), by Drug Type 2024 & 2032
- Figure 75: South America Pediatric Drugs Market Revenue (Million), by Route of Administration 2024 & 2032
- Figure 76: South America Pediatric Drugs Market Volume (K Unit), by Route of Administration 2024 & 2032
- Figure 77: South America Pediatric Drugs Market Revenue Share (%), by Route of Administration 2024 & 2032
- Figure 78: South America Pediatric Drugs Market Volume Share (%), by Route of Administration 2024 & 2032
- Figure 79: South America Pediatric Drugs Market Revenue (Million), by Country 2024 & 2032
- Figure 80: South America Pediatric Drugs Market Volume (K Unit), by Country 2024 & 2032
- Figure 81: South America Pediatric Drugs Market Revenue Share (%), by Country 2024 & 2032
- Figure 82: South America Pediatric Drugs Market Volume Share (%), by Country 2024 & 2032
List of Tables
- Table 1: Global Pediatric Drugs Market Revenue Million Forecast, by Region 2019 & 2032
- Table 2: Global Pediatric Drugs Market Volume K Unit Forecast, by Region 2019 & 2032
- Table 3: Global Pediatric Drugs Market Revenue Million Forecast, by Drug Type 2019 & 2032
- Table 4: Global Pediatric Drugs Market Volume K Unit Forecast, by Drug Type 2019 & 2032
- Table 5: Global Pediatric Drugs Market Revenue Million Forecast, by Route of Administration 2019 & 2032
- Table 6: Global Pediatric Drugs Market Volume K Unit Forecast, by Route of Administration 2019 & 2032
- Table 7: Global Pediatric Drugs Market Revenue Million Forecast, by Region 2019 & 2032
- Table 8: Global Pediatric Drugs Market Volume K Unit Forecast, by Region 2019 & 2032
- Table 9: Global Pediatric Drugs Market Revenue Million Forecast, by Country 2019 & 2032
- Table 10: Global Pediatric Drugs Market Volume K Unit Forecast, by Country 2019 & 2032
- Table 11: United States Pediatric Drugs Market Revenue (Million) Forecast, by Application 2019 & 2032
- Table 12: United States Pediatric Drugs Market Volume (K Unit) Forecast, by Application 2019 & 2032
- Table 13: Canada Pediatric Drugs Market Revenue (Million) Forecast, by Application 2019 & 2032
- Table 14: Canada Pediatric Drugs Market Volume (K Unit) Forecast, by Application 2019 & 2032
- Table 15: Mexico Pediatric Drugs Market Revenue (Million) Forecast, by Application 2019 & 2032
- Table 16: Mexico Pediatric Drugs Market Volume (K Unit) Forecast, by Application 2019 & 2032
- Table 17: Global Pediatric Drugs Market Revenue Million Forecast, by Country 2019 & 2032
- Table 18: Global Pediatric Drugs Market Volume K Unit Forecast, by Country 2019 & 2032
- Table 19: Germany Pediatric Drugs Market Revenue (Million) Forecast, by Application 2019 & 2032
- Table 20: Germany Pediatric Drugs Market Volume (K Unit) Forecast, by Application 2019 & 2032
- Table 21: United Kingdom Pediatric Drugs Market Revenue (Million) Forecast, by Application 2019 & 2032
- Table 22: United Kingdom Pediatric Drugs Market Volume (K Unit) Forecast, by Application 2019 & 2032
- Table 23: France Pediatric Drugs Market Revenue (Million) Forecast, by Application 2019 & 2032
- Table 24: France Pediatric Drugs Market Volume (K Unit) Forecast, by Application 2019 & 2032
- Table 25: Italy Pediatric Drugs Market Revenue (Million) Forecast, by Application 2019 & 2032
- Table 26: Italy Pediatric Drugs Market Volume (K Unit) Forecast, by Application 2019 & 2032
- Table 27: Spain Pediatric Drugs Market Revenue (Million) Forecast, by Application 2019 & 2032
- Table 28: Spain Pediatric Drugs Market Volume (K Unit) Forecast, by Application 2019 & 2032
- Table 29: Rest of Europe Pediatric Drugs Market Revenue (Million) Forecast, by Application 2019 & 2032
- Table 30: Rest of Europe Pediatric Drugs Market Volume (K Unit) Forecast, by Application 2019 & 2032
- Table 31: Global Pediatric Drugs Market Revenue Million Forecast, by Country 2019 & 2032
- Table 32: Global Pediatric Drugs Market Volume K Unit Forecast, by Country 2019 & 2032
- Table 33: China Pediatric Drugs Market Revenue (Million) Forecast, by Application 2019 & 2032
- Table 34: China Pediatric Drugs Market Volume (K Unit) Forecast, by Application 2019 & 2032
- Table 35: Japan Pediatric Drugs Market Revenue (Million) Forecast, by Application 2019 & 2032
- Table 36: Japan Pediatric Drugs Market Volume (K Unit) Forecast, by Application 2019 & 2032
- Table 37: India Pediatric Drugs Market Revenue (Million) Forecast, by Application 2019 & 2032
- Table 38: India Pediatric Drugs Market Volume (K Unit) Forecast, by Application 2019 & 2032
- Table 39: Australia Pediatric Drugs Market Revenue (Million) Forecast, by Application 2019 & 2032
- Table 40: Australia Pediatric Drugs Market Volume (K Unit) Forecast, by Application 2019 & 2032
- Table 41: South Korea Pediatric Drugs Market Revenue (Million) Forecast, by Application 2019 & 2032
- Table 42: South Korea Pediatric Drugs Market Volume (K Unit) Forecast, by Application 2019 & 2032
- Table 43: Rest of Asia Pacific Pediatric Drugs Market Revenue (Million) Forecast, by Application 2019 & 2032
- Table 44: Rest of Asia Pacific Pediatric Drugs Market Volume (K Unit) Forecast, by Application 2019 & 2032
- Table 45: Global Pediatric Drugs Market Revenue Million Forecast, by Country 2019 & 2032
- Table 46: Global Pediatric Drugs Market Volume K Unit Forecast, by Country 2019 & 2032
- Table 47: GCC Pediatric Drugs Market Revenue (Million) Forecast, by Application 2019 & 2032
- Table 48: GCC Pediatric Drugs Market Volume (K Unit) Forecast, by Application 2019 & 2032
- Table 49: South Africa Pediatric Drugs Market Revenue (Million) Forecast, by Application 2019 & 2032
- Table 50: South Africa Pediatric Drugs Market Volume (K Unit) Forecast, by Application 2019 & 2032
- Table 51: Rest of Middle East and Africa Pediatric Drugs Market Revenue (Million) Forecast, by Application 2019 & 2032
- Table 52: Rest of Middle East and Africa Pediatric Drugs Market Volume (K Unit) Forecast, by Application 2019 & 2032
- Table 53: Global Pediatric Drugs Market Revenue Million Forecast, by Country 2019 & 2032
- Table 54: Global Pediatric Drugs Market Volume K Unit Forecast, by Country 2019 & 2032
- Table 55: Brazil Pediatric Drugs Market Revenue (Million) Forecast, by Application 2019 & 2032
- Table 56: Brazil Pediatric Drugs Market Volume (K Unit) Forecast, by Application 2019 & 2032
- Table 57: Argentina Pediatric Drugs Market Revenue (Million) Forecast, by Application 2019 & 2032
- Table 58: Argentina Pediatric Drugs Market Volume (K Unit) Forecast, by Application 2019 & 2032
- Table 59: Rest of South America Pediatric Drugs Market Revenue (Million) Forecast, by Application 2019 & 2032
- Table 60: Rest of South America Pediatric Drugs Market Volume (K Unit) Forecast, by Application 2019 & 2032
- Table 61: Global Pediatric Drugs Market Revenue Million Forecast, by Drug Type 2019 & 2032
- Table 62: Global Pediatric Drugs Market Volume K Unit Forecast, by Drug Type 2019 & 2032
- Table 63: Global Pediatric Drugs Market Revenue Million Forecast, by Route of Administration 2019 & 2032
- Table 64: Global Pediatric Drugs Market Volume K Unit Forecast, by Route of Administration 2019 & 2032
- Table 65: Global Pediatric Drugs Market Revenue Million Forecast, by Country 2019 & 2032
- Table 66: Global Pediatric Drugs Market Volume K Unit Forecast, by Country 2019 & 2032
- Table 67: United States Pediatric Drugs Market Revenue (Million) Forecast, by Application 2019 & 2032
- Table 68: United States Pediatric Drugs Market Volume (K Unit) Forecast, by Application 2019 & 2032
- Table 69: Canada Pediatric Drugs Market Revenue (Million) Forecast, by Application 2019 & 2032
- Table 70: Canada Pediatric Drugs Market Volume (K Unit) Forecast, by Application 2019 & 2032
- Table 71: Mexico Pediatric Drugs Market Revenue (Million) Forecast, by Application 2019 & 2032
- Table 72: Mexico Pediatric Drugs Market Volume (K Unit) Forecast, by Application 2019 & 2032
- Table 73: Global Pediatric Drugs Market Revenue Million Forecast, by Drug Type 2019 & 2032
- Table 74: Global Pediatric Drugs Market Volume K Unit Forecast, by Drug Type 2019 & 2032
- Table 75: Global Pediatric Drugs Market Revenue Million Forecast, by Route of Administration 2019 & 2032
- Table 76: Global Pediatric Drugs Market Volume K Unit Forecast, by Route of Administration 2019 & 2032
- Table 77: Global Pediatric Drugs Market Revenue Million Forecast, by Country 2019 & 2032
- Table 78: Global Pediatric Drugs Market Volume K Unit Forecast, by Country 2019 & 2032
- Table 79: Germany Pediatric Drugs Market Revenue (Million) Forecast, by Application 2019 & 2032
- Table 80: Germany Pediatric Drugs Market Volume (K Unit) Forecast, by Application 2019 & 2032
- Table 81: United Kingdom Pediatric Drugs Market Revenue (Million) Forecast, by Application 2019 & 2032
- Table 82: United Kingdom Pediatric Drugs Market Volume (K Unit) Forecast, by Application 2019 & 2032
- Table 83: France Pediatric Drugs Market Revenue (Million) Forecast, by Application 2019 & 2032
- Table 84: France Pediatric Drugs Market Volume (K Unit) Forecast, by Application 2019 & 2032
- Table 85: Italy Pediatric Drugs Market Revenue (Million) Forecast, by Application 2019 & 2032
- Table 86: Italy Pediatric Drugs Market Volume (K Unit) Forecast, by Application 2019 & 2032
- Table 87: Spain Pediatric Drugs Market Revenue (Million) Forecast, by Application 2019 & 2032
- Table 88: Spain Pediatric Drugs Market Volume (K Unit) Forecast, by Application 2019 & 2032
- Table 89: Rest of Europe Pediatric Drugs Market Revenue (Million) Forecast, by Application 2019 & 2032
- Table 90: Rest of Europe Pediatric Drugs Market Volume (K Unit) Forecast, by Application 2019 & 2032
- Table 91: Global Pediatric Drugs Market Revenue Million Forecast, by Drug Type 2019 & 2032
- Table 92: Global Pediatric Drugs Market Volume K Unit Forecast, by Drug Type 2019 & 2032
- Table 93: Global Pediatric Drugs Market Revenue Million Forecast, by Route of Administration 2019 & 2032
- Table 94: Global Pediatric Drugs Market Volume K Unit Forecast, by Route of Administration 2019 & 2032
- Table 95: Global Pediatric Drugs Market Revenue Million Forecast, by Country 2019 & 2032
- Table 96: Global Pediatric Drugs Market Volume K Unit Forecast, by Country 2019 & 2032
- Table 97: China Pediatric Drugs Market Revenue (Million) Forecast, by Application 2019 & 2032
- Table 98: China Pediatric Drugs Market Volume (K Unit) Forecast, by Application 2019 & 2032
- Table 99: Japan Pediatric Drugs Market Revenue (Million) Forecast, by Application 2019 & 2032
- Table 100: Japan Pediatric Drugs Market Volume (K Unit) Forecast, by Application 2019 & 2032
- Table 101: India Pediatric Drugs Market Revenue (Million) Forecast, by Application 2019 & 2032
- Table 102: India Pediatric Drugs Market Volume (K Unit) Forecast, by Application 2019 & 2032
- Table 103: Australia Pediatric Drugs Market Revenue (Million) Forecast, by Application 2019 & 2032
- Table 104: Australia Pediatric Drugs Market Volume (K Unit) Forecast, by Application 2019 & 2032
- Table 105: South Korea Pediatric Drugs Market Revenue (Million) Forecast, by Application 2019 & 2032
- Table 106: South Korea Pediatric Drugs Market Volume (K Unit) Forecast, by Application 2019 & 2032
- Table 107: Rest of Asia Pacific Pediatric Drugs Market Revenue (Million) Forecast, by Application 2019 & 2032
- Table 108: Rest of Asia Pacific Pediatric Drugs Market Volume (K Unit) Forecast, by Application 2019 & 2032
- Table 109: Global Pediatric Drugs Market Revenue Million Forecast, by Drug Type 2019 & 2032
- Table 110: Global Pediatric Drugs Market Volume K Unit Forecast, by Drug Type 2019 & 2032
- Table 111: Global Pediatric Drugs Market Revenue Million Forecast, by Route of Administration 2019 & 2032
- Table 112: Global Pediatric Drugs Market Volume K Unit Forecast, by Route of Administration 2019 & 2032
- Table 113: Global Pediatric Drugs Market Revenue Million Forecast, by Country 2019 & 2032
- Table 114: Global Pediatric Drugs Market Volume K Unit Forecast, by Country 2019 & 2032
- Table 115: GCC Pediatric Drugs Market Revenue (Million) Forecast, by Application 2019 & 2032
- Table 116: GCC Pediatric Drugs Market Volume (K Unit) Forecast, by Application 2019 & 2032
- Table 117: South Africa Pediatric Drugs Market Revenue (Million) Forecast, by Application 2019 & 2032
- Table 118: South Africa Pediatric Drugs Market Volume (K Unit) Forecast, by Application 2019 & 2032
- Table 119: Rest of Middle East and Africa Pediatric Drugs Market Revenue (Million) Forecast, by Application 2019 & 2032
- Table 120: Rest of Middle East and Africa Pediatric Drugs Market Volume (K Unit) Forecast, by Application 2019 & 2032
- Table 121: Global Pediatric Drugs Market Revenue Million Forecast, by Drug Type 2019 & 2032
- Table 122: Global Pediatric Drugs Market Volume K Unit Forecast, by Drug Type 2019 & 2032
- Table 123: Global Pediatric Drugs Market Revenue Million Forecast, by Route of Administration 2019 & 2032
- Table 124: Global Pediatric Drugs Market Volume K Unit Forecast, by Route of Administration 2019 & 2032
- Table 125: Global Pediatric Drugs Market Revenue Million Forecast, by Country 2019 & 2032
- Table 126: Global Pediatric Drugs Market Volume K Unit Forecast, by Country 2019 & 2032
- Table 127: Brazil Pediatric Drugs Market Revenue (Million) Forecast, by Application 2019 & 2032
- Table 128: Brazil Pediatric Drugs Market Volume (K Unit) Forecast, by Application 2019 & 2032
- Table 129: Argentina Pediatric Drugs Market Revenue (Million) Forecast, by Application 2019 & 2032
- Table 130: Argentina Pediatric Drugs Market Volume (K Unit) Forecast, by Application 2019 & 2032
- Table 131: Rest of South America Pediatric Drugs Market Revenue (Million) Forecast, by Application 2019 & 2032
- Table 132: Rest of South America Pediatric Drugs Market Volume (K Unit) Forecast, by Application 2019 & 2032
Frequently Asked Questions
1. What is the projected Compound Annual Growth Rate (CAGR) of the Pediatric Drugs Market?
The projected CAGR is approximately 8.36%.
2. Which companies are prominent players in the Pediatric Drugs Market?
Key companies in the market include Pfizer Inc, BioMarin Pharmaceutical Inc, Sanofi SA, Boehringer Ingelheim International GmbH, Jazz Pharmaceuticals Inc, PTC Therapeutics Inc, Glaxosmithkline PLC, Horizon Therapeutics PLC, Sumitomo Dainippon Pharma Co Ltd, Novartis AG, Johnson & Johnson, Gilead Sciences Inc.
3. What are the main segments of the Pediatric Drugs Market?
The market segments include Drug Type, Route of Administration.
4. Can you provide details about the market size?
The market size is estimated to be USD 130.37 Million as of 2022.
5. What are some drivers contributing to market growth?
Increasing Burden of Pediatric Diseases such as Diabetes. Respiratory Disorders. and Rise in Affordability with Disposable Income; Increased R&D Activities and Awareness of Pediatric Medicine Among Public.
6. What are the notable trends driving market growth?
Respiratory Disorder Drugs Segment By Indication is Expected to Hold the Major Market Share in the Pediatric Drugs Market.
7. Are there any restraints impacting market growth?
Small Size of Study Population and Ethical Issues in Pediatric Research; Risk of Severe Complications Associated with Medicines that may lead to Death.
8. Can you provide examples of recent developments in the market?
In December 2021, Novartis announced the US FDA's approval for Cosentyx (secukinumab) in the treatment of active enthesitis-related arthritis (ERA) in four years and older and active juvenile psoriatic arthritis (JPsA) in patients two years and older.
9. What pricing options are available for accessing the report?
Pricing options include single-user, multi-user, and enterprise licenses priced at USD 4750, USD 5250, and USD 8750 respectively.
10. Is the market size provided in terms of value or volume?
The market size is provided in terms of value, measured in Million and volume, measured in K Unit.
11. Are there any specific market keywords associated with the report?
Yes, the market keyword associated with the report is "Pediatric Drugs Market," which aids in identifying and referencing the specific market segment covered.
12. How do I determine which pricing option suits my needs best?
The pricing options vary based on user requirements and access needs. Individual users may opt for single-user licenses, while businesses requiring broader access may choose multi-user or enterprise licenses for cost-effective access to the report.
13. Are there any additional resources or data provided in the Pediatric Drugs Market report?
While the report offers comprehensive insights, it's advisable to review the specific contents or supplementary materials provided to ascertain if additional resources or data are available.
14. How can I stay updated on further developments or reports in the Pediatric Drugs Market?
To stay informed about further developments, trends, and reports in the Pediatric Drugs Market, consider subscribing to industry newsletters, following relevant companies and organizations, or regularly checking reputable industry news sources and publications.
Methodology
Step 1 - Identification of Relevant Samples Size from Population Database


Step 2 - Approaches for Defining Global Market Size (Value, Volume* & Price*)

Note*: In applicable scenarios
Step 3 - Data Sources
Primary Research
- Web Analytics
- Survey Reports
- Research Institute
- Latest Research Reports
- Opinion Leaders
Secondary Research
- Annual Reports
- White Paper
- Latest Press Release
- Industry Association
- Paid Database
- Investor Presentations

Step 4 - Data Triangulation
Involves using different sources of information in order to increase the validity of a study
These sources are likely to be stakeholders in a program - participants, other researchers, program staff, other community members, and so on.
Then we put all data in single framework & apply various statistical tools to find out the dynamic on the market.
During the analysis stage, feedback from the stakeholder groups would be compared to determine areas of agreement as well as areas of divergence


