
Key Insights
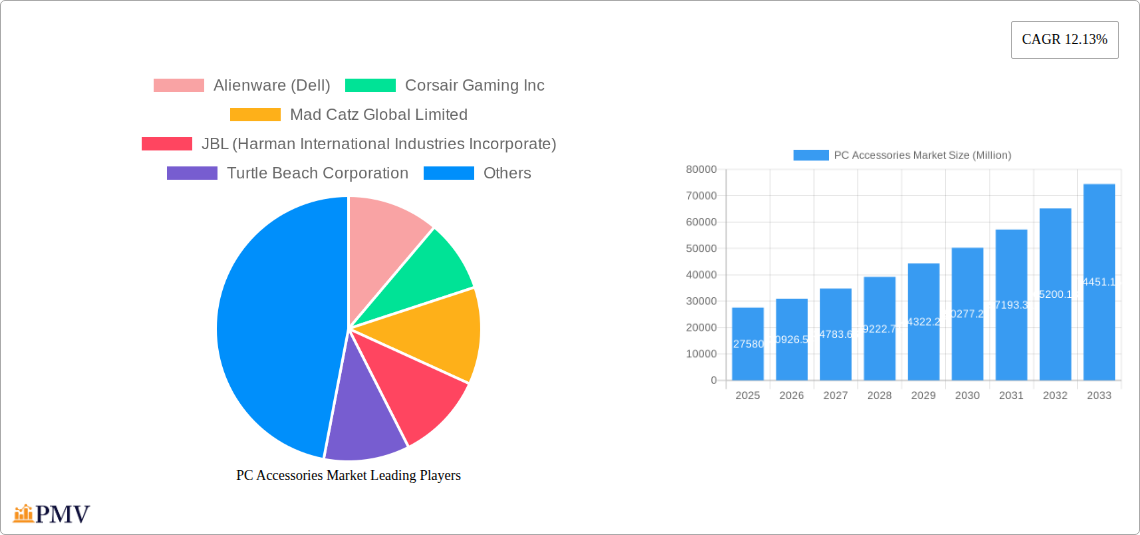
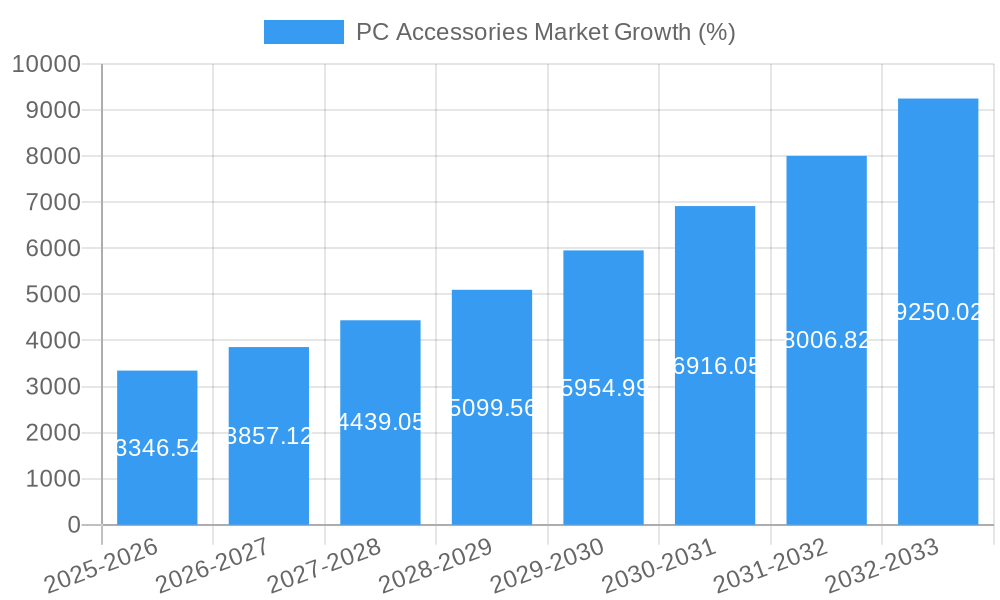
The PC Accessories market, valued at $27.58 billion in 2025, is projected to experience robust growth, driven by a Compound Annual Growth Rate (CAGR) of 12.13% from 2025 to 2033. This expansion is fueled by several key factors. The increasing popularity of gaming, esports, and remote work significantly boosts demand for high-performance peripherals like gaming mice, keyboards, headsets, and monitors. Technological advancements, such as the integration of advanced features in accessories like ergonomic designs, customizable RGB lighting, and improved audio quality, further stimulate market growth. The rising adoption of cloud gaming and the increasing preference for personalized computing setups also contribute to this positive trend. Furthermore, the expanding base of PC users globally, especially in rapidly developing economies, presents significant growth opportunities. However, the market faces challenges like fluctuating raw material prices and potential supply chain disruptions, which could impact production costs and availability. Nevertheless, the long-term outlook for the PC Accessories market remains positive, underpinned by consistent technological innovation and increasing consumer spending on enhancing their digital experiences.
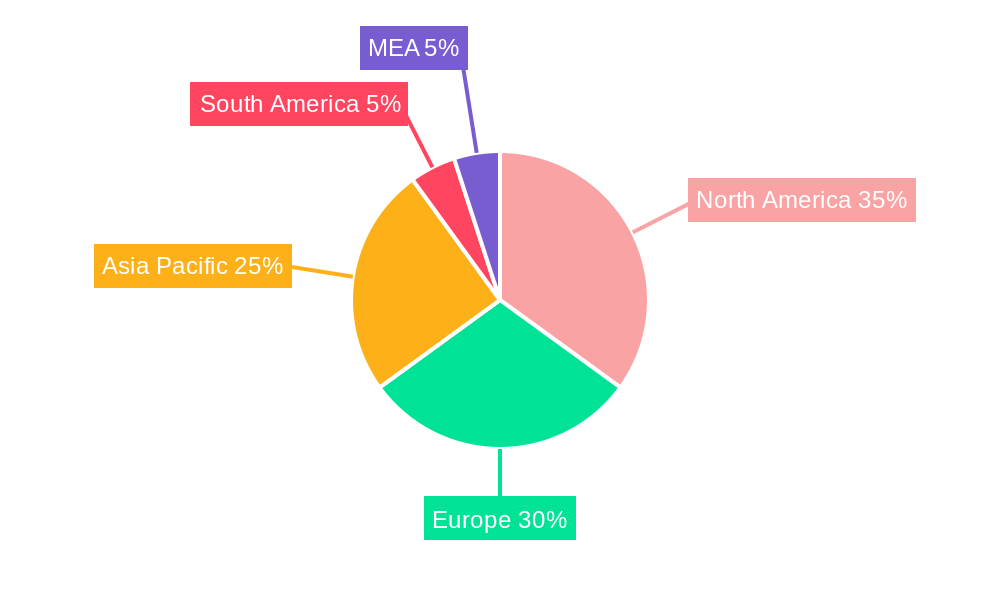
The market segmentation reveals significant opportunities within specific product categories. Gaming accessories, including high-end mice, keyboards, and headsets, are expected to witness particularly strong growth due to the burgeoning gaming industry. The non-gaming segment, encompassing enterprise and consumer needs for peripherals such as webcams and monitor arms, also exhibits healthy growth, driven by the continued expansion of remote work and the increasing demand for improved productivity and collaboration tools. Geographically, North America and Europe currently hold significant market shares, but the Asia-Pacific region, particularly China and India, is anticipated to experience substantial growth due to increasing PC penetration and rising disposable incomes. Competitive dynamics are intense, with established players like Logitech, Razer, and Corsair competing alongside other brands. Strategic partnerships, product innovation, and targeted marketing campaigns are crucial for success in this dynamic and competitive landscape.
This detailed report provides a comprehensive analysis of the global PC Accessories Market, offering valuable insights for industry stakeholders, investors, and strategic decision-makers. With a study period spanning 2019-2033, a base year of 2025, and a forecast period of 2025-2033, this report meticulously examines market trends, competitive dynamics, and future growth prospects. The market is segmented by product type, including gaming and non-gaming segments, encompassing mice, keyboards, headsets, monitor arms, gaming chairs, and webcams. The report values the market at xx Million in 2025 and projects significant growth during the forecast period.
PC Accessories Market Market Structure & Competitive Dynamics
The PC accessories market exhibits a moderately consolidated structure with key players like Alienware (Dell), Corsair Gaming Inc, Logitech International SA, and Razer Inc holding significant market share. The market is characterized by intense competition, driven by continuous product innovation, aggressive pricing strategies, and strategic acquisitions. Market concentration is further influenced by the emergence of regional players and private label brands. The regulatory landscape varies across regions, impacting product certifications and import/export regulations. Furthermore, the market experiences significant substitution effects, particularly with the rise of alternative input devices and peripherals. End-user trends, such as the increasing popularity of gaming and remote work, significantly drive demand for specific accessory types. M&A activities have been prevalent, with deal values exceeding xx Million in recent years, primarily focused on expanding product portfolios and geographic reach.
- Market Concentration: Moderately consolidated, with top 5 players holding approximately xx% market share in 2025.
- Innovation Ecosystems: Strong, with continuous development of advanced technologies like AI-powered features and ergonomic designs.
- Regulatory Frameworks: Vary across regions, impacting product compliance and market access.
- Product Substitutes: Increasing competition from alternative input devices and peripherals.
- End-User Trends: Rising demand driven by gaming, remote work, and increasing digitalization.
- M&A Activities: Significant M&A activity observed, with deal values exceeding xx Million in the past five years.
PC Accessories Market Industry Trends & Insights
The PC accessories market is experiencing robust growth, driven by several factors. The increasing adoption of personal computers for gaming, professional work, and education fuels demand for high-performance peripherals. Technological advancements, such as the integration of AI and improved ergonomics, are enhancing product functionality and user experience, further stimulating market expansion. Consumer preferences are shifting toward customizable accessories with superior aesthetics and enhanced features. The market also witnesses strong competitive dynamics, with established players and emerging brands vying for market share through product differentiation and strategic partnerships. The Compound Annual Growth Rate (CAGR) is estimated at xx% from 2025 to 2033, indicating substantial market expansion. Market penetration is increasing in developing economies, driven by rising disposable incomes and increased internet access.
Dominant Markets & Segments in PC Accessories Market
The North American region holds the dominant position in the PC accessories market, followed by Europe and Asia-Pacific. This dominance is attributed to factors such as high PC penetration rates, strong consumer spending power, and a well-established retail infrastructure. Within product segments, gaming accessories (particularly headsets and gaming mice) exhibit strong growth, driven by the burgeoning gaming industry.
- Key Drivers in North America: High PC penetration, strong consumer spending, robust retail infrastructure.
- Key Drivers in Europe: Increasing adoption of advanced peripherals in enterprise and consumer markets.
- Key Drivers in Asia-Pacific: Rapid economic growth, rising disposable incomes, increasing internet penetration.
Segment Dominance:
- Mice: Gaming mice segment dominates due to high demand from gamers.
- Keyboards: Gaming keyboards, especially mechanical keyboards, enjoy high popularity.
- Headsets: Gaming headsets are the dominant segment owing to immersive audio requirements.
- Monitor Arms: Commercial segment showing strong growth with emphasis on ergonomics.
- Gaming Chairs: Rapid growth observed due to comfort and ergonomic needs of gamers.
- Webcams: Growth spurred by the rise of remote work and online communication.
PC Accessories Market Product Innovations
Recent innovations in PC accessories focus on enhanced ergonomics, improved performance, and integration of advanced technologies. For example, gaming mice incorporate advanced sensors and customizable buttons, while keyboards feature improved mechanical switches and RGB lighting. Headsets are being developed with enhanced noise cancellation and spatial audio capabilities. These innovations cater to the growing demand for high-performance and aesthetically pleasing accessories, enhancing the overall user experience and fueling market growth. The integration of AI-powered features is also gaining traction, offering personalized experiences and improved productivity.
Report Segmentation & Scope
This report segments the PC Accessories Market by various parameters:
By Product: Mice (Gaming & Non-gaming), Keyboards (Gaming & Non-gaming), Headsets (Gaming & Non-gaming), Monitor Arms, Gaming Chairs, Webcams. Each segment exhibits varied growth projections and competitive landscapes. For instance, the gaming segment demonstrates higher growth potential compared to the non-gaming segment.
By Region: North America, Europe, Asia-Pacific, and Rest of the World. Market sizes and growth rates vary across regions due to differences in PC penetration rates, consumer spending power, and regulatory environments.
By End-User: Enterprise, Consumer, Commercial. These segments showcase varying requirements for PC accessories and growth trajectories.
Key Drivers of PC Accessories Market Growth
The PC accessories market's expansion is propelled by several factors: the escalating popularity of gaming and esports, the increasing adoption of PCs for work and education, technological advancements leading to improved functionality and aesthetics, and rising consumer disposable incomes globally. Furthermore, the growth of e-commerce channels expands market reach, while favorable regulatory policies in some regions further facilitate market expansion.
Challenges in the PC Accessories Market Sector
The PC accessories market faces challenges such as intense competition, fluctuating raw material prices impacting production costs, supply chain disruptions leading to delays and increased costs, and potential regulatory hurdles in certain regions. These factors can lead to price fluctuations, reduced profit margins, and difficulties in maintaining consistent product availability. The overall impact on market growth is estimated to be around xx% by 2033.
Leading Players in the PC Accessories Market Market
- Alienware (Dell)
- Corsair Gaming Inc
- Mad Catz Global Limited
- JBL (Harman International Industries Incorporate)
- Turtle Beach Corporation
- Microsoft Corporation
- Nintendo Co Ltd
- Koninklijke Philips NV
- Cooler Master Co Ltd (CMC)
- Sennheiser Electronic GmbH & Co KG
- AOC International
- Razer Inc
- Reddragon (Eastern Times Technology Co Ltd)
- Logitech International SA
- Sony Corporation
Key Developments in PC Accessories Market Sector
- April 2024: Qualcomm Technologies, Inc. launched Snapdragon X Plus, boasting a 37% faster CPU and 54% lower power consumption, potentially impacting the performance of future PC accessories.
- January 2024: Lenovo launched over 40 new AI-powered devices, showcasing AI integration within PC accessories across various sub-brands, influencing consumer preferences and market competition.
Strategic PC Accessories Market Market Outlook
The PC accessories market presents significant growth potential, driven by continuous technological advancements, the expanding gaming industry, and increasing demand for ergonomic and high-performance peripherals. Strategic opportunities lie in developing innovative products with integrated AI features, focusing on sustainable and eco-friendly materials, and expanding into emerging markets. The market is poised for substantial growth, driven by the convergence of technology and consumer demand.
PC Accessories Market Segmentation
-
1. Product
-
1.1. Mice
- 1.1.1. Gaming
- 1.1.2. Non-gaming (Enterprise and Consumer)
- 1.2. Keyboard
-
1.3. Headset
- 1.3.1. Gaming and Personal
- 1.3.2. Non-gaming (Commercial)
- 1.4. Monitor Arms
- 1.5. Gaming Chairs
- 1.6. Webcams
-
1.1. Mice
PC Accessories Market Segmentation By Geography
-
1. North America
- 1.1. United States
- 1.2. Canada
-
2. Europe
- 2.1. Germany
- 2.2. United Kingdom
- 2.3. France
- 2.4. Italy
- 2.5. Russia
- 2.6. Switzerland
-
3. Asia Pacific
- 3.1. China
- 3.2. Japan
- 3.3. South Korea
- 3.4. Australia and New Zealand
-
4. Latin America
- 4.1. Brazil
- 4.2. Mexico
-
5. Middle East and Africa
- 5.1. United Arab Emirates
- 5.2. Saudi Arabia
- 5.3. South Africa
PC Accessories Market REPORT HIGHLIGHTS
| Aspects | Details |
|---|---|
| Study Period | 2019-2033 |
| Base Year | 2024 |
| Estimated Year | 2025 |
| Forecast Period | 2025-2033 |
| Historical Period | 2019-2024 |
| Growth Rate | CAGR of 12.13% from 2019-2033 |
| Segmentation |
|
Table of Contents
- 1. Introduction
- 1.1. Research Scope
- 1.2. Market Segmentation
- 1.3. Research Methodology
- 1.4. Definitions and Assumptions
- 2. Executive Summary
- 2.1. Introduction
- 3. Market Dynamics
- 3.1. Introduction
- 3.2. Market Drivers
- 3.2.1 Rising Adoption of Wireless Technologies; Emergence of Technologies Such as AR
- 3.2.2 VR
- 3.2.3 and AI; Adoption of Gaming Platforms Such as E-sports
- 3.3. Market Restrains
- 3.3.1. Fluctuation in the Production of Silicon Chips is Leading to a Shortage in the Demand for Gaming Accessories
- 3.4. Market Trends
- 3.4.1 Emergence of Technologies such as AR
- 3.4.2 VR
- 3.4.3 and AI to Drive the Market
- 4. Market Factor Analysis
- 4.1. Porters Five Forces
- 4.2. Supply/Value Chain
- 4.3. PESTEL analysis
- 4.4. Market Entropy
- 4.5. Patent/Trademark Analysis
- 5. Global PC Accessories Market Analysis, Insights and Forecast, 2019-2031
- 5.1. Market Analysis, Insights and Forecast - by Product
- 5.1.1. Mice
- 5.1.1.1. Gaming
- 5.1.1.2. Non-gaming (Enterprise and Consumer)
- 5.1.2. Keyboard
- 5.1.3. Headset
- 5.1.3.1. Gaming and Personal
- 5.1.3.2. Non-gaming (Commercial)
- 5.1.4. Monitor Arms
- 5.1.5. Gaming Chairs
- 5.1.6. Webcams
- 5.1.1. Mice
- 5.2. Market Analysis, Insights and Forecast - by Region
- 5.2.1. North America
- 5.2.2. Europe
- 5.2.3. Asia Pacific
- 5.2.4. Latin America
- 5.2.5. Middle East and Africa
- 5.1. Market Analysis, Insights and Forecast - by Product
- 6. North America PC Accessories Market Analysis, Insights and Forecast, 2019-2031
- 6.1. Market Analysis, Insights and Forecast - by Product
- 6.1.1. Mice
- 6.1.1.1. Gaming
- 6.1.1.2. Non-gaming (Enterprise and Consumer)
- 6.1.2. Keyboard
- 6.1.3. Headset
- 6.1.3.1. Gaming and Personal
- 6.1.3.2. Non-gaming (Commercial)
- 6.1.4. Monitor Arms
- 6.1.5. Gaming Chairs
- 6.1.6. Webcams
- 6.1.1. Mice
- 6.1. Market Analysis, Insights and Forecast - by Product
- 7. Europe PC Accessories Market Analysis, Insights and Forecast, 2019-2031
- 7.1. Market Analysis, Insights and Forecast - by Product
- 7.1.1. Mice
- 7.1.1.1. Gaming
- 7.1.1.2. Non-gaming (Enterprise and Consumer)
- 7.1.2. Keyboard
- 7.1.3. Headset
- 7.1.3.1. Gaming and Personal
- 7.1.3.2. Non-gaming (Commercial)
- 7.1.4. Monitor Arms
- 7.1.5. Gaming Chairs
- 7.1.6. Webcams
- 7.1.1. Mice
- 7.1. Market Analysis, Insights and Forecast - by Product
- 8. Asia Pacific PC Accessories Market Analysis, Insights and Forecast, 2019-2031
- 8.1. Market Analysis, Insights and Forecast - by Product
- 8.1.1. Mice
- 8.1.1.1. Gaming
- 8.1.1.2. Non-gaming (Enterprise and Consumer)
- 8.1.2. Keyboard
- 8.1.3. Headset
- 8.1.3.1. Gaming and Personal
- 8.1.3.2. Non-gaming (Commercial)
- 8.1.4. Monitor Arms
- 8.1.5. Gaming Chairs
- 8.1.6. Webcams
- 8.1.1. Mice
- 8.1. Market Analysis, Insights and Forecast - by Product
- 9. Latin America PC Accessories Market Analysis, Insights and Forecast, 2019-2031
- 9.1. Market Analysis, Insights and Forecast - by Product
- 9.1.1. Mice
- 9.1.1.1. Gaming
- 9.1.1.2. Non-gaming (Enterprise and Consumer)
- 9.1.2. Keyboard
- 9.1.3. Headset
- 9.1.3.1. Gaming and Personal
- 9.1.3.2. Non-gaming (Commercial)
- 9.1.4. Monitor Arms
- 9.1.5. Gaming Chairs
- 9.1.6. Webcams
- 9.1.1. Mice
- 9.1. Market Analysis, Insights and Forecast - by Product
- 10. Middle East and Africa PC Accessories Market Analysis, Insights and Forecast, 2019-2031
- 10.1. Market Analysis, Insights and Forecast - by Product
- 10.1.1. Mice
- 10.1.1.1. Gaming
- 10.1.1.2. Non-gaming (Enterprise and Consumer)
- 10.1.2. Keyboard
- 10.1.3. Headset
- 10.1.3.1. Gaming and Personal
- 10.1.3.2. Non-gaming (Commercial)
- 10.1.4. Monitor Arms
- 10.1.5. Gaming Chairs
- 10.1.6. Webcams
- 10.1.1. Mice
- 10.1. Market Analysis, Insights and Forecast - by Product
- 11. North America PC Accessories Market Analysis, Insights and Forecast, 2019-2031
- 11.1. Market Analysis, Insights and Forecast - By Country/Sub-region
- 11.1.1 United States
- 11.1.2 Canada
- 11.1.3 Mexico
- 12. Europe PC Accessories Market Analysis, Insights and Forecast, 2019-2031
- 12.1. Market Analysis, Insights and Forecast - By Country/Sub-region
- 12.1.1 Germany
- 12.1.2 United Kingdom
- 12.1.3 France
- 12.1.4 Spain
- 12.1.5 Italy
- 12.1.6 Spain
- 12.1.7 Belgium
- 12.1.8 Netherland
- 12.1.9 Nordics
- 12.1.10 Rest of Europe
- 13. Asia Pacific PC Accessories Market Analysis, Insights and Forecast, 2019-2031
- 13.1. Market Analysis, Insights and Forecast - By Country/Sub-region
- 13.1.1 China
- 13.1.2 Japan
- 13.1.3 India
- 13.1.4 South Korea
- 13.1.5 Southeast Asia
- 13.1.6 Australia
- 13.1.7 Indonesia
- 13.1.8 Phillipes
- 13.1.9 Singapore
- 13.1.10 Thailandc
- 13.1.11 Rest of Asia Pacific
- 14. South America PC Accessories Market Analysis, Insights and Forecast, 2019-2031
- 14.1. Market Analysis, Insights and Forecast - By Country/Sub-region
- 14.1.1 Brazil
- 14.1.2 Argentina
- 14.1.3 Peru
- 14.1.4 Chile
- 14.1.5 Colombia
- 14.1.6 Ecuador
- 14.1.7 Venezuela
- 14.1.8 Rest of South America
- 15. North America PC Accessories Market Analysis, Insights and Forecast, 2019-2031
- 15.1. Market Analysis, Insights and Forecast - By Country/Sub-region
- 15.1.1 United States
- 15.1.2 Canada
- 15.1.3 Mexico
- 16. MEA PC Accessories Market Analysis, Insights and Forecast, 2019-2031
- 16.1. Market Analysis, Insights and Forecast - By Country/Sub-region
- 16.1.1 United Arab Emirates
- 16.1.2 Saudi Arabia
- 16.1.3 South Africa
- 16.1.4 Rest of Middle East and Africa
- 17. Competitive Analysis
- 17.1. Global Market Share Analysis 2024
- 17.2. Company Profiles
- 17.2.1 Alienware (Dell)
- 17.2.1.1. Overview
- 17.2.1.2. Products
- 17.2.1.3. SWOT Analysis
- 17.2.1.4. Recent Developments
- 17.2.1.5. Financials (Based on Availability)
- 17.2.2 Corsair Gaming Inc
- 17.2.2.1. Overview
- 17.2.2.2. Products
- 17.2.2.3. SWOT Analysis
- 17.2.2.4. Recent Developments
- 17.2.2.5. Financials (Based on Availability)
- 17.2.3 Mad Catz Global Limited
- 17.2.3.1. Overview
- 17.2.3.2. Products
- 17.2.3.3. SWOT Analysis
- 17.2.3.4. Recent Developments
- 17.2.3.5. Financials (Based on Availability)
- 17.2.4 JBL (Harman International Industries Incorporate)
- 17.2.4.1. Overview
- 17.2.4.2. Products
- 17.2.4.3. SWOT Analysis
- 17.2.4.4. Recent Developments
- 17.2.4.5. Financials (Based on Availability)
- 17.2.5 Turtle Beach Corporation
- 17.2.5.1. Overview
- 17.2.5.2. Products
- 17.2.5.3. SWOT Analysis
- 17.2.5.4. Recent Developments
- 17.2.5.5. Financials (Based on Availability)
- 17.2.6 Microsoft Corporation
- 17.2.6.1. Overview
- 17.2.6.2. Products
- 17.2.6.3. SWOT Analysis
- 17.2.6.4. Recent Developments
- 17.2.6.5. Financials (Based on Availability)
- 17.2.7 Nintendo Co Ltd
- 17.2.7.1. Overview
- 17.2.7.2. Products
- 17.2.7.3. SWOT Analysis
- 17.2.7.4. Recent Developments
- 17.2.7.5. Financials (Based on Availability)
- 17.2.8 Koninklijke Philips NV
- 17.2.8.1. Overview
- 17.2.8.2. Products
- 17.2.8.3. SWOT Analysis
- 17.2.8.4. Recent Developments
- 17.2.8.5. Financials (Based on Availability)
- 17.2.9 Cooler Master Co Ltd (CMC)
- 17.2.9.1. Overview
- 17.2.9.2. Products
- 17.2.9.3. SWOT Analysis
- 17.2.9.4. Recent Developments
- 17.2.9.5. Financials (Based on Availability)
- 17.2.10 Sennheiser Electronic GmbH & Co KG
- 17.2.10.1. Overview
- 17.2.10.2. Products
- 17.2.10.3. SWOT Analysis
- 17.2.10.4. Recent Developments
- 17.2.10.5. Financials (Based on Availability)
- 17.2.11 AOC Internationa
- 17.2.11.1. Overview
- 17.2.11.2. Products
- 17.2.11.3. SWOT Analysis
- 17.2.11.4. Recent Developments
- 17.2.11.5. Financials (Based on Availability)
- 17.2.12 Razer Inc
- 17.2.12.1. Overview
- 17.2.12.2. Products
- 17.2.12.3. SWOT Analysis
- 17.2.12.4. Recent Developments
- 17.2.12.5. Financials (Based on Availability)
- 17.2.13 Reddragon (Eastern Times Technology Co Ltd)
- 17.2.13.1. Overview
- 17.2.13.2. Products
- 17.2.13.3. SWOT Analysis
- 17.2.13.4. Recent Developments
- 17.2.13.5. Financials (Based on Availability)
- 17.2.14 Logitech International SA
- 17.2.14.1. Overview
- 17.2.14.2. Products
- 17.2.14.3. SWOT Analysis
- 17.2.14.4. Recent Developments
- 17.2.14.5. Financials (Based on Availability)
- 17.2.15 Sony Corporation
- 17.2.15.1. Overview
- 17.2.15.2. Products
- 17.2.15.3. SWOT Analysis
- 17.2.15.4. Recent Developments
- 17.2.15.5. Financials (Based on Availability)
- 17.2.1 Alienware (Dell)
List of Figures
- Figure 1: Global PC Accessories Market Revenue Breakdown (Million, %) by Region 2024 & 2032
- Figure 2: Global PC Accessories Market Volume Breakdown (K Unit, %) by Region 2024 & 2032
- Figure 3: North America PC Accessories Market Revenue (Million), by Country 2024 & 2032
- Figure 4: North America PC Accessories Market Volume (K Unit), by Country 2024 & 2032
- Figure 5: North America PC Accessories Market Revenue Share (%), by Country 2024 & 2032
- Figure 6: North America PC Accessories Market Volume Share (%), by Country 2024 & 2032
- Figure 7: Europe PC Accessories Market Revenue (Million), by Country 2024 & 2032
- Figure 8: Europe PC Accessories Market Volume (K Unit), by Country 2024 & 2032
- Figure 9: Europe PC Accessories Market Revenue Share (%), by Country 2024 & 2032
- Figure 10: Europe PC Accessories Market Volume Share (%), by Country 2024 & 2032
- Figure 11: Asia Pacific PC Accessories Market Revenue (Million), by Country 2024 & 2032
- Figure 12: Asia Pacific PC Accessories Market Volume (K Unit), by Country 2024 & 2032
- Figure 13: Asia Pacific PC Accessories Market Revenue Share (%), by Country 2024 & 2032
- Figure 14: Asia Pacific PC Accessories Market Volume Share (%), by Country 2024 & 2032
- Figure 15: South America PC Accessories Market Revenue (Million), by Country 2024 & 2032
- Figure 16: South America PC Accessories Market Volume (K Unit), by Country 2024 & 2032
- Figure 17: South America PC Accessories Market Revenue Share (%), by Country 2024 & 2032
- Figure 18: South America PC Accessories Market Volume Share (%), by Country 2024 & 2032
- Figure 19: North America PC Accessories Market Revenue (Million), by Country 2024 & 2032
- Figure 20: North America PC Accessories Market Volume (K Unit), by Country 2024 & 2032
- Figure 21: North America PC Accessories Market Revenue Share (%), by Country 2024 & 2032
- Figure 22: North America PC Accessories Market Volume Share (%), by Country 2024 & 2032
- Figure 23: MEA PC Accessories Market Revenue (Million), by Country 2024 & 2032
- Figure 24: MEA PC Accessories Market Volume (K Unit), by Country 2024 & 2032
- Figure 25: MEA PC Accessories Market Revenue Share (%), by Country 2024 & 2032
- Figure 26: MEA PC Accessories Market Volume Share (%), by Country 2024 & 2032
- Figure 27: North America PC Accessories Market Revenue (Million), by Product 2024 & 2032
- Figure 28: North America PC Accessories Market Volume (K Unit), by Product 2024 & 2032
- Figure 29: North America PC Accessories Market Revenue Share (%), by Product 2024 & 2032
- Figure 30: North America PC Accessories Market Volume Share (%), by Product 2024 & 2032
- Figure 31: North America PC Accessories Market Revenue (Million), by Country 2024 & 2032
- Figure 32: North America PC Accessories Market Volume (K Unit), by Country 2024 & 2032
- Figure 33: North America PC Accessories Market Revenue Share (%), by Country 2024 & 2032
- Figure 34: North America PC Accessories Market Volume Share (%), by Country 2024 & 2032
- Figure 35: Europe PC Accessories Market Revenue (Million), by Product 2024 & 2032
- Figure 36: Europe PC Accessories Market Volume (K Unit), by Product 2024 & 2032
- Figure 37: Europe PC Accessories Market Revenue Share (%), by Product 2024 & 2032
- Figure 38: Europe PC Accessories Market Volume Share (%), by Product 2024 & 2032
- Figure 39: Europe PC Accessories Market Revenue (Million), by Country 2024 & 2032
- Figure 40: Europe PC Accessories Market Volume (K Unit), by Country 2024 & 2032
- Figure 41: Europe PC Accessories Market Revenue Share (%), by Country 2024 & 2032
- Figure 42: Europe PC Accessories Market Volume Share (%), by Country 2024 & 2032
- Figure 43: Asia Pacific PC Accessories Market Revenue (Million), by Product 2024 & 2032
- Figure 44: Asia Pacific PC Accessories Market Volume (K Unit), by Product 2024 & 2032
- Figure 45: Asia Pacific PC Accessories Market Revenue Share (%), by Product 2024 & 2032
- Figure 46: Asia Pacific PC Accessories Market Volume Share (%), by Product 2024 & 2032
- Figure 47: Asia Pacific PC Accessories Market Revenue (Million), by Country 2024 & 2032
- Figure 48: Asia Pacific PC Accessories Market Volume (K Unit), by Country 2024 & 2032
- Figure 49: Asia Pacific PC Accessories Market Revenue Share (%), by Country 2024 & 2032
- Figure 50: Asia Pacific PC Accessories Market Volume Share (%), by Country 2024 & 2032
- Figure 51: Latin America PC Accessories Market Revenue (Million), by Product 2024 & 2032
- Figure 52: Latin America PC Accessories Market Volume (K Unit), by Product 2024 & 2032
- Figure 53: Latin America PC Accessories Market Revenue Share (%), by Product 2024 & 2032
- Figure 54: Latin America PC Accessories Market Volume Share (%), by Product 2024 & 2032
- Figure 55: Latin America PC Accessories Market Revenue (Million), by Country 2024 & 2032
- Figure 56: Latin America PC Accessories Market Volume (K Unit), by Country 2024 & 2032
- Figure 57: Latin America PC Accessories Market Revenue Share (%), by Country 2024 & 2032
- Figure 58: Latin America PC Accessories Market Volume Share (%), by Country 2024 & 2032
- Figure 59: Middle East and Africa PC Accessories Market Revenue (Million), by Product 2024 & 2032
- Figure 60: Middle East and Africa PC Accessories Market Volume (K Unit), by Product 2024 & 2032
- Figure 61: Middle East and Africa PC Accessories Market Revenue Share (%), by Product 2024 & 2032
- Figure 62: Middle East and Africa PC Accessories Market Volume Share (%), by Product 2024 & 2032
- Figure 63: Middle East and Africa PC Accessories Market Revenue (Million), by Country 2024 & 2032
- Figure 64: Middle East and Africa PC Accessories Market Volume (K Unit), by Country 2024 & 2032
- Figure 65: Middle East and Africa PC Accessories Market Revenue Share (%), by Country 2024 & 2032
- Figure 66: Middle East and Africa PC Accessories Market Volume Share (%), by Country 2024 & 2032
List of Tables
- Table 1: Global PC Accessories Market Revenue Million Forecast, by Region 2019 & 2032
- Table 2: Global PC Accessories Market Volume K Unit Forecast, by Region 2019 & 2032
- Table 3: Global PC Accessories Market Revenue Million Forecast, by Product 2019 & 2032
- Table 4: Global PC Accessories Market Volume K Unit Forecast, by Product 2019 & 2032
- Table 5: Global PC Accessories Market Revenue Million Forecast, by Region 2019 & 2032
- Table 6: Global PC Accessories Market Volume K Unit Forecast, by Region 2019 & 2032
- Table 7: Global PC Accessories Market Revenue Million Forecast, by Country 2019 & 2032
- Table 8: Global PC Accessories Market Volume K Unit Forecast, by Country 2019 & 2032
- Table 9: United States PC Accessories Market Revenue (Million) Forecast, by Application 2019 & 2032
- Table 10: United States PC Accessories Market Volume (K Unit) Forecast, by Application 2019 & 2032
- Table 11: Canada PC Accessories Market Revenue (Million) Forecast, by Application 2019 & 2032
- Table 12: Canada PC Accessories Market Volume (K Unit) Forecast, by Application 2019 & 2032
- Table 13: Mexico PC Accessories Market Revenue (Million) Forecast, by Application 2019 & 2032
- Table 14: Mexico PC Accessories Market Volume (K Unit) Forecast, by Application 2019 & 2032
- Table 15: Global PC Accessories Market Revenue Million Forecast, by Country 2019 & 2032
- Table 16: Global PC Accessories Market Volume K Unit Forecast, by Country 2019 & 2032
- Table 17: Germany PC Accessories Market Revenue (Million) Forecast, by Application 2019 & 2032
- Table 18: Germany PC Accessories Market Volume (K Unit) Forecast, by Application 2019 & 2032
- Table 19: United Kingdom PC Accessories Market Revenue (Million) Forecast, by Application 2019 & 2032
- Table 20: United Kingdom PC Accessories Market Volume (K Unit) Forecast, by Application 2019 & 2032
- Table 21: France PC Accessories Market Revenue (Million) Forecast, by Application 2019 & 2032
- Table 22: France PC Accessories Market Volume (K Unit) Forecast, by Application 2019 & 2032
- Table 23: Spain PC Accessories Market Revenue (Million) Forecast, by Application 2019 & 2032
- Table 24: Spain PC Accessories Market Volume (K Unit) Forecast, by Application 2019 & 2032
- Table 25: Italy PC Accessories Market Revenue (Million) Forecast, by Application 2019 & 2032
- Table 26: Italy PC Accessories Market Volume (K Unit) Forecast, by Application 2019 & 2032
- Table 27: Spain PC Accessories Market Revenue (Million) Forecast, by Application 2019 & 2032
- Table 28: Spain PC Accessories Market Volume (K Unit) Forecast, by Application 2019 & 2032
- Table 29: Belgium PC Accessories Market Revenue (Million) Forecast, by Application 2019 & 2032
- Table 30: Belgium PC Accessories Market Volume (K Unit) Forecast, by Application 2019 & 2032
- Table 31: Netherland PC Accessories Market Revenue (Million) Forecast, by Application 2019 & 2032
- Table 32: Netherland PC Accessories Market Volume (K Unit) Forecast, by Application 2019 & 2032
- Table 33: Nordics PC Accessories Market Revenue (Million) Forecast, by Application 2019 & 2032
- Table 34: Nordics PC Accessories Market Volume (K Unit) Forecast, by Application 2019 & 2032
- Table 35: Rest of Europe PC Accessories Market Revenue (Million) Forecast, by Application 2019 & 2032
- Table 36: Rest of Europe PC Accessories Market Volume (K Unit) Forecast, by Application 2019 & 2032
- Table 37: Global PC Accessories Market Revenue Million Forecast, by Country 2019 & 2032
- Table 38: Global PC Accessories Market Volume K Unit Forecast, by Country 2019 & 2032
- Table 39: China PC Accessories Market Revenue (Million) Forecast, by Application 2019 & 2032
- Table 40: China PC Accessories Market Volume (K Unit) Forecast, by Application 2019 & 2032
- Table 41: Japan PC Accessories Market Revenue (Million) Forecast, by Application 2019 & 2032
- Table 42: Japan PC Accessories Market Volume (K Unit) Forecast, by Application 2019 & 2032
- Table 43: India PC Accessories Market Revenue (Million) Forecast, by Application 2019 & 2032
- Table 44: India PC Accessories Market Volume (K Unit) Forecast, by Application 2019 & 2032
- Table 45: South Korea PC Accessories Market Revenue (Million) Forecast, by Application 2019 & 2032
- Table 46: South Korea PC Accessories Market Volume (K Unit) Forecast, by Application 2019 & 2032
- Table 47: Southeast Asia PC Accessories Market Revenue (Million) Forecast, by Application 2019 & 2032
- Table 48: Southeast Asia PC Accessories Market Volume (K Unit) Forecast, by Application 2019 & 2032
- Table 49: Australia PC Accessories Market Revenue (Million) Forecast, by Application 2019 & 2032
- Table 50: Australia PC Accessories Market Volume (K Unit) Forecast, by Application 2019 & 2032
- Table 51: Indonesia PC Accessories Market Revenue (Million) Forecast, by Application 2019 & 2032
- Table 52: Indonesia PC Accessories Market Volume (K Unit) Forecast, by Application 2019 & 2032
- Table 53: Phillipes PC Accessories Market Revenue (Million) Forecast, by Application 2019 & 2032
- Table 54: Phillipes PC Accessories Market Volume (K Unit) Forecast, by Application 2019 & 2032
- Table 55: Singapore PC Accessories Market Revenue (Million) Forecast, by Application 2019 & 2032
- Table 56: Singapore PC Accessories Market Volume (K Unit) Forecast, by Application 2019 & 2032
- Table 57: Thailandc PC Accessories Market Revenue (Million) Forecast, by Application 2019 & 2032
- Table 58: Thailandc PC Accessories Market Volume (K Unit) Forecast, by Application 2019 & 2032
- Table 59: Rest of Asia Pacific PC Accessories Market Revenue (Million) Forecast, by Application 2019 & 2032
- Table 60: Rest of Asia Pacific PC Accessories Market Volume (K Unit) Forecast, by Application 2019 & 2032
- Table 61: Global PC Accessories Market Revenue Million Forecast, by Country 2019 & 2032
- Table 62: Global PC Accessories Market Volume K Unit Forecast, by Country 2019 & 2032
- Table 63: Brazil PC Accessories Market Revenue (Million) Forecast, by Application 2019 & 2032
- Table 64: Brazil PC Accessories Market Volume (K Unit) Forecast, by Application 2019 & 2032
- Table 65: Argentina PC Accessories Market Revenue (Million) Forecast, by Application 2019 & 2032
- Table 66: Argentina PC Accessories Market Volume (K Unit) Forecast, by Application 2019 & 2032
- Table 67: Peru PC Accessories Market Revenue (Million) Forecast, by Application 2019 & 2032
- Table 68: Peru PC Accessories Market Volume (K Unit) Forecast, by Application 2019 & 2032
- Table 69: Chile PC Accessories Market Revenue (Million) Forecast, by Application 2019 & 2032
- Table 70: Chile PC Accessories Market Volume (K Unit) Forecast, by Application 2019 & 2032
- Table 71: Colombia PC Accessories Market Revenue (Million) Forecast, by Application 2019 & 2032
- Table 72: Colombia PC Accessories Market Volume (K Unit) Forecast, by Application 2019 & 2032
- Table 73: Ecuador PC Accessories Market Revenue (Million) Forecast, by Application 2019 & 2032
- Table 74: Ecuador PC Accessories Market Volume (K Unit) Forecast, by Application 2019 & 2032
- Table 75: Venezuela PC Accessories Market Revenue (Million) Forecast, by Application 2019 & 2032
- Table 76: Venezuela PC Accessories Market Volume (K Unit) Forecast, by Application 2019 & 2032
- Table 77: Rest of South America PC Accessories Market Revenue (Million) Forecast, by Application 2019 & 2032
- Table 78: Rest of South America PC Accessories Market Volume (K Unit) Forecast, by Application 2019 & 2032
- Table 79: Global PC Accessories Market Revenue Million Forecast, by Country 2019 & 2032
- Table 80: Global PC Accessories Market Volume K Unit Forecast, by Country 2019 & 2032
- Table 81: United States PC Accessories Market Revenue (Million) Forecast, by Application 2019 & 2032
- Table 82: United States PC Accessories Market Volume (K Unit) Forecast, by Application 2019 & 2032
- Table 83: Canada PC Accessories Market Revenue (Million) Forecast, by Application 2019 & 2032
- Table 84: Canada PC Accessories Market Volume (K Unit) Forecast, by Application 2019 & 2032
- Table 85: Mexico PC Accessories Market Revenue (Million) Forecast, by Application 2019 & 2032
- Table 86: Mexico PC Accessories Market Volume (K Unit) Forecast, by Application 2019 & 2032
- Table 87: Global PC Accessories Market Revenue Million Forecast, by Country 2019 & 2032
- Table 88: Global PC Accessories Market Volume K Unit Forecast, by Country 2019 & 2032
- Table 89: United Arab Emirates PC Accessories Market Revenue (Million) Forecast, by Application 2019 & 2032
- Table 90: United Arab Emirates PC Accessories Market Volume (K Unit) Forecast, by Application 2019 & 2032
- Table 91: Saudi Arabia PC Accessories Market Revenue (Million) Forecast, by Application 2019 & 2032
- Table 92: Saudi Arabia PC Accessories Market Volume (K Unit) Forecast, by Application 2019 & 2032
- Table 93: South Africa PC Accessories Market Revenue (Million) Forecast, by Application 2019 & 2032
- Table 94: South Africa PC Accessories Market Volume (K Unit) Forecast, by Application 2019 & 2032
- Table 95: Rest of Middle East and Africa PC Accessories Market Revenue (Million) Forecast, by Application 2019 & 2032
- Table 96: Rest of Middle East and Africa PC Accessories Market Volume (K Unit) Forecast, by Application 2019 & 2032
- Table 97: Global PC Accessories Market Revenue Million Forecast, by Product 2019 & 2032
- Table 98: Global PC Accessories Market Volume K Unit Forecast, by Product 2019 & 2032
- Table 99: Global PC Accessories Market Revenue Million Forecast, by Country 2019 & 2032
- Table 100: Global PC Accessories Market Volume K Unit Forecast, by Country 2019 & 2032
- Table 101: United States PC Accessories Market Revenue (Million) Forecast, by Application 2019 & 2032
- Table 102: United States PC Accessories Market Volume (K Unit) Forecast, by Application 2019 & 2032
- Table 103: Canada PC Accessories Market Revenue (Million) Forecast, by Application 2019 & 2032
- Table 104: Canada PC Accessories Market Volume (K Unit) Forecast, by Application 2019 & 2032
- Table 105: Global PC Accessories Market Revenue Million Forecast, by Product 2019 & 2032
- Table 106: Global PC Accessories Market Volume K Unit Forecast, by Product 2019 & 2032
- Table 107: Global PC Accessories Market Revenue Million Forecast, by Country 2019 & 2032
- Table 108: Global PC Accessories Market Volume K Unit Forecast, by Country 2019 & 2032
- Table 109: Germany PC Accessories Market Revenue (Million) Forecast, by Application 2019 & 2032
- Table 110: Germany PC Accessories Market Volume (K Unit) Forecast, by Application 2019 & 2032
- Table 111: United Kingdom PC Accessories Market Revenue (Million) Forecast, by Application 2019 & 2032
- Table 112: United Kingdom PC Accessories Market Volume (K Unit) Forecast, by Application 2019 & 2032
- Table 113: France PC Accessories Market Revenue (Million) Forecast, by Application 2019 & 2032
- Table 114: France PC Accessories Market Volume (K Unit) Forecast, by Application 2019 & 2032
- Table 115: Italy PC Accessories Market Revenue (Million) Forecast, by Application 2019 & 2032
- Table 116: Italy PC Accessories Market Volume (K Unit) Forecast, by Application 2019 & 2032
- Table 117: Russia PC Accessories Market Revenue (Million) Forecast, by Application 2019 & 2032
- Table 118: Russia PC Accessories Market Volume (K Unit) Forecast, by Application 2019 & 2032
- Table 119: Switzerland PC Accessories Market Revenue (Million) Forecast, by Application 2019 & 2032
- Table 120: Switzerland PC Accessories Market Volume (K Unit) Forecast, by Application 2019 & 2032
- Table 121: Global PC Accessories Market Revenue Million Forecast, by Product 2019 & 2032
- Table 122: Global PC Accessories Market Volume K Unit Forecast, by Product 2019 & 2032
- Table 123: Global PC Accessories Market Revenue Million Forecast, by Country 2019 & 2032
- Table 124: Global PC Accessories Market Volume K Unit Forecast, by Country 2019 & 2032
- Table 125: China PC Accessories Market Revenue (Million) Forecast, by Application 2019 & 2032
- Table 126: China PC Accessories Market Volume (K Unit) Forecast, by Application 2019 & 2032
- Table 127: Japan PC Accessories Market Revenue (Million) Forecast, by Application 2019 & 2032
- Table 128: Japan PC Accessories Market Volume (K Unit) Forecast, by Application 2019 & 2032
- Table 129: South Korea PC Accessories Market Revenue (Million) Forecast, by Application 2019 & 2032
- Table 130: South Korea PC Accessories Market Volume (K Unit) Forecast, by Application 2019 & 2032
- Table 131: Australia and New Zealand PC Accessories Market Revenue (Million) Forecast, by Application 2019 & 2032
- Table 132: Australia and New Zealand PC Accessories Market Volume (K Unit) Forecast, by Application 2019 & 2032
- Table 133: Global PC Accessories Market Revenue Million Forecast, by Product 2019 & 2032
- Table 134: Global PC Accessories Market Volume K Unit Forecast, by Product 2019 & 2032
- Table 135: Global PC Accessories Market Revenue Million Forecast, by Country 2019 & 2032
- Table 136: Global PC Accessories Market Volume K Unit Forecast, by Country 2019 & 2032
- Table 137: Brazil PC Accessories Market Revenue (Million) Forecast, by Application 2019 & 2032
- Table 138: Brazil PC Accessories Market Volume (K Unit) Forecast, by Application 2019 & 2032
- Table 139: Mexico PC Accessories Market Revenue (Million) Forecast, by Application 2019 & 2032
- Table 140: Mexico PC Accessories Market Volume (K Unit) Forecast, by Application 2019 & 2032
- Table 141: Global PC Accessories Market Revenue Million Forecast, by Product 2019 & 2032
- Table 142: Global PC Accessories Market Volume K Unit Forecast, by Product 2019 & 2032
- Table 143: Global PC Accessories Market Revenue Million Forecast, by Country 2019 & 2032
- Table 144: Global PC Accessories Market Volume K Unit Forecast, by Country 2019 & 2032
- Table 145: United Arab Emirates PC Accessories Market Revenue (Million) Forecast, by Application 2019 & 2032
- Table 146: United Arab Emirates PC Accessories Market Volume (K Unit) Forecast, by Application 2019 & 2032
- Table 147: Saudi Arabia PC Accessories Market Revenue (Million) Forecast, by Application 2019 & 2032
- Table 148: Saudi Arabia PC Accessories Market Volume (K Unit) Forecast, by Application 2019 & 2032
- Table 149: South Africa PC Accessories Market Revenue (Million) Forecast, by Application 2019 & 2032
- Table 150: South Africa PC Accessories Market Volume (K Unit) Forecast, by Application 2019 & 2032
Frequently Asked Questions
1. What is the projected Compound Annual Growth Rate (CAGR) of the PC Accessories Market?
The projected CAGR is approximately 12.13%.
2. Which companies are prominent players in the PC Accessories Market?
Key companies in the market include Alienware (Dell), Corsair Gaming Inc, Mad Catz Global Limited, JBL (Harman International Industries Incorporate), Turtle Beach Corporation, Microsoft Corporation, Nintendo Co Ltd, Koninklijke Philips NV, Cooler Master Co Ltd (CMC), Sennheiser Electronic GmbH & Co KG, AOC Internationa, Razer Inc, Reddragon (Eastern Times Technology Co Ltd), Logitech International SA, Sony Corporation.
3. What are the main segments of the PC Accessories Market?
The market segments include Product.
4. Can you provide details about the market size?
The market size is estimated to be USD 27.58 Million as of 2022.
5. What are some drivers contributing to market growth?
Rising Adoption of Wireless Technologies; Emergence of Technologies Such as AR. VR. and AI; Adoption of Gaming Platforms Such as E-sports.
6. What are the notable trends driving market growth?
Emergence of Technologies such as AR. VR. and AI to Drive the Market.
7. Are there any restraints impacting market growth?
Fluctuation in the Production of Silicon Chips is Leading to a Shortage in the Demand for Gaming Accessories.
8. Can you provide examples of recent developments in the market?
April 2024 - Qualcomm Technologies, Inc. expands the leading Snapdragon X Series platform portfolio with Snapdragon X Plus. Snapdragon X Plus features the advanced Qualcomm Oryon CPU, a custom-integrated processor that delivers up to 37% faster CPU performance than competitors while consuming up to 54% less power.
9. What pricing options are available for accessing the report?
Pricing options include single-user, multi-user, and enterprise licenses priced at USD 4750, USD 5250, and USD 8750 respectively.
10. Is the market size provided in terms of value or volume?
The market size is provided in terms of value, measured in Million and volume, measured in K Unit.
11. Are there any specific market keywords associated with the report?
Yes, the market keyword associated with the report is "PC Accessories Market," which aids in identifying and referencing the specific market segment covered.
12. How do I determine which pricing option suits my needs best?
The pricing options vary based on user requirements and access needs. Individual users may opt for single-user licenses, while businesses requiring broader access may choose multi-user or enterprise licenses for cost-effective access to the report.
13. Are there any additional resources or data provided in the PC Accessories Market report?
While the report offers comprehensive insights, it's advisable to review the specific contents or supplementary materials provided to ascertain if additional resources or data are available.
14. How can I stay updated on further developments or reports in the PC Accessories Market?
To stay informed about further developments, trends, and reports in the PC Accessories Market, consider subscribing to industry newsletters, following relevant companies and organizations, or regularly checking reputable industry news sources and publications.
Methodology
Step 1 - Identification of Relevant Samples Size from Population Database


Step 2 - Approaches for Defining Global Market Size (Value, Volume* & Price*)

Note*: In applicable scenarios
Step 3 - Data Sources
Primary Research
- Web Analytics
- Survey Reports
- Research Institute
- Latest Research Reports
- Opinion Leaders
Secondary Research
- Annual Reports
- White Paper
- Latest Press Release
- Industry Association
- Paid Database
- Investor Presentations

Step 4 - Data Triangulation
Involves using different sources of information in order to increase the validity of a study
These sources are likely to be stakeholders in a program - participants, other researchers, program staff, other community members, and so on.
Then we put all data in single framework & apply various statistical tools to find out the dynamic on the market.
During the analysis stage, feedback from the stakeholder groups would be compared to determine areas of agreement as well as areas of divergence


