
Key Insights
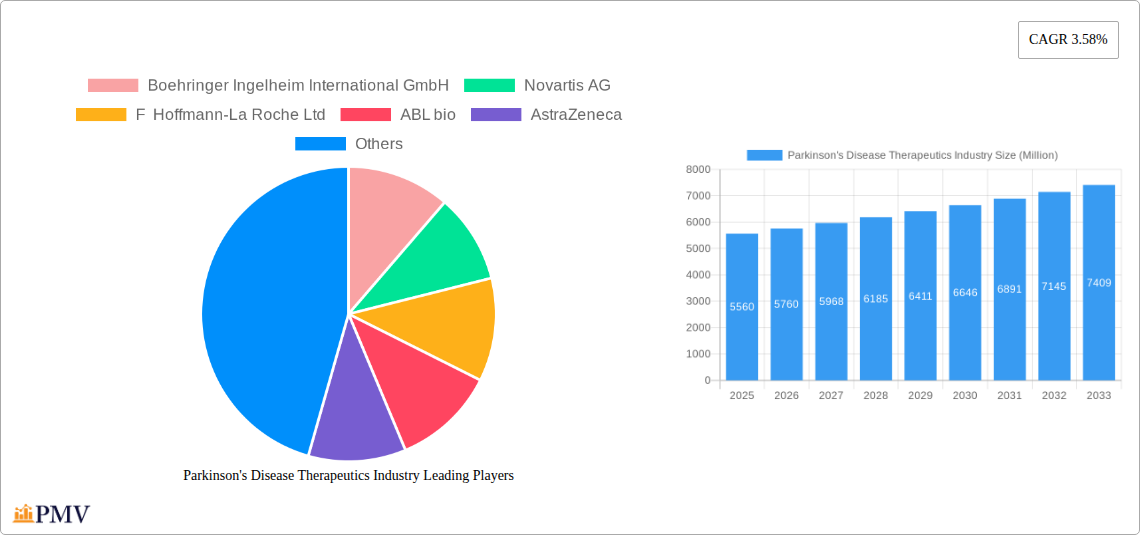
The Parkinson's Disease Therapeutics market, valued at $5.56 billion in 2025, is projected to experience steady growth, driven by a rising geriatric population globally and an increasing prevalence of Parkinson's disease. The market's Compound Annual Growth Rate (CAGR) of 3.58% from 2025 to 2033 indicates a consistent expansion, albeit moderate, reflecting the complex nature of the disease and the ongoing research into more effective therapies. Key growth drivers include the continued development and launch of novel therapeutics targeting various disease mechanisms, improved diagnostic techniques leading to earlier interventions, and a growing awareness among healthcare professionals and patients regarding available treatment options. Market segmentation by mechanism of action reveals the dominance of established treatments like Carbidopa-levodopa, while newer therapies such as dopamine agonists and MAO-B inhibitors are also witnessing significant growth, driven by their potential for improved efficacy and reduced side effects. Competitive forces are strong, with major pharmaceutical companies like Boehringer Ingelheim, Novartis, Roche, and others actively involved in research and development, resulting in a dynamic market landscape characterized by continuous innovation and competition.
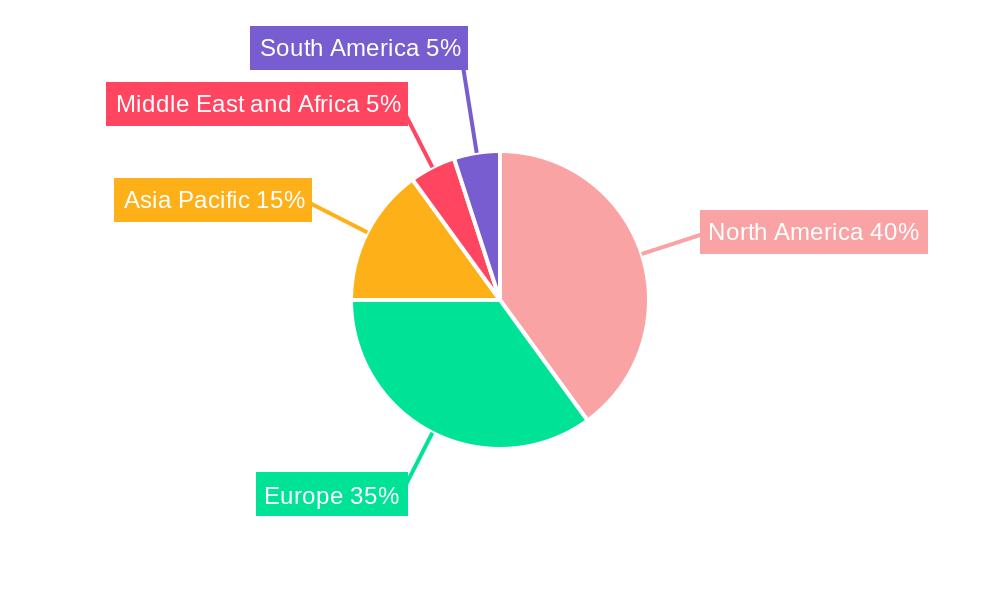
Geographic market analysis indicates that North America and Europe currently hold the largest market shares, owing to higher healthcare expenditure and advanced healthcare infrastructure. However, the Asia Pacific region is expected to exhibit substantial growth over the forecast period driven by increasing awareness, rising disposable incomes, and a growing elderly population. Challenges to market growth include the high cost of treatment, limitations in current therapies, and the significant variability in disease progression among individuals. The need for more effective disease-modifying treatments remains a key focus of ongoing research, presenting opportunities for pharmaceutical companies investing in innovative therapies and technologies. The market is poised for continued expansion, albeit with a steady growth trajectory, as advancements in understanding the disease and new treatment approaches emerge.
Parkinson's Disease Therapeutics Industry: A Comprehensive Market Report (2019-2033)
This detailed report provides a comprehensive analysis of the Parkinson's Disease Therapeutics market, offering invaluable insights for stakeholders across the pharmaceutical and healthcare industries. Covering the period from 2019 to 2033, with a focus on 2025, this report delves into market structure, competitive dynamics, emerging trends, and future growth prospects. The study period is 2019-2033, the base year is 2025, the estimated year is 2025 and the forecast period is 2025-2033. The historical period is 2019-2024.
Parkinson's Disease Therapeutics Industry Market Structure & Competitive Dynamics
The Parkinson's Disease Therapeutics market is characterized by a moderately concentrated landscape with several multinational pharmaceutical giants alongside emerging biotech companies. Market share is heavily influenced by established players like Boehringer Ingelheim International GmbH, Novartis AG, and F Hoffmann-La Roche Ltd, who leverage their extensive research capabilities and global distribution networks. Smaller companies, like ABL Bio and Prevail Therapeutics, contribute significantly through focused innovation and strategic partnerships.
The regulatory landscape plays a crucial role, demanding rigorous clinical trials and approvals. The market is also subject to the development of alternative therapies and changes in reimbursement policies which impacts market access. Furthermore, mergers and acquisitions (M&A) activities are significant, shaping the competitive landscape. Recent deals, though specific values are unavailable (xx Million USD) have involved significant sums. The high cost of research and development drives both acquisitions of promising pipeline assets and collaborative agreements. End-user trends are shifting towards personalized medicine approaches and a greater focus on disease modification rather than just symptomatic relief.
Parkinson's Disease Therapeutics Industry Industry Trends & Insights
The Parkinson's Disease Therapeutics market is experiencing robust growth, driven by increasing prevalence of Parkinson's disease globally, an aging population, and rising healthcare expenditure. The market is witnessing a Compound Annual Growth Rate (CAGR) of xx% during the forecast period (2025-2033). Market penetration of new therapies is gradually increasing, although access remains a challenge in certain regions. Technological advancements, particularly in gene therapy and precision medicine, are transforming the treatment landscape, offering potential for disease-modifying therapies. Consumer preferences increasingly favor less invasive treatment options with fewer side effects. Competitive dynamics are characterized by intense R&D investments, strategic collaborations, and the introduction of novel therapeutic agents.

Dominant Markets & Segments in Parkinson's Disease Therapeutics Industry
The North American and European regions currently dominate the Parkinson's Disease Therapeutics market, driven by higher healthcare spending, strong regulatory frameworks, and well-established healthcare infrastructure. However, Asia Pacific is emerging as a key market, fueled by a burgeoning elderly population and rising disposable incomes.
Within the segments:
Dopamine Agonists: This segment holds a substantial market share due to the established efficacy of these drugs in managing motor symptoms. Growth is anticipated to be consistent, driven by the continued need for effective symptomatic relief.
Carbidopa-levodopa: This remains a cornerstone therapy, and continues to maintain a strong presence despite the emergence of newer treatments.
MAO-B inhibitors, Amantadine, Anticholinergics, COMT Inhibitors, Other Mechanisms of Action: These segments represent smaller but important parts of the market, each with their own specific indications and clinical applications. The "Other Mechanisms of Action" segment is projected to witness the highest growth due to ongoing research efforts and the potential for innovative treatments.
Key Drivers for Regional Dominance:
North America & Europe: Robust healthcare infrastructure, high healthcare spending, stringent regulatory frameworks leading to reliable drug approvals and higher patient access to advanced therapies, well-established research ecosystems facilitating innovation.
Asia Pacific: Rapidly aging population, increasing disposable income, rising awareness of Parkinson's disease, and government initiatives promoting healthcare access.
Parkinson's Disease Therapeutics Industry Product Innovations
Recent product innovations highlight a shift toward disease-modifying therapies that aim to address the underlying causes of Parkinson's disease, rather than solely managing symptoms. This includes advancements in gene therapy, immunotherapy, and precision medicine approaches. The development of therapies with improved safety profiles and better blood-brain barrier penetration are critical factors in the competitive landscape. This trend improves market fit by catering to unmet medical needs and offering better patient outcomes.
Report Segmentation & Scope
This report segments the Parkinson's Disease Therapeutics market primarily by Mechanism of Action: Dopamine Agonists, Anticholinergic, MAO-B inhibitors, Amantadine, Carbidopa-levodopa, COMT Inhibitors, and Other Mechanisms of Action. Each segment's growth is projected based on its current market size, ongoing clinical trials, and projected approval rates. Competitive dynamics are analyzed for each segment, considering the existing players, emerging competitors, and potential for market disruption. Detailed analysis of each segment is beyond the scope of this description, but will be present within the full report.
Key Drivers of Parkinson's Disease Therapeutics Industry Growth
Several factors drive growth in the Parkinson's Disease Therapeutics market. Increasing prevalence of Parkinson's disease due to an aging population is a major factor. Technological advancements, particularly in gene therapy and precision medicine, offer the potential for disease-modifying therapies. Favorable regulatory frameworks and increasing healthcare spending also contribute to market growth. Finally, greater awareness and improved diagnostics contribute to the expansion of the diagnosed population and consequently, market expansion.
Challenges in the Parkinson's Disease Therapeutics Industry Sector
Despite significant advancements, several challenges hinder market growth. High cost of drug development and clinical trials poses a significant barrier for smaller companies. Regulatory hurdles and lengthy approval processes delay market entry for new therapies. Furthermore, competition from existing therapies and the emergence of biosimilars creates pressure on pricing and profitability. Finally, the complexity of Parkinson's disease and the need for personalized treatment strategies pose significant obstacles for successful drug development.
Leading Players in the Parkinson's Disease Therapeutics Industry Market
- Boehringer Ingelheim International GmbH
- Novartis AG
- F Hoffmann-La Roche Ltd
- ABL Bio
- AstraZeneca
- Teva Pharmaceuticals Industries Ltd
- Prevail Therapeutics
- Kissei Pharmaceutical Co Ltd
- Newron Pharmaceuticals SPA
- Viatris
- AbbVie Inc
- GSK plc
- Amneal Pharmaceuticals LLC
- Pfizer Inc
Key Developments in Parkinson's Disease Therapeutics Industry Sector
- March 2022: Neuron23 raised USD 100 Million to advance Parkinson's disease therapy, planning trials for NEU-723 by year-end.
- January 2022: ABL Bio Inc. partnered with Sanofi for worldwide licensing of ABL301, a preclinical bispecific antibody targeting alpha-synuclein and IGF1R.
These developments signal significant investments in innovation and collaborative efforts to expedite the development of novel Parkinson's disease therapeutics.
Strategic Parkinson's Disease Therapeutics Industry Market Outlook
The future of the Parkinson's Disease Therapeutics market is bright, characterized by substantial growth potential driven by increasing prevalence and the emergence of innovative therapies. Strategic opportunities exist in the development of disease-modifying agents, personalized medicine approaches, and advanced delivery systems. Companies focused on early-stage drug discovery and those that establish strong strategic partnerships are well-positioned to capture market share. Continued investment in R&D and a focus on addressing unmet medical needs will be key to long-term success in this rapidly evolving market.
Parkinson's Disease Therapeutics Industry Segmentation
-
1. Mechanism of Action
- 1.1. Dopamine Agonists
- 1.2. Anticholinergic
- 1.3. MAO-B inhibitors
- 1.4. Amantadine
- 1.5. Carbidopa-levodopa
- 1.6. COMT Inhibitors
- 1.7. Other Mechanisms of Action
Parkinson's Disease Therapeutics Industry Segmentation By Geography
-
1. North America
- 1.1. United States
- 1.2. Canada
- 1.3. Mexico
-
2. Europe
- 2.1. Germany
- 2.2. United Kingdom
- 2.3. France
- 2.4. Italy
- 2.5. Spain
- 2.6. Rest of Europe
-
3. Asia Pacific
- 3.1. China
- 3.2. Japan
- 3.3. India
- 3.4. Australia
- 3.5. South Korea
- 3.6. Rest of Asia Pacific
-
4. Middle East and Africa
- 4.1. GCC
- 4.2. South Africa
- 4.3. Rest of Middle East and Africa
-
5. South America
- 5.1. Brazil
- 5.2. Argentina
- 5.3. Rest of South America
Parkinson's Disease Therapeutics Industry REPORT HIGHLIGHTS
| Aspects | Details |
|---|---|
| Study Period | 2019-2033 |
| Base Year | 2024 |
| Estimated Year | 2025 |
| Forecast Period | 2025-2033 |
| Historical Period | 2019-2024 |
| Growth Rate | CAGR of 3.58% from 2019-2033 |
| Segmentation |
|
Table of Contents
- 1. Introduction
- 1.1. Research Scope
- 1.2. Market Segmentation
- 1.3. Research Methodology
- 1.4. Definitions and Assumptions
- 2. Executive Summary
- 2.1. Introduction
- 3. Market Dynamics
- 3.1. Introduction
- 3.2. Market Drivers
- 3.2.1. Rising Geriatric Population and Burden of Parkinson's Disease; Growing Awareness Among the Population; Increasing R&D and Continuous Drug Approvals
- 3.3. Market Restrains
- 3.3.1. Adverse Events Associated with Therapeutics; High Cost of Treatments Followed by Extremely High R&D Expenditure
- 3.4. Market Trends
- 3.4.1. MAO-B inhibitors Segment is Expected to Dominate the Market Over the Forecast Period
- 4. Market Factor Analysis
- 4.1. Porters Five Forces
- 4.2. Supply/Value Chain
- 4.3. PESTEL analysis
- 4.4. Market Entropy
- 4.5. Patent/Trademark Analysis
- 5. Global Parkinson's Disease Therapeutics Industry Analysis, Insights and Forecast, 2019-2031
- 5.1. Market Analysis, Insights and Forecast - by Mechanism of Action
- 5.1.1. Dopamine Agonists
- 5.1.2. Anticholinergic
- 5.1.3. MAO-B inhibitors
- 5.1.4. Amantadine
- 5.1.5. Carbidopa-levodopa
- 5.1.6. COMT Inhibitors
- 5.1.7. Other Mechanisms of Action
- 5.2. Market Analysis, Insights and Forecast - by Region
- 5.2.1. North America
- 5.2.2. Europe
- 5.2.3. Asia Pacific
- 5.2.4. Middle East and Africa
- 5.2.5. South America
- 5.1. Market Analysis, Insights and Forecast - by Mechanism of Action
- 6. North America Parkinson's Disease Therapeutics Industry Analysis, Insights and Forecast, 2019-2031
- 6.1. Market Analysis, Insights and Forecast - by Mechanism of Action
- 6.1.1. Dopamine Agonists
- 6.1.2. Anticholinergic
- 6.1.3. MAO-B inhibitors
- 6.1.4. Amantadine
- 6.1.5. Carbidopa-levodopa
- 6.1.6. COMT Inhibitors
- 6.1.7. Other Mechanisms of Action
- 6.1. Market Analysis, Insights and Forecast - by Mechanism of Action
- 7. Europe Parkinson's Disease Therapeutics Industry Analysis, Insights and Forecast, 2019-2031
- 7.1. Market Analysis, Insights and Forecast - by Mechanism of Action
- 7.1.1. Dopamine Agonists
- 7.1.2. Anticholinergic
- 7.1.3. MAO-B inhibitors
- 7.1.4. Amantadine
- 7.1.5. Carbidopa-levodopa
- 7.1.6. COMT Inhibitors
- 7.1.7. Other Mechanisms of Action
- 7.1. Market Analysis, Insights and Forecast - by Mechanism of Action
- 8. Asia Pacific Parkinson's Disease Therapeutics Industry Analysis, Insights and Forecast, 2019-2031
- 8.1. Market Analysis, Insights and Forecast - by Mechanism of Action
- 8.1.1. Dopamine Agonists
- 8.1.2. Anticholinergic
- 8.1.3. MAO-B inhibitors
- 8.1.4. Amantadine
- 8.1.5. Carbidopa-levodopa
- 8.1.6. COMT Inhibitors
- 8.1.7. Other Mechanisms of Action
- 8.1. Market Analysis, Insights and Forecast - by Mechanism of Action
- 9. Middle East and Africa Parkinson's Disease Therapeutics Industry Analysis, Insights and Forecast, 2019-2031
- 9.1. Market Analysis, Insights and Forecast - by Mechanism of Action
- 9.1.1. Dopamine Agonists
- 9.1.2. Anticholinergic
- 9.1.3. MAO-B inhibitors
- 9.1.4. Amantadine
- 9.1.5. Carbidopa-levodopa
- 9.1.6. COMT Inhibitors
- 9.1.7. Other Mechanisms of Action
- 9.1. Market Analysis, Insights and Forecast - by Mechanism of Action
- 10. South America Parkinson's Disease Therapeutics Industry Analysis, Insights and Forecast, 2019-2031
- 10.1. Market Analysis, Insights and Forecast - by Mechanism of Action
- 10.1.1. Dopamine Agonists
- 10.1.2. Anticholinergic
- 10.1.3. MAO-B inhibitors
- 10.1.4. Amantadine
- 10.1.5. Carbidopa-levodopa
- 10.1.6. COMT Inhibitors
- 10.1.7. Other Mechanisms of Action
- 10.1. Market Analysis, Insights and Forecast - by Mechanism of Action
- 11. North America Parkinson's Disease Therapeutics Industry Analysis, Insights and Forecast, 2019-2031
- 11.1. Market Analysis, Insights and Forecast - By Country/Sub-region
- 11.1.1 United States
- 11.1.2 Canada
- 11.1.3 Mexico
- 12. Europe Parkinson's Disease Therapeutics Industry Analysis, Insights and Forecast, 2019-2031
- 12.1. Market Analysis, Insights and Forecast - By Country/Sub-region
- 12.1.1 Germany
- 12.1.2 United Kingdom
- 12.1.3 France
- 12.1.4 Italy
- 12.1.5 Spain
- 12.1.6 Rest of Europe
- 13. Asia Pacific Parkinson's Disease Therapeutics Industry Analysis, Insights and Forecast, 2019-2031
- 13.1. Market Analysis, Insights and Forecast - By Country/Sub-region
- 13.1.1 China
- 13.1.2 Japan
- 13.1.3 India
- 13.1.4 Australia
- 13.1.5 South Korea
- 13.1.6 Rest of Asia Pacific
- 14. Middle East and Africa Parkinson's Disease Therapeutics Industry Analysis, Insights and Forecast, 2019-2031
- 14.1. Market Analysis, Insights and Forecast - By Country/Sub-region
- 14.1.1 GCC
- 14.1.2 South Africa
- 14.1.3 Rest of Middle East and Africa
- 15. South America Parkinson's Disease Therapeutics Industry Analysis, Insights and Forecast, 2019-2031
- 15.1. Market Analysis, Insights and Forecast - By Country/Sub-region
- 15.1.1 Brazil
- 15.1.2 Argentina
- 15.1.3 Rest of South America
- 16. Competitive Analysis
- 16.1. Global Market Share Analysis 2024
- 16.2. Company Profiles
- 16.2.1 Boehringer Ingelheim International GmbH
- 16.2.1.1. Overview
- 16.2.1.2. Products
- 16.2.1.3. SWOT Analysis
- 16.2.1.4. Recent Developments
- 16.2.1.5. Financials (Based on Availability)
- 16.2.2 Novartis AG
- 16.2.2.1. Overview
- 16.2.2.2. Products
- 16.2.2.3. SWOT Analysis
- 16.2.2.4. Recent Developments
- 16.2.2.5. Financials (Based on Availability)
- 16.2.3 F Hoffmann-La Roche Ltd
- 16.2.3.1. Overview
- 16.2.3.2. Products
- 16.2.3.3. SWOT Analysis
- 16.2.3.4. Recent Developments
- 16.2.3.5. Financials (Based on Availability)
- 16.2.4 ABL bio
- 16.2.4.1. Overview
- 16.2.4.2. Products
- 16.2.4.3. SWOT Analysis
- 16.2.4.4. Recent Developments
- 16.2.4.5. Financials (Based on Availability)
- 16.2.5 AstraZeneca
- 16.2.5.1. Overview
- 16.2.5.2. Products
- 16.2.5.3. SWOT Analysis
- 16.2.5.4. Recent Developments
- 16.2.5.5. Financials (Based on Availability)
- 16.2.6 Teva Pharmaceuticals Industries Ltd
- 16.2.6.1. Overview
- 16.2.6.2. Products
- 16.2.6.3. SWOT Analysis
- 16.2.6.4. Recent Developments
- 16.2.6.5. Financials (Based on Availability)
- 16.2.7 Prevail Therapeutics
- 16.2.7.1. Overview
- 16.2.7.2. Products
- 16.2.7.3. SWOT Analysis
- 16.2.7.4. Recent Developments
- 16.2.7.5. Financials (Based on Availability)
- 16.2.8 Kissei Pharmaceutical Co Ltd
- 16.2.8.1. Overview
- 16.2.8.2. Products
- 16.2.8.3. SWOT Analysis
- 16.2.8.4. Recent Developments
- 16.2.8.5. Financials (Based on Availability)
- 16.2.9 Newron Pharmaceuticals SPA
- 16.2.9.1. Overview
- 16.2.9.2. Products
- 16.2.9.3. SWOT Analysis
- 16.2.9.4. Recent Developments
- 16.2.9.5. Financials (Based on Availability)
- 16.2.10 Viatris
- 16.2.10.1. Overview
- 16.2.10.2. Products
- 16.2.10.3. SWOT Analysis
- 16.2.10.4. Recent Developments
- 16.2.10.5. Financials (Based on Availability)
- 16.2.11 AbbVie Inc
- 16.2.11.1. Overview
- 16.2.11.2. Products
- 16.2.11.3. SWOT Analysis
- 16.2.11.4. Recent Developments
- 16.2.11.5. Financials (Based on Availability)
- 16.2.12 GSK plc
- 16.2.12.1. Overview
- 16.2.12.2. Products
- 16.2.12.3. SWOT Analysis
- 16.2.12.4. Recent Developments
- 16.2.12.5. Financials (Based on Availability)
- 16.2.13 Amneal Pharmaceuticals LLC
- 16.2.13.1. Overview
- 16.2.13.2. Products
- 16.2.13.3. SWOT Analysis
- 16.2.13.4. Recent Developments
- 16.2.13.5. Financials (Based on Availability)
- 16.2.14 Pfizer Inc
- 16.2.14.1. Overview
- 16.2.14.2. Products
- 16.2.14.3. SWOT Analysis
- 16.2.14.4. Recent Developments
- 16.2.14.5. Financials (Based on Availability)
- 16.2.1 Boehringer Ingelheim International GmbH
List of Figures
- Figure 1: Global Parkinson's Disease Therapeutics Industry Revenue Breakdown (Million, %) by Region 2024 & 2032
- Figure 2: Global Parkinson's Disease Therapeutics Industry Volume Breakdown (K Unit, %) by Region 2024 & 2032
- Figure 3: North America Parkinson's Disease Therapeutics Industry Revenue (Million), by Country 2024 & 2032
- Figure 4: North America Parkinson's Disease Therapeutics Industry Volume (K Unit), by Country 2024 & 2032
- Figure 5: North America Parkinson's Disease Therapeutics Industry Revenue Share (%), by Country 2024 & 2032
- Figure 6: North America Parkinson's Disease Therapeutics Industry Volume Share (%), by Country 2024 & 2032
- Figure 7: Europe Parkinson's Disease Therapeutics Industry Revenue (Million), by Country 2024 & 2032
- Figure 8: Europe Parkinson's Disease Therapeutics Industry Volume (K Unit), by Country 2024 & 2032
- Figure 9: Europe Parkinson's Disease Therapeutics Industry Revenue Share (%), by Country 2024 & 2032
- Figure 10: Europe Parkinson's Disease Therapeutics Industry Volume Share (%), by Country 2024 & 2032
- Figure 11: Asia Pacific Parkinson's Disease Therapeutics Industry Revenue (Million), by Country 2024 & 2032
- Figure 12: Asia Pacific Parkinson's Disease Therapeutics Industry Volume (K Unit), by Country 2024 & 2032
- Figure 13: Asia Pacific Parkinson's Disease Therapeutics Industry Revenue Share (%), by Country 2024 & 2032
- Figure 14: Asia Pacific Parkinson's Disease Therapeutics Industry Volume Share (%), by Country 2024 & 2032
- Figure 15: Middle East and Africa Parkinson's Disease Therapeutics Industry Revenue (Million), by Country 2024 & 2032
- Figure 16: Middle East and Africa Parkinson's Disease Therapeutics Industry Volume (K Unit), by Country 2024 & 2032
- Figure 17: Middle East and Africa Parkinson's Disease Therapeutics Industry Revenue Share (%), by Country 2024 & 2032
- Figure 18: Middle East and Africa Parkinson's Disease Therapeutics Industry Volume Share (%), by Country 2024 & 2032
- Figure 19: South America Parkinson's Disease Therapeutics Industry Revenue (Million), by Country 2024 & 2032
- Figure 20: South America Parkinson's Disease Therapeutics Industry Volume (K Unit), by Country 2024 & 2032
- Figure 21: South America Parkinson's Disease Therapeutics Industry Revenue Share (%), by Country 2024 & 2032
- Figure 22: South America Parkinson's Disease Therapeutics Industry Volume Share (%), by Country 2024 & 2032
- Figure 23: North America Parkinson's Disease Therapeutics Industry Revenue (Million), by Mechanism of Action 2024 & 2032
- Figure 24: North America Parkinson's Disease Therapeutics Industry Volume (K Unit), by Mechanism of Action 2024 & 2032
- Figure 25: North America Parkinson's Disease Therapeutics Industry Revenue Share (%), by Mechanism of Action 2024 & 2032
- Figure 26: North America Parkinson's Disease Therapeutics Industry Volume Share (%), by Mechanism of Action 2024 & 2032
- Figure 27: North America Parkinson's Disease Therapeutics Industry Revenue (Million), by Country 2024 & 2032
- Figure 28: North America Parkinson's Disease Therapeutics Industry Volume (K Unit), by Country 2024 & 2032
- Figure 29: North America Parkinson's Disease Therapeutics Industry Revenue Share (%), by Country 2024 & 2032
- Figure 30: North America Parkinson's Disease Therapeutics Industry Volume Share (%), by Country 2024 & 2032
- Figure 31: Europe Parkinson's Disease Therapeutics Industry Revenue (Million), by Mechanism of Action 2024 & 2032
- Figure 32: Europe Parkinson's Disease Therapeutics Industry Volume (K Unit), by Mechanism of Action 2024 & 2032
- Figure 33: Europe Parkinson's Disease Therapeutics Industry Revenue Share (%), by Mechanism of Action 2024 & 2032
- Figure 34: Europe Parkinson's Disease Therapeutics Industry Volume Share (%), by Mechanism of Action 2024 & 2032
- Figure 35: Europe Parkinson's Disease Therapeutics Industry Revenue (Million), by Country 2024 & 2032
- Figure 36: Europe Parkinson's Disease Therapeutics Industry Volume (K Unit), by Country 2024 & 2032
- Figure 37: Europe Parkinson's Disease Therapeutics Industry Revenue Share (%), by Country 2024 & 2032
- Figure 38: Europe Parkinson's Disease Therapeutics Industry Volume Share (%), by Country 2024 & 2032
- Figure 39: Asia Pacific Parkinson's Disease Therapeutics Industry Revenue (Million), by Mechanism of Action 2024 & 2032
- Figure 40: Asia Pacific Parkinson's Disease Therapeutics Industry Volume (K Unit), by Mechanism of Action 2024 & 2032
- Figure 41: Asia Pacific Parkinson's Disease Therapeutics Industry Revenue Share (%), by Mechanism of Action 2024 & 2032
- Figure 42: Asia Pacific Parkinson's Disease Therapeutics Industry Volume Share (%), by Mechanism of Action 2024 & 2032
- Figure 43: Asia Pacific Parkinson's Disease Therapeutics Industry Revenue (Million), by Country 2024 & 2032
- Figure 44: Asia Pacific Parkinson's Disease Therapeutics Industry Volume (K Unit), by Country 2024 & 2032
- Figure 45: Asia Pacific Parkinson's Disease Therapeutics Industry Revenue Share (%), by Country 2024 & 2032
- Figure 46: Asia Pacific Parkinson's Disease Therapeutics Industry Volume Share (%), by Country 2024 & 2032
- Figure 47: Middle East and Africa Parkinson's Disease Therapeutics Industry Revenue (Million), by Mechanism of Action 2024 & 2032
- Figure 48: Middle East and Africa Parkinson's Disease Therapeutics Industry Volume (K Unit), by Mechanism of Action 2024 & 2032
- Figure 49: Middle East and Africa Parkinson's Disease Therapeutics Industry Revenue Share (%), by Mechanism of Action 2024 & 2032
- Figure 50: Middle East and Africa Parkinson's Disease Therapeutics Industry Volume Share (%), by Mechanism of Action 2024 & 2032
- Figure 51: Middle East and Africa Parkinson's Disease Therapeutics Industry Revenue (Million), by Country 2024 & 2032
- Figure 52: Middle East and Africa Parkinson's Disease Therapeutics Industry Volume (K Unit), by Country 2024 & 2032
- Figure 53: Middle East and Africa Parkinson's Disease Therapeutics Industry Revenue Share (%), by Country 2024 & 2032
- Figure 54: Middle East and Africa Parkinson's Disease Therapeutics Industry Volume Share (%), by Country 2024 & 2032
- Figure 55: South America Parkinson's Disease Therapeutics Industry Revenue (Million), by Mechanism of Action 2024 & 2032
- Figure 56: South America Parkinson's Disease Therapeutics Industry Volume (K Unit), by Mechanism of Action 2024 & 2032
- Figure 57: South America Parkinson's Disease Therapeutics Industry Revenue Share (%), by Mechanism of Action 2024 & 2032
- Figure 58: South America Parkinson's Disease Therapeutics Industry Volume Share (%), by Mechanism of Action 2024 & 2032
- Figure 59: South America Parkinson's Disease Therapeutics Industry Revenue (Million), by Country 2024 & 2032
- Figure 60: South America Parkinson's Disease Therapeutics Industry Volume (K Unit), by Country 2024 & 2032
- Figure 61: South America Parkinson's Disease Therapeutics Industry Revenue Share (%), by Country 2024 & 2032
- Figure 62: South America Parkinson's Disease Therapeutics Industry Volume Share (%), by Country 2024 & 2032
List of Tables
- Table 1: Global Parkinson's Disease Therapeutics Industry Revenue Million Forecast, by Region 2019 & 2032
- Table 2: Global Parkinson's Disease Therapeutics Industry Volume K Unit Forecast, by Region 2019 & 2032
- Table 3: Global Parkinson's Disease Therapeutics Industry Revenue Million Forecast, by Mechanism of Action 2019 & 2032
- Table 4: Global Parkinson's Disease Therapeutics Industry Volume K Unit Forecast, by Mechanism of Action 2019 & 2032
- Table 5: Global Parkinson's Disease Therapeutics Industry Revenue Million Forecast, by Region 2019 & 2032
- Table 6: Global Parkinson's Disease Therapeutics Industry Volume K Unit Forecast, by Region 2019 & 2032
- Table 7: Global Parkinson's Disease Therapeutics Industry Revenue Million Forecast, by Country 2019 & 2032
- Table 8: Global Parkinson's Disease Therapeutics Industry Volume K Unit Forecast, by Country 2019 & 2032
- Table 9: United States Parkinson's Disease Therapeutics Industry Revenue (Million) Forecast, by Application 2019 & 2032
- Table 10: United States Parkinson's Disease Therapeutics Industry Volume (K Unit) Forecast, by Application 2019 & 2032
- Table 11: Canada Parkinson's Disease Therapeutics Industry Revenue (Million) Forecast, by Application 2019 & 2032
- Table 12: Canada Parkinson's Disease Therapeutics Industry Volume (K Unit) Forecast, by Application 2019 & 2032
- Table 13: Mexico Parkinson's Disease Therapeutics Industry Revenue (Million) Forecast, by Application 2019 & 2032
- Table 14: Mexico Parkinson's Disease Therapeutics Industry Volume (K Unit) Forecast, by Application 2019 & 2032
- Table 15: Global Parkinson's Disease Therapeutics Industry Revenue Million Forecast, by Country 2019 & 2032
- Table 16: Global Parkinson's Disease Therapeutics Industry Volume K Unit Forecast, by Country 2019 & 2032
- Table 17: Germany Parkinson's Disease Therapeutics Industry Revenue (Million) Forecast, by Application 2019 & 2032
- Table 18: Germany Parkinson's Disease Therapeutics Industry Volume (K Unit) Forecast, by Application 2019 & 2032
- Table 19: United Kingdom Parkinson's Disease Therapeutics Industry Revenue (Million) Forecast, by Application 2019 & 2032
- Table 20: United Kingdom Parkinson's Disease Therapeutics Industry Volume (K Unit) Forecast, by Application 2019 & 2032
- Table 21: France Parkinson's Disease Therapeutics Industry Revenue (Million) Forecast, by Application 2019 & 2032
- Table 22: France Parkinson's Disease Therapeutics Industry Volume (K Unit) Forecast, by Application 2019 & 2032
- Table 23: Italy Parkinson's Disease Therapeutics Industry Revenue (Million) Forecast, by Application 2019 & 2032
- Table 24: Italy Parkinson's Disease Therapeutics Industry Volume (K Unit) Forecast, by Application 2019 & 2032
- Table 25: Spain Parkinson's Disease Therapeutics Industry Revenue (Million) Forecast, by Application 2019 & 2032
- Table 26: Spain Parkinson's Disease Therapeutics Industry Volume (K Unit) Forecast, by Application 2019 & 2032
- Table 27: Rest of Europe Parkinson's Disease Therapeutics Industry Revenue (Million) Forecast, by Application 2019 & 2032
- Table 28: Rest of Europe Parkinson's Disease Therapeutics Industry Volume (K Unit) Forecast, by Application 2019 & 2032
- Table 29: Global Parkinson's Disease Therapeutics Industry Revenue Million Forecast, by Country 2019 & 2032
- Table 30: Global Parkinson's Disease Therapeutics Industry Volume K Unit Forecast, by Country 2019 & 2032
- Table 31: China Parkinson's Disease Therapeutics Industry Revenue (Million) Forecast, by Application 2019 & 2032
- Table 32: China Parkinson's Disease Therapeutics Industry Volume (K Unit) Forecast, by Application 2019 & 2032
- Table 33: Japan Parkinson's Disease Therapeutics Industry Revenue (Million) Forecast, by Application 2019 & 2032
- Table 34: Japan Parkinson's Disease Therapeutics Industry Volume (K Unit) Forecast, by Application 2019 & 2032
- Table 35: India Parkinson's Disease Therapeutics Industry Revenue (Million) Forecast, by Application 2019 & 2032
- Table 36: India Parkinson's Disease Therapeutics Industry Volume (K Unit) Forecast, by Application 2019 & 2032
- Table 37: Australia Parkinson's Disease Therapeutics Industry Revenue (Million) Forecast, by Application 2019 & 2032
- Table 38: Australia Parkinson's Disease Therapeutics Industry Volume (K Unit) Forecast, by Application 2019 & 2032
- Table 39: South Korea Parkinson's Disease Therapeutics Industry Revenue (Million) Forecast, by Application 2019 & 2032
- Table 40: South Korea Parkinson's Disease Therapeutics Industry Volume (K Unit) Forecast, by Application 2019 & 2032
- Table 41: Rest of Asia Pacific Parkinson's Disease Therapeutics Industry Revenue (Million) Forecast, by Application 2019 & 2032
- Table 42: Rest of Asia Pacific Parkinson's Disease Therapeutics Industry Volume (K Unit) Forecast, by Application 2019 & 2032
- Table 43: Global Parkinson's Disease Therapeutics Industry Revenue Million Forecast, by Country 2019 & 2032
- Table 44: Global Parkinson's Disease Therapeutics Industry Volume K Unit Forecast, by Country 2019 & 2032
- Table 45: GCC Parkinson's Disease Therapeutics Industry Revenue (Million) Forecast, by Application 2019 & 2032
- Table 46: GCC Parkinson's Disease Therapeutics Industry Volume (K Unit) Forecast, by Application 2019 & 2032
- Table 47: South Africa Parkinson's Disease Therapeutics Industry Revenue (Million) Forecast, by Application 2019 & 2032
- Table 48: South Africa Parkinson's Disease Therapeutics Industry Volume (K Unit) Forecast, by Application 2019 & 2032
- Table 49: Rest of Middle East and Africa Parkinson's Disease Therapeutics Industry Revenue (Million) Forecast, by Application 2019 & 2032
- Table 50: Rest of Middle East and Africa Parkinson's Disease Therapeutics Industry Volume (K Unit) Forecast, by Application 2019 & 2032
- Table 51: Global Parkinson's Disease Therapeutics Industry Revenue Million Forecast, by Country 2019 & 2032
- Table 52: Global Parkinson's Disease Therapeutics Industry Volume K Unit Forecast, by Country 2019 & 2032
- Table 53: Brazil Parkinson's Disease Therapeutics Industry Revenue (Million) Forecast, by Application 2019 & 2032
- Table 54: Brazil Parkinson's Disease Therapeutics Industry Volume (K Unit) Forecast, by Application 2019 & 2032
- Table 55: Argentina Parkinson's Disease Therapeutics Industry Revenue (Million) Forecast, by Application 2019 & 2032
- Table 56: Argentina Parkinson's Disease Therapeutics Industry Volume (K Unit) Forecast, by Application 2019 & 2032
- Table 57: Rest of South America Parkinson's Disease Therapeutics Industry Revenue (Million) Forecast, by Application 2019 & 2032
- Table 58: Rest of South America Parkinson's Disease Therapeutics Industry Volume (K Unit) Forecast, by Application 2019 & 2032
- Table 59: Global Parkinson's Disease Therapeutics Industry Revenue Million Forecast, by Mechanism of Action 2019 & 2032
- Table 60: Global Parkinson's Disease Therapeutics Industry Volume K Unit Forecast, by Mechanism of Action 2019 & 2032
- Table 61: Global Parkinson's Disease Therapeutics Industry Revenue Million Forecast, by Country 2019 & 2032
- Table 62: Global Parkinson's Disease Therapeutics Industry Volume K Unit Forecast, by Country 2019 & 2032
- Table 63: United States Parkinson's Disease Therapeutics Industry Revenue (Million) Forecast, by Application 2019 & 2032
- Table 64: United States Parkinson's Disease Therapeutics Industry Volume (K Unit) Forecast, by Application 2019 & 2032
- Table 65: Canada Parkinson's Disease Therapeutics Industry Revenue (Million) Forecast, by Application 2019 & 2032
- Table 66: Canada Parkinson's Disease Therapeutics Industry Volume (K Unit) Forecast, by Application 2019 & 2032
- Table 67: Mexico Parkinson's Disease Therapeutics Industry Revenue (Million) Forecast, by Application 2019 & 2032
- Table 68: Mexico Parkinson's Disease Therapeutics Industry Volume (K Unit) Forecast, by Application 2019 & 2032
- Table 69: Global Parkinson's Disease Therapeutics Industry Revenue Million Forecast, by Mechanism of Action 2019 & 2032
- Table 70: Global Parkinson's Disease Therapeutics Industry Volume K Unit Forecast, by Mechanism of Action 2019 & 2032
- Table 71: Global Parkinson's Disease Therapeutics Industry Revenue Million Forecast, by Country 2019 & 2032
- Table 72: Global Parkinson's Disease Therapeutics Industry Volume K Unit Forecast, by Country 2019 & 2032
- Table 73: Germany Parkinson's Disease Therapeutics Industry Revenue (Million) Forecast, by Application 2019 & 2032
- Table 74: Germany Parkinson's Disease Therapeutics Industry Volume (K Unit) Forecast, by Application 2019 & 2032
- Table 75: United Kingdom Parkinson's Disease Therapeutics Industry Revenue (Million) Forecast, by Application 2019 & 2032
- Table 76: United Kingdom Parkinson's Disease Therapeutics Industry Volume (K Unit) Forecast, by Application 2019 & 2032
- Table 77: France Parkinson's Disease Therapeutics Industry Revenue (Million) Forecast, by Application 2019 & 2032
- Table 78: France Parkinson's Disease Therapeutics Industry Volume (K Unit) Forecast, by Application 2019 & 2032
- Table 79: Italy Parkinson's Disease Therapeutics Industry Revenue (Million) Forecast, by Application 2019 & 2032
- Table 80: Italy Parkinson's Disease Therapeutics Industry Volume (K Unit) Forecast, by Application 2019 & 2032
- Table 81: Spain Parkinson's Disease Therapeutics Industry Revenue (Million) Forecast, by Application 2019 & 2032
- Table 82: Spain Parkinson's Disease Therapeutics Industry Volume (K Unit) Forecast, by Application 2019 & 2032
- Table 83: Rest of Europe Parkinson's Disease Therapeutics Industry Revenue (Million) Forecast, by Application 2019 & 2032
- Table 84: Rest of Europe Parkinson's Disease Therapeutics Industry Volume (K Unit) Forecast, by Application 2019 & 2032
- Table 85: Global Parkinson's Disease Therapeutics Industry Revenue Million Forecast, by Mechanism of Action 2019 & 2032
- Table 86: Global Parkinson's Disease Therapeutics Industry Volume K Unit Forecast, by Mechanism of Action 2019 & 2032
- Table 87: Global Parkinson's Disease Therapeutics Industry Revenue Million Forecast, by Country 2019 & 2032
- Table 88: Global Parkinson's Disease Therapeutics Industry Volume K Unit Forecast, by Country 2019 & 2032
- Table 89: China Parkinson's Disease Therapeutics Industry Revenue (Million) Forecast, by Application 2019 & 2032
- Table 90: China Parkinson's Disease Therapeutics Industry Volume (K Unit) Forecast, by Application 2019 & 2032
- Table 91: Japan Parkinson's Disease Therapeutics Industry Revenue (Million) Forecast, by Application 2019 & 2032
- Table 92: Japan Parkinson's Disease Therapeutics Industry Volume (K Unit) Forecast, by Application 2019 & 2032
- Table 93: India Parkinson's Disease Therapeutics Industry Revenue (Million) Forecast, by Application 2019 & 2032
- Table 94: India Parkinson's Disease Therapeutics Industry Volume (K Unit) Forecast, by Application 2019 & 2032
- Table 95: Australia Parkinson's Disease Therapeutics Industry Revenue (Million) Forecast, by Application 2019 & 2032
- Table 96: Australia Parkinson's Disease Therapeutics Industry Volume (K Unit) Forecast, by Application 2019 & 2032
- Table 97: South Korea Parkinson's Disease Therapeutics Industry Revenue (Million) Forecast, by Application 2019 & 2032
- Table 98: South Korea Parkinson's Disease Therapeutics Industry Volume (K Unit) Forecast, by Application 2019 & 2032
- Table 99: Rest of Asia Pacific Parkinson's Disease Therapeutics Industry Revenue (Million) Forecast, by Application 2019 & 2032
- Table 100: Rest of Asia Pacific Parkinson's Disease Therapeutics Industry Volume (K Unit) Forecast, by Application 2019 & 2032
- Table 101: Global Parkinson's Disease Therapeutics Industry Revenue Million Forecast, by Mechanism of Action 2019 & 2032
- Table 102: Global Parkinson's Disease Therapeutics Industry Volume K Unit Forecast, by Mechanism of Action 2019 & 2032
- Table 103: Global Parkinson's Disease Therapeutics Industry Revenue Million Forecast, by Country 2019 & 2032
- Table 104: Global Parkinson's Disease Therapeutics Industry Volume K Unit Forecast, by Country 2019 & 2032
- Table 105: GCC Parkinson's Disease Therapeutics Industry Revenue (Million) Forecast, by Application 2019 & 2032
- Table 106: GCC Parkinson's Disease Therapeutics Industry Volume (K Unit) Forecast, by Application 2019 & 2032
- Table 107: South Africa Parkinson's Disease Therapeutics Industry Revenue (Million) Forecast, by Application 2019 & 2032
- Table 108: South Africa Parkinson's Disease Therapeutics Industry Volume (K Unit) Forecast, by Application 2019 & 2032
- Table 109: Rest of Middle East and Africa Parkinson's Disease Therapeutics Industry Revenue (Million) Forecast, by Application 2019 & 2032
- Table 110: Rest of Middle East and Africa Parkinson's Disease Therapeutics Industry Volume (K Unit) Forecast, by Application 2019 & 2032
- Table 111: Global Parkinson's Disease Therapeutics Industry Revenue Million Forecast, by Mechanism of Action 2019 & 2032
- Table 112: Global Parkinson's Disease Therapeutics Industry Volume K Unit Forecast, by Mechanism of Action 2019 & 2032
- Table 113: Global Parkinson's Disease Therapeutics Industry Revenue Million Forecast, by Country 2019 & 2032
- Table 114: Global Parkinson's Disease Therapeutics Industry Volume K Unit Forecast, by Country 2019 & 2032
- Table 115: Brazil Parkinson's Disease Therapeutics Industry Revenue (Million) Forecast, by Application 2019 & 2032
- Table 116: Brazil Parkinson's Disease Therapeutics Industry Volume (K Unit) Forecast, by Application 2019 & 2032
- Table 117: Argentina Parkinson's Disease Therapeutics Industry Revenue (Million) Forecast, by Application 2019 & 2032
- Table 118: Argentina Parkinson's Disease Therapeutics Industry Volume (K Unit) Forecast, by Application 2019 & 2032
- Table 119: Rest of South America Parkinson's Disease Therapeutics Industry Revenue (Million) Forecast, by Application 2019 & 2032
- Table 120: Rest of South America Parkinson's Disease Therapeutics Industry Volume (K Unit) Forecast, by Application 2019 & 2032
Frequently Asked Questions
1. What is the projected Compound Annual Growth Rate (CAGR) of the Parkinson's Disease Therapeutics Industry?
The projected CAGR is approximately 3.58%.
2. Which companies are prominent players in the Parkinson's Disease Therapeutics Industry?
Key companies in the market include Boehringer Ingelheim International GmbH, Novartis AG, F Hoffmann-La Roche Ltd, ABL bio, AstraZeneca, Teva Pharmaceuticals Industries Ltd, Prevail Therapeutics, Kissei Pharmaceutical Co Ltd, Newron Pharmaceuticals SPA, Viatris, AbbVie Inc, GSK plc, Amneal Pharmaceuticals LLC, Pfizer Inc.
3. What are the main segments of the Parkinson's Disease Therapeutics Industry?
The market segments include Mechanism of Action.
4. Can you provide details about the market size?
The market size is estimated to be USD 5.56 Million as of 2022.
5. What are some drivers contributing to market growth?
Rising Geriatric Population and Burden of Parkinson's Disease; Growing Awareness Among the Population; Increasing R&D and Continuous Drug Approvals.
6. What are the notable trends driving market growth?
MAO-B inhibitors Segment is Expected to Dominate the Market Over the Forecast Period.
7. Are there any restraints impacting market growth?
Adverse Events Associated with Therapeutics; High Cost of Treatments Followed by Extremely High R&D Expenditure.
8. Can you provide examples of recent developments in the market?
In March 2022, Neuron23 raised USD 100 million to advance Parkinson's disease therapy. The company intends to commence the trials of NEU-723 to potentially treat Parkinson's disease by the end of this year.
9. What pricing options are available for accessing the report?
Pricing options include single-user, multi-user, and enterprise licenses priced at USD 4750, USD 5250, and USD 8750 respectively.
10. Is the market size provided in terms of value or volume?
The market size is provided in terms of value, measured in Million and volume, measured in K Unit.
11. Are there any specific market keywords associated with the report?
Yes, the market keyword associated with the report is "Parkinson's Disease Therapeutics Industry," which aids in identifying and referencing the specific market segment covered.
12. How do I determine which pricing option suits my needs best?
The pricing options vary based on user requirements and access needs. Individual users may opt for single-user licenses, while businesses requiring broader access may choose multi-user or enterprise licenses for cost-effective access to the report.
13. Are there any additional resources or data provided in the Parkinson's Disease Therapeutics Industry report?
While the report offers comprehensive insights, it's advisable to review the specific contents or supplementary materials provided to ascertain if additional resources or data are available.
14. How can I stay updated on further developments or reports in the Parkinson's Disease Therapeutics Industry?
To stay informed about further developments, trends, and reports in the Parkinson's Disease Therapeutics Industry, consider subscribing to industry newsletters, following relevant companies and organizations, or regularly checking reputable industry news sources and publications.
Methodology
Step 1 - Identification of Relevant Samples Size from Population Database


Step 2 - Approaches for Defining Global Market Size (Value, Volume* & Price*)

Note*: In applicable scenarios
Step 3 - Data Sources
Primary Research
- Web Analytics
- Survey Reports
- Research Institute
- Latest Research Reports
- Opinion Leaders
Secondary Research
- Annual Reports
- White Paper
- Latest Press Release
- Industry Association
- Paid Database
- Investor Presentations

Step 4 - Data Triangulation
Involves using different sources of information in order to increase the validity of a study
These sources are likely to be stakeholders in a program - participants, other researchers, program staff, other community members, and so on.
Then we put all data in single framework & apply various statistical tools to find out the dynamic on the market.
During the analysis stage, feedback from the stakeholder groups would be compared to determine areas of agreement as well as areas of divergence


