
Key Insights
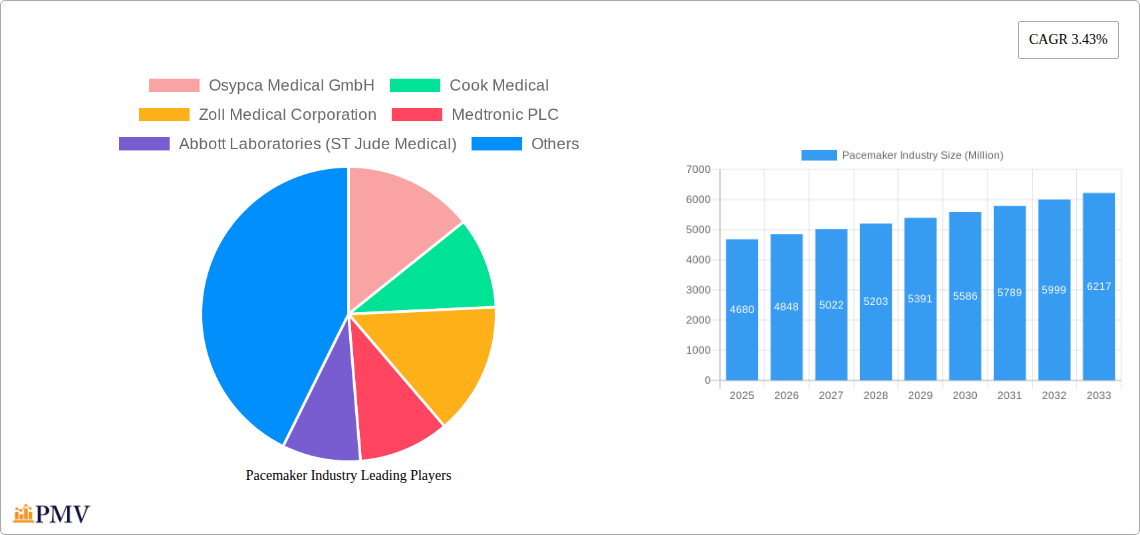
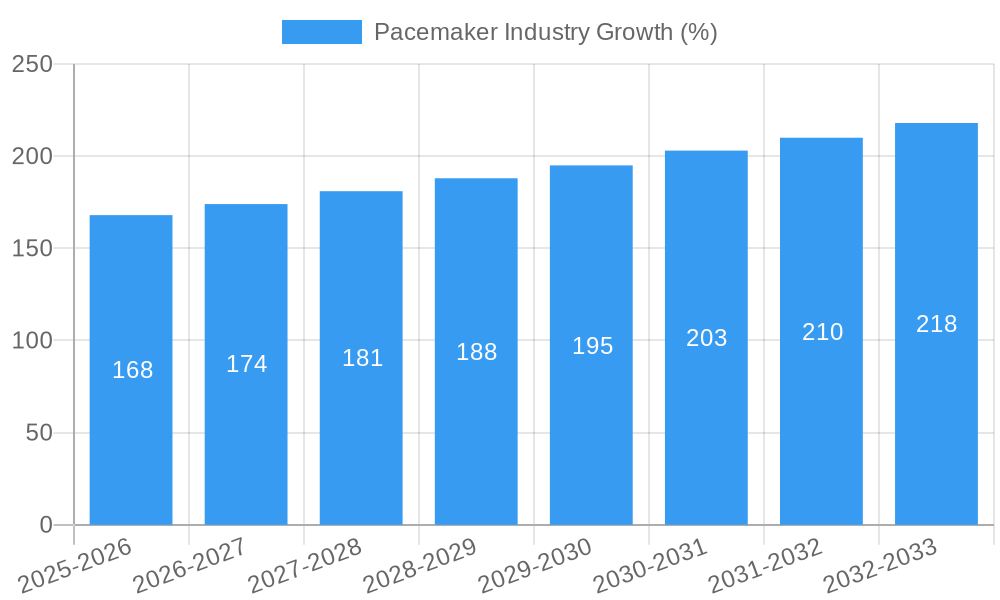
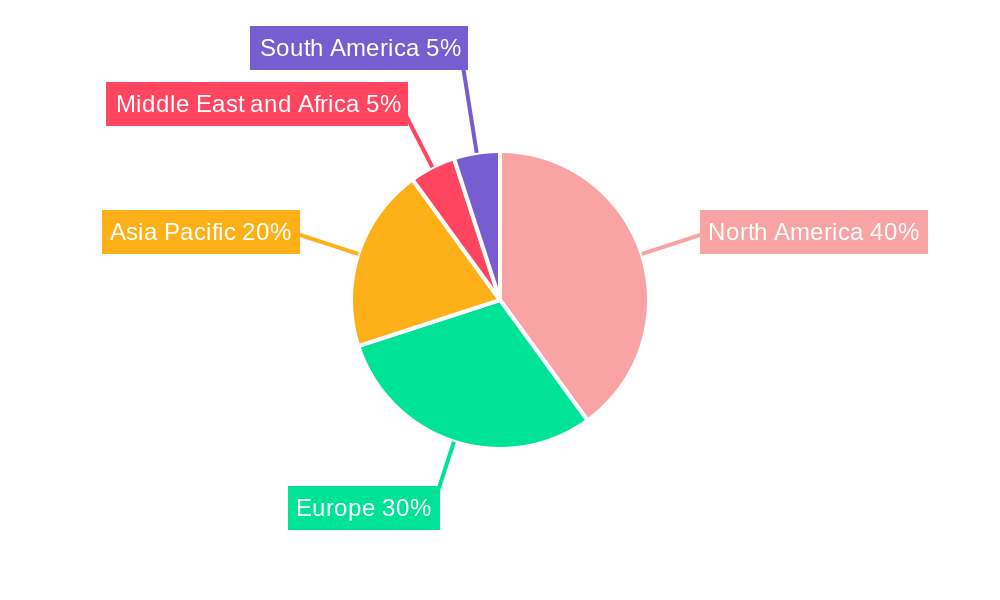
The global pacemaker market, valued at $4.68 billion in 2025, is projected to experience steady growth, driven by an aging global population, increasing prevalence of heart diseases, and advancements in pacemaker technology. The Compound Annual Growth Rate (CAGR) of 3.43% from 2025 to 2033 reflects a consistent, albeit moderate, expansion. Key growth drivers include the rising adoption of implantable pacemakers due to their enhanced longevity and improved patient outcomes compared to external devices. Technological advancements, such as miniaturization, improved battery life, and remote monitoring capabilities, further enhance market appeal. The market segmentation reveals a significant preference towards implantable devices, reflecting a trend towards minimally invasive procedures and improved patient quality of life. Regional variations in market size are expected, with North America and Europe maintaining substantial market share due to higher healthcare expenditure and advanced medical infrastructure. However, the Asia-Pacific region is poised for significant growth, driven by rising healthcare awareness and increasing disposable incomes. Restraints to market growth may include the relatively high cost of pacemakers, especially in developing economies, and the potential for complications associated with implantation.
The competitive landscape is characterized by the presence of several established players, including Medtronic, Abbott Laboratories (St. Jude Medical), Boston Scientific, and Biotronik, who dominate the market through their extensive product portfolios, robust distribution networks, and ongoing research and development efforts. Smaller companies, such as Osypca Medical and Lepu Medical, are also contributing to market innovation with specialized products and technological advancements. Continued innovation, particularly in areas such as leadless pacemakers and advanced diagnostic capabilities, is expected to fuel competition and further drive market expansion. The market is likely to witness increased strategic partnerships and mergers and acquisitions, as companies strive to enhance their market position and broaden their technological expertise. Future growth will depend on the successful introduction of more sophisticated and cost-effective devices, along with increased accessibility in emerging markets.
Pacemaker Industry Market Report: 2019-2033
This comprehensive report provides a detailed analysis of the global pacemaker industry, covering market size, segmentation, competitive landscape, and future growth projections from 2019 to 2033. With a base year of 2025 and an estimated year of 2025, this report offers crucial insights for industry stakeholders, investors, and researchers. The forecast period spans from 2025 to 2033, encompassing the historical period from 2019 to 2024. The market value is projected to reach xx Million by 2033.
Pacemaker Industry Market Structure & Competitive Dynamics
The global pacemaker market is characterized by a moderately concentrated structure, with several key players holding significant market share. The industry is marked by intense competition, driven by technological advancements and a growing demand for innovative pacemaker solutions. Major companies such as Medtronic PLC, Abbott Laboratories (ST Jude Medical), and Boston Scientific Corporation dominate the market, collectively accounting for approximately xx% of the global market share in 2024. Smaller players like Osypca Medical GmbH, Cook Medical, Zoll Medical Corporation, Medico SpA, Oscor Inc, Pacetronix, Lepu Medical Co Ltd, MicroPort Scientific Corporation, Biotronik SE & Co KG, and Sorin Group also contribute significantly.
The industry's innovation ecosystem is robust, with ongoing research and development efforts focused on miniaturization, improved battery life, and advanced sensing capabilities. Regulatory frameworks, particularly those concerning device approval and safety, play a significant role in shaping market dynamics. Product substitutes, such as alternative cardiac therapies, pose a moderate competitive threat. End-user trends, driven by an aging population and increased prevalence of cardiac diseases, are major growth drivers. M&A activity in the sector has been significant in recent years. Notable deals, though specific values remain undisclosed for xx% of them (xx Million in total disclosed value), have involved companies focusing on expanding their product portfolios and technological capabilities, illustrating the consolidation within the pacemaker industry.
Pacemaker Industry Industry Trends & Insights
The global pacemaker market is experiencing substantial growth, driven by several key factors. The aging global population, coupled with the rising prevalence of cardiovascular diseases, is a primary driver of demand. Technological advancements, including the development of miniaturized devices, improved leadless pacemakers, and remote monitoring capabilities, have enhanced the efficacy and convenience of pacemaker therapy. This has resulted in a significant increase in market penetration, especially in developed regions. The compound annual growth rate (CAGR) for the period 2019-2024 is estimated at xx%, while the forecast CAGR for 2025-2033 is projected at xx%.
Consumer preferences are shifting towards minimally invasive procedures and devices with longer battery life, influencing product development and market competition. The competitive landscape remains dynamic, with companies focusing on innovation, strategic partnerships, and acquisitions to gain a competitive edge. Furthermore, increased healthcare spending globally, particularly in emerging economies, contributes significantly to market expansion. The rising adoption of advanced pacing technologies and improved healthcare infrastructure, along with favourable regulatory policies in several regions, further fuels market growth.
Dominant Markets & Segments in Pacemaker Industry
The North American region currently holds the largest market share in the global pacemaker industry, driven by factors such as advanced healthcare infrastructure, high healthcare expenditure, and a high prevalence of cardiovascular diseases. Within this region, the United States is the dominant market.
- Key Drivers for North American Dominance:
- High prevalence of cardiovascular diseases.
- Well-established healthcare infrastructure.
- High healthcare expenditure per capita.
- Favorable regulatory environment for medical device adoption.
- Significant investments in research and development.
In terms of segments, the implantable pacemaker segment dominates the market due to its long-term efficacy and improved patient outcomes compared to external devices. The biventricular pacemaker segment shows promising growth prospects, driven by an increasing number of patients requiring advanced pacing therapies. The demand for advanced features and functionalities is expected to drive market growth.
Pacemaker Industry Product Innovations
Recent innovations in the pacemaker industry include the development of leadless pacemakers, characterized by their smaller size and minimally invasive implantation. These devices offer enhanced patient comfort and reduced risk of complications. Advancements in battery technology are leading to longer device lifespan, reducing the frequency of replacement surgeries. Moreover, integration of remote monitoring capabilities allows for continuous monitoring of device performance and patient health, enabling timely intervention and improved patient care. These innovations are key drivers of market growth, enhancing market fit and creating a competitive advantage for manufacturers.
Report Segmentation & Scope
This report segments the pacemaker market based on type (implantable and external) and application (biventricular). The implantable pacemaker segment is expected to dominate the market throughout the forecast period due to its superior features and long-term benefits. This segment is projected to exhibit a CAGR of xx% during 2025-2033. The external pacemaker segment is expected to have a smaller market share. The biventricular pacemaker segment is anticipated to grow at a CAGR of xx% due to its increasing adoption in patients with complex cardiac conditions. Competitive dynamics within each segment vary, with established players focusing on innovation and expanding their product portfolios.
Key Drivers of Pacemaker Industry Growth
Several factors drive the growth of the pacemaker industry. Technological advancements, such as the development of miniaturized and leadless pacemakers, are improving patient outcomes and driving adoption. Increased healthcare spending, particularly in developing countries, is expanding market access. Furthermore, the rising prevalence of cardiovascular diseases and the aging global population significantly contribute to the increasing demand for pacemakers. Favorable regulatory policies that streamline the approval process for new devices also accelerate market growth.
Challenges in the Pacemaker Industry Sector
The pacemaker industry faces several challenges, including stringent regulatory hurdles for device approvals, potentially leading to delays in product launches. Supply chain disruptions, impacting the availability of critical components, can constrain production and increase costs. Intense competition among established and emerging players necessitates continuous innovation and efficient cost management. Pricing pressures from healthcare payers also pose a significant challenge, limiting profit margins. These factors create quantifiable impacts on market growth, causing variations in sales and investment.
Leading Players in the Pacemaker Industry Market
- Osypca Medical GmbH
- Cook Medical
- Zoll Medical Corporation
- Medtronic PLC
- Abbott Laboratories (ST Jude Medical)
- Medico SpA
- Oscor Inc
- Pacetronix
- Lepu Medical Co Ltd
- MicroPort Scientific Corporation
- Biotronik SE & Co KG
- Boston Scientific Corporation
- Sorin Group
Key Developments in Pacemaker Industry Sector
- June 2021: India Medtronic Private Limited launched Micra AV, a miniaturized, fully self-contained pacemaker. This launch significantly expanded the minimally invasive options available and improved the technology for atrioventricular (AV) block patients.
- January 2021: Boston Scientific Corporation announced its acquisition of Preventice Solutions, a remote cardiac monitoring developer. This acquisition broadened Boston Scientific's capabilities in remote patient monitoring and strengthened its market position.
Strategic Pacemaker Industry Market Outlook
The pacemaker industry presents significant growth potential, driven by continuous technological advancements, increasing prevalence of cardiovascular diseases, and an expanding elderly population. Strategic opportunities exist in developing innovative, minimally invasive devices with enhanced features, focusing on remote monitoring and improved patient outcomes. Expansion into emerging markets with growing healthcare infrastructure and rising disposable incomes presents further opportunities. Companies focusing on strategic partnerships, acquisitions, and robust R&D efforts are poised to capture substantial market share in the coming years.
Pacemaker Industry Segmentation
-
1. Type
-
1.1. Implantable
- 1.1.1. Single Chamber
- 1.1.2. Dual Chamber
- 1.1.3. Biventricular
- 1.2. External
-
1.1. Implantable
Pacemaker Industry Segmentation By Geography
-
1. North America
- 1.1. United States
- 1.2. Canada
- 1.3. Mexico
-
2. Europe
- 2.1. Germany
- 2.2. United Kingdom
- 2.3. France
- 2.4. Italy
- 2.5. Spain
- 2.6. Rest of Europe
-
3. Asia Pacific
- 3.1. China
- 3.2. Japan
- 3.3. India
- 3.4. Australia
- 3.5. South Korea
- 3.6. Rest of Asia Pacific
-
4. Middle East and Africa
- 4.1. GCC
- 4.2. South Africa
- 4.3. Rest of Middle East and Africa
-
5. South America
- 5.1. Brazil
- 5.2. Argentina
- 5.3. Rest of South America
Pacemaker Industry REPORT HIGHLIGHTS
| Aspects | Details |
|---|---|
| Study Period | 2019-2033 |
| Base Year | 2024 |
| Estimated Year | 2025 |
| Forecast Period | 2025-2033 |
| Historical Period | 2019-2024 |
| Growth Rate | CAGR of 3.43% from 2019-2033 |
| Segmentation |
|
Table of Contents
- 1. Introduction
- 1.1. Research Scope
- 1.2. Market Segmentation
- 1.3. Research Methodology
- 1.4. Definitions and Assumptions
- 2. Executive Summary
- 2.1. Introduction
- 3. Market Dynamics
- 3.1. Introduction
- 3.2. Market Drivers
- 3.2.1. Rising Prevalence of Lifestyle-related Disorders; Rapidly Growing Geriatric Population; Advancements in Pacemaker Technology and Minimally Invasive Procedures
- 3.3. Market Restrains
- 3.3.1. High Costs Associated with Application and Maintenance; Cyber Security Risk Associated with Connected Pacemakers
- 3.4. Market Trends
- 3.4.1. Implantable Cardiac Pacemakers Segment Captures the Largest Market Share and is Expected to Grow with a Lucrative Rate
- 4. Market Factor Analysis
- 4.1. Porters Five Forces
- 4.2. Supply/Value Chain
- 4.3. PESTEL analysis
- 4.4. Market Entropy
- 4.5. Patent/Trademark Analysis
- 5. Global Pacemaker Industry Analysis, Insights and Forecast, 2019-2031
- 5.1. Market Analysis, Insights and Forecast - by Type
- 5.1.1. Implantable
- 5.1.1.1. Single Chamber
- 5.1.1.2. Dual Chamber
- 5.1.1.3. Biventricular
- 5.1.2. External
- 5.1.1. Implantable
- 5.2. Market Analysis, Insights and Forecast - by Region
- 5.2.1. North America
- 5.2.2. Europe
- 5.2.3. Asia Pacific
- 5.2.4. Middle East and Africa
- 5.2.5. South America
- 5.1. Market Analysis, Insights and Forecast - by Type
- 6. North America Pacemaker Industry Analysis, Insights and Forecast, 2019-2031
- 6.1. Market Analysis, Insights and Forecast - by Type
- 6.1.1. Implantable
- 6.1.1.1. Single Chamber
- 6.1.1.2. Dual Chamber
- 6.1.1.3. Biventricular
- 6.1.2. External
- 6.1.1. Implantable
- 6.1. Market Analysis, Insights and Forecast - by Type
- 7. Europe Pacemaker Industry Analysis, Insights and Forecast, 2019-2031
- 7.1. Market Analysis, Insights and Forecast - by Type
- 7.1.1. Implantable
- 7.1.1.1. Single Chamber
- 7.1.1.2. Dual Chamber
- 7.1.1.3. Biventricular
- 7.1.2. External
- 7.1.1. Implantable
- 7.1. Market Analysis, Insights and Forecast - by Type
- 8. Asia Pacific Pacemaker Industry Analysis, Insights and Forecast, 2019-2031
- 8.1. Market Analysis, Insights and Forecast - by Type
- 8.1.1. Implantable
- 8.1.1.1. Single Chamber
- 8.1.1.2. Dual Chamber
- 8.1.1.3. Biventricular
- 8.1.2. External
- 8.1.1. Implantable
- 8.1. Market Analysis, Insights and Forecast - by Type
- 9. Middle East and Africa Pacemaker Industry Analysis, Insights and Forecast, 2019-2031
- 9.1. Market Analysis, Insights and Forecast - by Type
- 9.1.1. Implantable
- 9.1.1.1. Single Chamber
- 9.1.1.2. Dual Chamber
- 9.1.1.3. Biventricular
- 9.1.2. External
- 9.1.1. Implantable
- 9.1. Market Analysis, Insights and Forecast - by Type
- 10. South America Pacemaker Industry Analysis, Insights and Forecast, 2019-2031
- 10.1. Market Analysis, Insights and Forecast - by Type
- 10.1.1. Implantable
- 10.1.1.1. Single Chamber
- 10.1.1.2. Dual Chamber
- 10.1.1.3. Biventricular
- 10.1.2. External
- 10.1.1. Implantable
- 10.1. Market Analysis, Insights and Forecast - by Type
- 11. North America Pacemaker Industry Analysis, Insights and Forecast, 2019-2031
- 11.1. Market Analysis, Insights and Forecast - By Country/Sub-region
- 11.1.1 United States
- 11.1.2 Canada
- 11.1.3 Mexico
- 12. Europe Pacemaker Industry Analysis, Insights and Forecast, 2019-2031
- 12.1. Market Analysis, Insights and Forecast - By Country/Sub-region
- 12.1.1 Germany
- 12.1.2 United Kingdom
- 12.1.3 France
- 12.1.4 Italy
- 12.1.5 Spain
- 12.1.6 Rest of Europe
- 13. Asia Pacific Pacemaker Industry Analysis, Insights and Forecast, 2019-2031
- 13.1. Market Analysis, Insights and Forecast - By Country/Sub-region
- 13.1.1 China
- 13.1.2 Japan
- 13.1.3 India
- 13.1.4 Australia
- 13.1.5 South Korea
- 13.1.6 Rest of Asia Pacific
- 14. Middle East and Africa Pacemaker Industry Analysis, Insights and Forecast, 2019-2031
- 14.1. Market Analysis, Insights and Forecast - By Country/Sub-region
- 14.1.1 GCC
- 14.1.2 South Africa
- 14.1.3 Rest of Middle East and Africa
- 15. South America Pacemaker Industry Analysis, Insights and Forecast, 2019-2031
- 15.1. Market Analysis, Insights and Forecast - By Country/Sub-region
- 15.1.1 Brazil
- 15.1.2 Argentina
- 15.1.3 Rest of South America
- 16. Competitive Analysis
- 16.1. Global Market Share Analysis 2024
- 16.2. Company Profiles
- 16.2.1 Osypca Medical GmbH
- 16.2.1.1. Overview
- 16.2.1.2. Products
- 16.2.1.3. SWOT Analysis
- 16.2.1.4. Recent Developments
- 16.2.1.5. Financials (Based on Availability)
- 16.2.2 Cook Medical
- 16.2.2.1. Overview
- 16.2.2.2. Products
- 16.2.2.3. SWOT Analysis
- 16.2.2.4. Recent Developments
- 16.2.2.5. Financials (Based on Availability)
- 16.2.3 Zoll Medical Corporation
- 16.2.3.1. Overview
- 16.2.3.2. Products
- 16.2.3.3. SWOT Analysis
- 16.2.3.4. Recent Developments
- 16.2.3.5. Financials (Based on Availability)
- 16.2.4 Medtronic PLC
- 16.2.4.1. Overview
- 16.2.4.2. Products
- 16.2.4.3. SWOT Analysis
- 16.2.4.4. Recent Developments
- 16.2.4.5. Financials (Based on Availability)
- 16.2.5 Abbott Laboratories (ST Jude Medical)
- 16.2.5.1. Overview
- 16.2.5.2. Products
- 16.2.5.3. SWOT Analysis
- 16.2.5.4. Recent Developments
- 16.2.5.5. Financials (Based on Availability)
- 16.2.6 Medico SpA
- 16.2.6.1. Overview
- 16.2.6.2. Products
- 16.2.6.3. SWOT Analysis
- 16.2.6.4. Recent Developments
- 16.2.6.5. Financials (Based on Availability)
- 16.2.7 Oscor Inc
- 16.2.7.1. Overview
- 16.2.7.2. Products
- 16.2.7.3. SWOT Analysis
- 16.2.7.4. Recent Developments
- 16.2.7.5. Financials (Based on Availability)
- 16.2.8 Pacetronix
- 16.2.8.1. Overview
- 16.2.8.2. Products
- 16.2.8.3. SWOT Analysis
- 16.2.8.4. Recent Developments
- 16.2.8.5. Financials (Based on Availability)
- 16.2.9 Lepu Medical Co Ltd
- 16.2.9.1. Overview
- 16.2.9.2. Products
- 16.2.9.3. SWOT Analysis
- 16.2.9.4. Recent Developments
- 16.2.9.5. Financials (Based on Availability)
- 16.2.10 MicroPort Scientific Corporation
- 16.2.10.1. Overview
- 16.2.10.2. Products
- 16.2.10.3. SWOT Analysis
- 16.2.10.4. Recent Developments
- 16.2.10.5. Financials (Based on Availability)
- 16.2.11 Biotronik SE & Co KG
- 16.2.11.1. Overview
- 16.2.11.2. Products
- 16.2.11.3. SWOT Analysis
- 16.2.11.4. Recent Developments
- 16.2.11.5. Financials (Based on Availability)
- 16.2.12 Boston Scientific Corporation
- 16.2.12.1. Overview
- 16.2.12.2. Products
- 16.2.12.3. SWOT Analysis
- 16.2.12.4. Recent Developments
- 16.2.12.5. Financials (Based on Availability)
- 16.2.13 Sorin Group*List Not Exhaustive
- 16.2.13.1. Overview
- 16.2.13.2. Products
- 16.2.13.3. SWOT Analysis
- 16.2.13.4. Recent Developments
- 16.2.13.5. Financials (Based on Availability)
- 16.2.1 Osypca Medical GmbH
List of Figures
- Figure 1: Global Pacemaker Industry Revenue Breakdown (Million, %) by Region 2024 & 2032
- Figure 2: Global Pacemaker Industry Volume Breakdown (K Units, %) by Region 2024 & 2032
- Figure 3: North America Pacemaker Industry Revenue (Million), by Country 2024 & 2032
- Figure 4: North America Pacemaker Industry Volume (K Units), by Country 2024 & 2032
- Figure 5: North America Pacemaker Industry Revenue Share (%), by Country 2024 & 2032
- Figure 6: North America Pacemaker Industry Volume Share (%), by Country 2024 & 2032
- Figure 7: Europe Pacemaker Industry Revenue (Million), by Country 2024 & 2032
- Figure 8: Europe Pacemaker Industry Volume (K Units), by Country 2024 & 2032
- Figure 9: Europe Pacemaker Industry Revenue Share (%), by Country 2024 & 2032
- Figure 10: Europe Pacemaker Industry Volume Share (%), by Country 2024 & 2032
- Figure 11: Asia Pacific Pacemaker Industry Revenue (Million), by Country 2024 & 2032
- Figure 12: Asia Pacific Pacemaker Industry Volume (K Units), by Country 2024 & 2032
- Figure 13: Asia Pacific Pacemaker Industry Revenue Share (%), by Country 2024 & 2032
- Figure 14: Asia Pacific Pacemaker Industry Volume Share (%), by Country 2024 & 2032
- Figure 15: Middle East and Africa Pacemaker Industry Revenue (Million), by Country 2024 & 2032
- Figure 16: Middle East and Africa Pacemaker Industry Volume (K Units), by Country 2024 & 2032
- Figure 17: Middle East and Africa Pacemaker Industry Revenue Share (%), by Country 2024 & 2032
- Figure 18: Middle East and Africa Pacemaker Industry Volume Share (%), by Country 2024 & 2032
- Figure 19: South America Pacemaker Industry Revenue (Million), by Country 2024 & 2032
- Figure 20: South America Pacemaker Industry Volume (K Units), by Country 2024 & 2032
- Figure 21: South America Pacemaker Industry Revenue Share (%), by Country 2024 & 2032
- Figure 22: South America Pacemaker Industry Volume Share (%), by Country 2024 & 2032
- Figure 23: North America Pacemaker Industry Revenue (Million), by Type 2024 & 2032
- Figure 24: North America Pacemaker Industry Volume (K Units), by Type 2024 & 2032
- Figure 25: North America Pacemaker Industry Revenue Share (%), by Type 2024 & 2032
- Figure 26: North America Pacemaker Industry Volume Share (%), by Type 2024 & 2032
- Figure 27: North America Pacemaker Industry Revenue (Million), by Country 2024 & 2032
- Figure 28: North America Pacemaker Industry Volume (K Units), by Country 2024 & 2032
- Figure 29: North America Pacemaker Industry Revenue Share (%), by Country 2024 & 2032
- Figure 30: North America Pacemaker Industry Volume Share (%), by Country 2024 & 2032
- Figure 31: Europe Pacemaker Industry Revenue (Million), by Type 2024 & 2032
- Figure 32: Europe Pacemaker Industry Volume (K Units), by Type 2024 & 2032
- Figure 33: Europe Pacemaker Industry Revenue Share (%), by Type 2024 & 2032
- Figure 34: Europe Pacemaker Industry Volume Share (%), by Type 2024 & 2032
- Figure 35: Europe Pacemaker Industry Revenue (Million), by Country 2024 & 2032
- Figure 36: Europe Pacemaker Industry Volume (K Units), by Country 2024 & 2032
- Figure 37: Europe Pacemaker Industry Revenue Share (%), by Country 2024 & 2032
- Figure 38: Europe Pacemaker Industry Volume Share (%), by Country 2024 & 2032
- Figure 39: Asia Pacific Pacemaker Industry Revenue (Million), by Type 2024 & 2032
- Figure 40: Asia Pacific Pacemaker Industry Volume (K Units), by Type 2024 & 2032
- Figure 41: Asia Pacific Pacemaker Industry Revenue Share (%), by Type 2024 & 2032
- Figure 42: Asia Pacific Pacemaker Industry Volume Share (%), by Type 2024 & 2032
- Figure 43: Asia Pacific Pacemaker Industry Revenue (Million), by Country 2024 & 2032
- Figure 44: Asia Pacific Pacemaker Industry Volume (K Units), by Country 2024 & 2032
- Figure 45: Asia Pacific Pacemaker Industry Revenue Share (%), by Country 2024 & 2032
- Figure 46: Asia Pacific Pacemaker Industry Volume Share (%), by Country 2024 & 2032
- Figure 47: Middle East and Africa Pacemaker Industry Revenue (Million), by Type 2024 & 2032
- Figure 48: Middle East and Africa Pacemaker Industry Volume (K Units), by Type 2024 & 2032
- Figure 49: Middle East and Africa Pacemaker Industry Revenue Share (%), by Type 2024 & 2032
- Figure 50: Middle East and Africa Pacemaker Industry Volume Share (%), by Type 2024 & 2032
- Figure 51: Middle East and Africa Pacemaker Industry Revenue (Million), by Country 2024 & 2032
- Figure 52: Middle East and Africa Pacemaker Industry Volume (K Units), by Country 2024 & 2032
- Figure 53: Middle East and Africa Pacemaker Industry Revenue Share (%), by Country 2024 & 2032
- Figure 54: Middle East and Africa Pacemaker Industry Volume Share (%), by Country 2024 & 2032
- Figure 55: South America Pacemaker Industry Revenue (Million), by Type 2024 & 2032
- Figure 56: South America Pacemaker Industry Volume (K Units), by Type 2024 & 2032
- Figure 57: South America Pacemaker Industry Revenue Share (%), by Type 2024 & 2032
- Figure 58: South America Pacemaker Industry Volume Share (%), by Type 2024 & 2032
- Figure 59: South America Pacemaker Industry Revenue (Million), by Country 2024 & 2032
- Figure 60: South America Pacemaker Industry Volume (K Units), by Country 2024 & 2032
- Figure 61: South America Pacemaker Industry Revenue Share (%), by Country 2024 & 2032
- Figure 62: South America Pacemaker Industry Volume Share (%), by Country 2024 & 2032
List of Tables
- Table 1: Global Pacemaker Industry Revenue Million Forecast, by Region 2019 & 2032
- Table 2: Global Pacemaker Industry Volume K Units Forecast, by Region 2019 & 2032
- Table 3: Global Pacemaker Industry Revenue Million Forecast, by Type 2019 & 2032
- Table 4: Global Pacemaker Industry Volume K Units Forecast, by Type 2019 & 2032
- Table 5: Global Pacemaker Industry Revenue Million Forecast, by Region 2019 & 2032
- Table 6: Global Pacemaker Industry Volume K Units Forecast, by Region 2019 & 2032
- Table 7: Global Pacemaker Industry Revenue Million Forecast, by Country 2019 & 2032
- Table 8: Global Pacemaker Industry Volume K Units Forecast, by Country 2019 & 2032
- Table 9: United States Pacemaker Industry Revenue (Million) Forecast, by Application 2019 & 2032
- Table 10: United States Pacemaker Industry Volume (K Units) Forecast, by Application 2019 & 2032
- Table 11: Canada Pacemaker Industry Revenue (Million) Forecast, by Application 2019 & 2032
- Table 12: Canada Pacemaker Industry Volume (K Units) Forecast, by Application 2019 & 2032
- Table 13: Mexico Pacemaker Industry Revenue (Million) Forecast, by Application 2019 & 2032
- Table 14: Mexico Pacemaker Industry Volume (K Units) Forecast, by Application 2019 & 2032
- Table 15: Global Pacemaker Industry Revenue Million Forecast, by Country 2019 & 2032
- Table 16: Global Pacemaker Industry Volume K Units Forecast, by Country 2019 & 2032
- Table 17: Germany Pacemaker Industry Revenue (Million) Forecast, by Application 2019 & 2032
- Table 18: Germany Pacemaker Industry Volume (K Units) Forecast, by Application 2019 & 2032
- Table 19: United Kingdom Pacemaker Industry Revenue (Million) Forecast, by Application 2019 & 2032
- Table 20: United Kingdom Pacemaker Industry Volume (K Units) Forecast, by Application 2019 & 2032
- Table 21: France Pacemaker Industry Revenue (Million) Forecast, by Application 2019 & 2032
- Table 22: France Pacemaker Industry Volume (K Units) Forecast, by Application 2019 & 2032
- Table 23: Italy Pacemaker Industry Revenue (Million) Forecast, by Application 2019 & 2032
- Table 24: Italy Pacemaker Industry Volume (K Units) Forecast, by Application 2019 & 2032
- Table 25: Spain Pacemaker Industry Revenue (Million) Forecast, by Application 2019 & 2032
- Table 26: Spain Pacemaker Industry Volume (K Units) Forecast, by Application 2019 & 2032
- Table 27: Rest of Europe Pacemaker Industry Revenue (Million) Forecast, by Application 2019 & 2032
- Table 28: Rest of Europe Pacemaker Industry Volume (K Units) Forecast, by Application 2019 & 2032
- Table 29: Global Pacemaker Industry Revenue Million Forecast, by Country 2019 & 2032
- Table 30: Global Pacemaker Industry Volume K Units Forecast, by Country 2019 & 2032
- Table 31: China Pacemaker Industry Revenue (Million) Forecast, by Application 2019 & 2032
- Table 32: China Pacemaker Industry Volume (K Units) Forecast, by Application 2019 & 2032
- Table 33: Japan Pacemaker Industry Revenue (Million) Forecast, by Application 2019 & 2032
- Table 34: Japan Pacemaker Industry Volume (K Units) Forecast, by Application 2019 & 2032
- Table 35: India Pacemaker Industry Revenue (Million) Forecast, by Application 2019 & 2032
- Table 36: India Pacemaker Industry Volume (K Units) Forecast, by Application 2019 & 2032
- Table 37: Australia Pacemaker Industry Revenue (Million) Forecast, by Application 2019 & 2032
- Table 38: Australia Pacemaker Industry Volume (K Units) Forecast, by Application 2019 & 2032
- Table 39: South Korea Pacemaker Industry Revenue (Million) Forecast, by Application 2019 & 2032
- Table 40: South Korea Pacemaker Industry Volume (K Units) Forecast, by Application 2019 & 2032
- Table 41: Rest of Asia Pacific Pacemaker Industry Revenue (Million) Forecast, by Application 2019 & 2032
- Table 42: Rest of Asia Pacific Pacemaker Industry Volume (K Units) Forecast, by Application 2019 & 2032
- Table 43: Global Pacemaker Industry Revenue Million Forecast, by Country 2019 & 2032
- Table 44: Global Pacemaker Industry Volume K Units Forecast, by Country 2019 & 2032
- Table 45: GCC Pacemaker Industry Revenue (Million) Forecast, by Application 2019 & 2032
- Table 46: GCC Pacemaker Industry Volume (K Units) Forecast, by Application 2019 & 2032
- Table 47: South Africa Pacemaker Industry Revenue (Million) Forecast, by Application 2019 & 2032
- Table 48: South Africa Pacemaker Industry Volume (K Units) Forecast, by Application 2019 & 2032
- Table 49: Rest of Middle East and Africa Pacemaker Industry Revenue (Million) Forecast, by Application 2019 & 2032
- Table 50: Rest of Middle East and Africa Pacemaker Industry Volume (K Units) Forecast, by Application 2019 & 2032
- Table 51: Global Pacemaker Industry Revenue Million Forecast, by Country 2019 & 2032
- Table 52: Global Pacemaker Industry Volume K Units Forecast, by Country 2019 & 2032
- Table 53: Brazil Pacemaker Industry Revenue (Million) Forecast, by Application 2019 & 2032
- Table 54: Brazil Pacemaker Industry Volume (K Units) Forecast, by Application 2019 & 2032
- Table 55: Argentina Pacemaker Industry Revenue (Million) Forecast, by Application 2019 & 2032
- Table 56: Argentina Pacemaker Industry Volume (K Units) Forecast, by Application 2019 & 2032
- Table 57: Rest of South America Pacemaker Industry Revenue (Million) Forecast, by Application 2019 & 2032
- Table 58: Rest of South America Pacemaker Industry Volume (K Units) Forecast, by Application 2019 & 2032
- Table 59: Global Pacemaker Industry Revenue Million Forecast, by Type 2019 & 2032
- Table 60: Global Pacemaker Industry Volume K Units Forecast, by Type 2019 & 2032
- Table 61: Global Pacemaker Industry Revenue Million Forecast, by Country 2019 & 2032
- Table 62: Global Pacemaker Industry Volume K Units Forecast, by Country 2019 & 2032
- Table 63: United States Pacemaker Industry Revenue (Million) Forecast, by Application 2019 & 2032
- Table 64: United States Pacemaker Industry Volume (K Units) Forecast, by Application 2019 & 2032
- Table 65: Canada Pacemaker Industry Revenue (Million) Forecast, by Application 2019 & 2032
- Table 66: Canada Pacemaker Industry Volume (K Units) Forecast, by Application 2019 & 2032
- Table 67: Mexico Pacemaker Industry Revenue (Million) Forecast, by Application 2019 & 2032
- Table 68: Mexico Pacemaker Industry Volume (K Units) Forecast, by Application 2019 & 2032
- Table 69: Global Pacemaker Industry Revenue Million Forecast, by Type 2019 & 2032
- Table 70: Global Pacemaker Industry Volume K Units Forecast, by Type 2019 & 2032
- Table 71: Global Pacemaker Industry Revenue Million Forecast, by Country 2019 & 2032
- Table 72: Global Pacemaker Industry Volume K Units Forecast, by Country 2019 & 2032
- Table 73: Germany Pacemaker Industry Revenue (Million) Forecast, by Application 2019 & 2032
- Table 74: Germany Pacemaker Industry Volume (K Units) Forecast, by Application 2019 & 2032
- Table 75: United Kingdom Pacemaker Industry Revenue (Million) Forecast, by Application 2019 & 2032
- Table 76: United Kingdom Pacemaker Industry Volume (K Units) Forecast, by Application 2019 & 2032
- Table 77: France Pacemaker Industry Revenue (Million) Forecast, by Application 2019 & 2032
- Table 78: France Pacemaker Industry Volume (K Units) Forecast, by Application 2019 & 2032
- Table 79: Italy Pacemaker Industry Revenue (Million) Forecast, by Application 2019 & 2032
- Table 80: Italy Pacemaker Industry Volume (K Units) Forecast, by Application 2019 & 2032
- Table 81: Spain Pacemaker Industry Revenue (Million) Forecast, by Application 2019 & 2032
- Table 82: Spain Pacemaker Industry Volume (K Units) Forecast, by Application 2019 & 2032
- Table 83: Rest of Europe Pacemaker Industry Revenue (Million) Forecast, by Application 2019 & 2032
- Table 84: Rest of Europe Pacemaker Industry Volume (K Units) Forecast, by Application 2019 & 2032
- Table 85: Global Pacemaker Industry Revenue Million Forecast, by Type 2019 & 2032
- Table 86: Global Pacemaker Industry Volume K Units Forecast, by Type 2019 & 2032
- Table 87: Global Pacemaker Industry Revenue Million Forecast, by Country 2019 & 2032
- Table 88: Global Pacemaker Industry Volume K Units Forecast, by Country 2019 & 2032
- Table 89: China Pacemaker Industry Revenue (Million) Forecast, by Application 2019 & 2032
- Table 90: China Pacemaker Industry Volume (K Units) Forecast, by Application 2019 & 2032
- Table 91: Japan Pacemaker Industry Revenue (Million) Forecast, by Application 2019 & 2032
- Table 92: Japan Pacemaker Industry Volume (K Units) Forecast, by Application 2019 & 2032
- Table 93: India Pacemaker Industry Revenue (Million) Forecast, by Application 2019 & 2032
- Table 94: India Pacemaker Industry Volume (K Units) Forecast, by Application 2019 & 2032
- Table 95: Australia Pacemaker Industry Revenue (Million) Forecast, by Application 2019 & 2032
- Table 96: Australia Pacemaker Industry Volume (K Units) Forecast, by Application 2019 & 2032
- Table 97: South Korea Pacemaker Industry Revenue (Million) Forecast, by Application 2019 & 2032
- Table 98: South Korea Pacemaker Industry Volume (K Units) Forecast, by Application 2019 & 2032
- Table 99: Rest of Asia Pacific Pacemaker Industry Revenue (Million) Forecast, by Application 2019 & 2032
- Table 100: Rest of Asia Pacific Pacemaker Industry Volume (K Units) Forecast, by Application 2019 & 2032
- Table 101: Global Pacemaker Industry Revenue Million Forecast, by Type 2019 & 2032
- Table 102: Global Pacemaker Industry Volume K Units Forecast, by Type 2019 & 2032
- Table 103: Global Pacemaker Industry Revenue Million Forecast, by Country 2019 & 2032
- Table 104: Global Pacemaker Industry Volume K Units Forecast, by Country 2019 & 2032
- Table 105: GCC Pacemaker Industry Revenue (Million) Forecast, by Application 2019 & 2032
- Table 106: GCC Pacemaker Industry Volume (K Units) Forecast, by Application 2019 & 2032
- Table 107: South Africa Pacemaker Industry Revenue (Million) Forecast, by Application 2019 & 2032
- Table 108: South Africa Pacemaker Industry Volume (K Units) Forecast, by Application 2019 & 2032
- Table 109: Rest of Middle East and Africa Pacemaker Industry Revenue (Million) Forecast, by Application 2019 & 2032
- Table 110: Rest of Middle East and Africa Pacemaker Industry Volume (K Units) Forecast, by Application 2019 & 2032
- Table 111: Global Pacemaker Industry Revenue Million Forecast, by Type 2019 & 2032
- Table 112: Global Pacemaker Industry Volume K Units Forecast, by Type 2019 & 2032
- Table 113: Global Pacemaker Industry Revenue Million Forecast, by Country 2019 & 2032
- Table 114: Global Pacemaker Industry Volume K Units Forecast, by Country 2019 & 2032
- Table 115: Brazil Pacemaker Industry Revenue (Million) Forecast, by Application 2019 & 2032
- Table 116: Brazil Pacemaker Industry Volume (K Units) Forecast, by Application 2019 & 2032
- Table 117: Argentina Pacemaker Industry Revenue (Million) Forecast, by Application 2019 & 2032
- Table 118: Argentina Pacemaker Industry Volume (K Units) Forecast, by Application 2019 & 2032
- Table 119: Rest of South America Pacemaker Industry Revenue (Million) Forecast, by Application 2019 & 2032
- Table 120: Rest of South America Pacemaker Industry Volume (K Units) Forecast, by Application 2019 & 2032
Frequently Asked Questions
1. What is the projected Compound Annual Growth Rate (CAGR) of the Pacemaker Industry?
The projected CAGR is approximately 3.43%.
2. Which companies are prominent players in the Pacemaker Industry?
Key companies in the market include Osypca Medical GmbH, Cook Medical, Zoll Medical Corporation, Medtronic PLC, Abbott Laboratories (ST Jude Medical), Medico SpA, Oscor Inc, Pacetronix, Lepu Medical Co Ltd, MicroPort Scientific Corporation, Biotronik SE & Co KG, Boston Scientific Corporation, Sorin Group*List Not Exhaustive.
3. What are the main segments of the Pacemaker Industry?
The market segments include Type.
4. Can you provide details about the market size?
The market size is estimated to be USD 4.68 Million as of 2022.
5. What are some drivers contributing to market growth?
Rising Prevalence of Lifestyle-related Disorders; Rapidly Growing Geriatric Population; Advancements in Pacemaker Technology and Minimally Invasive Procedures.
6. What are the notable trends driving market growth?
Implantable Cardiac Pacemakers Segment Captures the Largest Market Share and is Expected to Grow with a Lucrative Rate.
7. Are there any restraints impacting market growth?
High Costs Associated with Application and Maintenance; Cyber Security Risk Associated with Connected Pacemakers.
8. Can you provide examples of recent developments in the market?
In June 2021, India Medtronic Private Limited launched Micra AV, a miniaturized, fully self-contained pacemaker that delivers advanced pacing technology to atrioventricular (AV) block patients via a minimally invasive approach. The device is the first pacemaker that can sense atrial activity without a lead or device in the upper chamber of the heart
9. What pricing options are available for accessing the report?
Pricing options include single-user, multi-user, and enterprise licenses priced at USD 4750, USD 5250, and USD 8750 respectively.
10. Is the market size provided in terms of value or volume?
The market size is provided in terms of value, measured in Million and volume, measured in K Units.
11. Are there any specific market keywords associated with the report?
Yes, the market keyword associated with the report is "Pacemaker Industry," which aids in identifying and referencing the specific market segment covered.
12. How do I determine which pricing option suits my needs best?
The pricing options vary based on user requirements and access needs. Individual users may opt for single-user licenses, while businesses requiring broader access may choose multi-user or enterprise licenses for cost-effective access to the report.
13. Are there any additional resources or data provided in the Pacemaker Industry report?
While the report offers comprehensive insights, it's advisable to review the specific contents or supplementary materials provided to ascertain if additional resources or data are available.
14. How can I stay updated on further developments or reports in the Pacemaker Industry?
To stay informed about further developments, trends, and reports in the Pacemaker Industry, consider subscribing to industry newsletters, following relevant companies and organizations, or regularly checking reputable industry news sources and publications.
Methodology
Step 1 - Identification of Relevant Samples Size from Population Database


Step 2 - Approaches for Defining Global Market Size (Value, Volume* & Price*)

Note*: In applicable scenarios
Step 3 - Data Sources
Primary Research
- Web Analytics
- Survey Reports
- Research Institute
- Latest Research Reports
- Opinion Leaders
Secondary Research
- Annual Reports
- White Paper
- Latest Press Release
- Industry Association
- Paid Database
- Investor Presentations

Step 4 - Data Triangulation
Involves using different sources of information in order to increase the validity of a study
These sources are likely to be stakeholders in a program - participants, other researchers, program staff, other community members, and so on.
Then we put all data in single framework & apply various statistical tools to find out the dynamic on the market.
During the analysis stage, feedback from the stakeholder groups would be compared to determine areas of agreement as well as areas of divergence


