
Key Insights
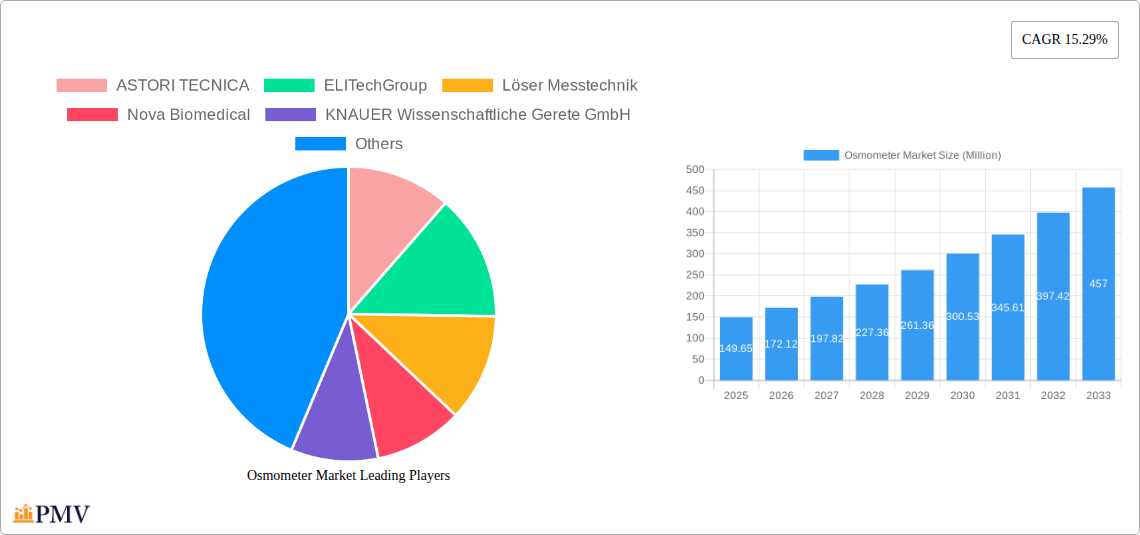
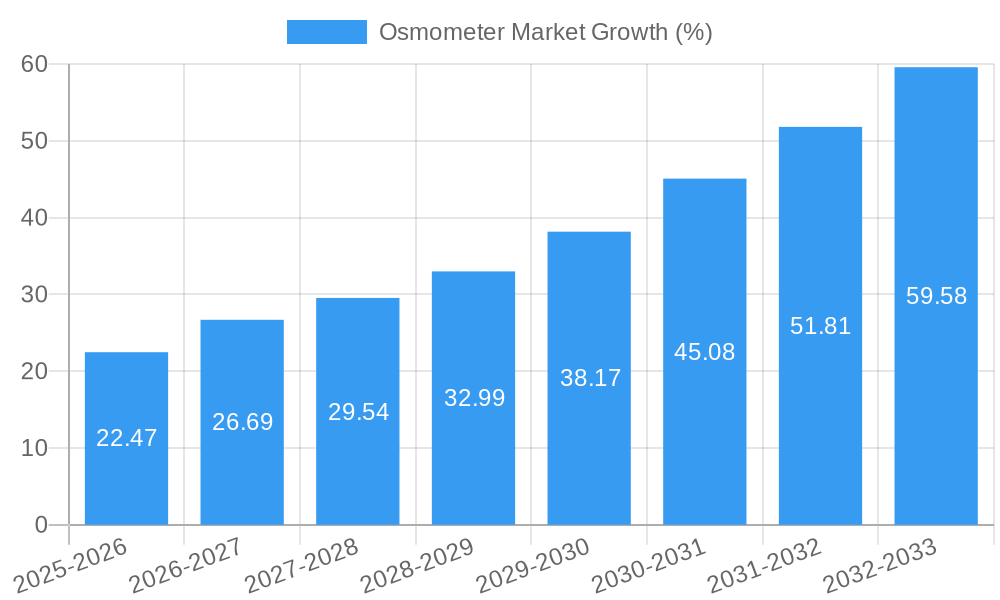
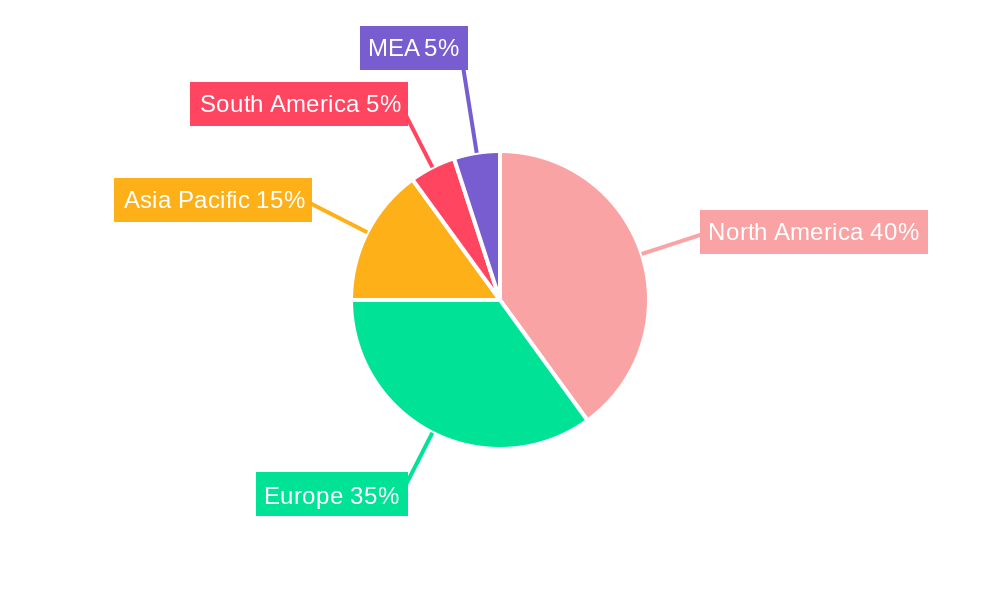
The global osmometer market, valued at $149.65 million in 2025, is projected to experience robust growth, driven by a compound annual growth rate (CAGR) of 15.29% from 2025 to 2033. This expansion is fueled by several key factors. The increasing prevalence of chronic diseases requiring precise fluid and electrolyte monitoring is a major driver, particularly in clinical settings. Furthermore, advancements in osmometer technology, such as the development of more portable and user-friendly devices, are making them more accessible and convenient for various applications. The pharmaceutical and biotechnology industries are also significant contributors to market growth, relying on osmometers for quality control and research purposes in drug development and production. Growth is further stimulated by the rising demand for accurate and rapid diagnostic tools in hospitals and laboratories globally. The market segmentation reveals a strong demand for multi-sample osmometers, reflecting the need for efficient high-throughput testing in busy clinical and research environments. Geographical analysis suggests that North America and Europe currently hold the largest market share due to established healthcare infrastructure and high adoption rates. However, the Asia-Pacific region is anticipated to witness significant growth in the coming years, driven by rising healthcare expenditure and increasing awareness of the importance of accurate osmolarity measurements.
The market faces certain restraints, including the relatively high cost of advanced osmometer models and the potential for technical complexities associated with their use and maintenance. However, these challenges are likely to be mitigated by ongoing technological advancements and increasing affordability, especially as competition intensifies among market players. The competitive landscape involves established players like ASTORI TECNICA, ELITechGroup, and Nova Biomedical, alongside other significant contributors. These companies are actively engaged in research and development, aiming to enhance existing technologies, introduce innovative features, and expand their market reach through strategic partnerships and geographical expansion. The forecast period (2025-2033) promises continued market expansion, driven by the aforementioned factors, making osmometers an increasingly important tool in various healthcare and research settings.
Osmometer Market: A Comprehensive Report (2019-2033)
This detailed report provides a comprehensive analysis of the global Osmometer Market, offering invaluable insights for stakeholders across the industry. Covering the period from 2019 to 2033, with a base year of 2025 and a forecast period of 2025-2033, this research delves into market segmentation, competitive dynamics, growth drivers, and future trends. The report utilizes data from the historical period (2019-2024) to build a robust forecast model for the future. Key players such as ASTORI TECNICA, ELITechGroup, Löser Messtechnik, Nova Biomedical, KNAUER Wissenschaftliche Geräte GmbH, ARKRAY Inc, Precision Systems Inc, and Advanced Instruments LLC are extensively analyzed.
Osmometer Market Structure & Competitive Dynamics
The global osmometer market exhibits a moderately consolidated structure, with several key players holding significant market share. The competitive landscape is characterized by ongoing innovation, strategic mergers and acquisitions (M&A), and the introduction of advanced technologies. Regulatory frameworks, particularly within the healthcare sector, significantly influence market dynamics. The market is also witnessing a shift towards higher-throughput, automated systems, driven by increasing demand for faster and more efficient testing in clinical and pharmaceutical settings. Product substitution is minimal, as osmometers are largely specialized instruments with specific applications. End-user trends indicate a growing preference for sophisticated instruments offering enhanced accuracy and reliability. Recent M&A activity has been moderate, with deal values averaging around xx Million USD annually in the past five years. For example, there were xx M&A deals in the 2022 fiscal year. The top five players collectively hold approximately xx% market share.
- Market Concentration: Moderately consolidated.
- Innovation Ecosystems: Strong focus on improving accuracy, automation, and ease of use.
- Regulatory Frameworks: Stringent regulations in healthcare impacting market access.
- Product Substitutes: Limited direct substitutes.
- End-User Trends: Increasing demand for higher throughput and automation.
- M&A Activity: Moderate activity, xx Million USD average annual deal value (2019-2024).
Osmometer Market Industry Trends & Insights
The global osmometer market is experiencing robust growth, driven by several key factors. The increasing prevalence of chronic diseases requiring regular osmolality testing is a significant driver, along with the rising demand for accurate and efficient diagnostic tools in clinical settings. Technological advancements, such as the development of miniaturized, portable osmometers, are expanding the market's reach. Consumer preferences are shifting towards user-friendly, automated systems, leading manufacturers to focus on improving instrument design and software. The competitive landscape is highly dynamic, with companies investing heavily in research and development to introduce innovative products and improve existing ones. The Compound Annual Growth Rate (CAGR) during the historical period (2019-2024) was approximately xx%, with the market penetration in the clinical sector exceeding xx%. The global market is expected to experience a CAGR of xx% during the forecast period (2025-2033).
Dominant Markets & Segments in Osmometer Market
The North American region currently dominates the global osmometer market, primarily driven by advanced healthcare infrastructure and high adoption rates in clinical laboratories. Within product types, freezing point osmometers hold the largest market share due to their wide applicability and established presence in clinical settings. Multi-sample osmometers are gaining traction due to increasing testing volumes. The clinical application segment remains the dominant application area, accounting for approximately xx% of the total market. Hospitals and laboratory diagnostic centers are the major end-users.
- Leading Region: North America
- Key Drivers for North America: Advanced healthcare infrastructure, high adoption rates in clinical settings, robust research and development activities.
- Dominant Product Type: Freezing point osmometers
- Dominant Sampling Capacity: Multi-sample osmometers
- Dominant Application: Clinical applications
- Dominant End-User: Hospitals and laboratory diagnostic centers
Osmometer Market Product Innovations
Recent advancements in osmometer technology have focused on enhancing accuracy, automation, and user-friendliness. Miniaturization and portability are key trends, enabling point-of-care testing and expanding market access. The integration of advanced software and data management capabilities enhances efficiency and reduces the risk of errors. New features like improved sample handling and reduced maintenance requirements further improve the user experience. These innovations are enhancing the market fit for osmometers across various applications, increasing adoption rates.
Report Segmentation & Scope
This report segments the osmometer market based on product type (Freezing Point Osmometers, Vapor Pressure Osmometers, Membrane Osmometers), sampling capacity (Single-sample Osmometers, Multi-sample Osmometers), application (Clinical, Pharmaceutical and Biotech, Other Applications), and end-user (Hospitals, Laboratory and Diagnostic Centers, Other End Users). Each segment's market size, growth projections, and competitive dynamics are analyzed thoroughly, offering detailed insights into specific market niches and opportunities. For example, the freezing point osmometer segment is expected to experience a xx% CAGR during the forecast period, while the multi-sample osmometer segment is anticipated to grow at xx%. The clinical application segment will continue to dominate, but the pharmaceutical and biotech segments are poised for significant growth.
Key Drivers of Osmometer Market Growth
Several key factors are driving the growth of the osmometer market. These include the increasing prevalence of chronic diseases necessitating frequent osmolality testing; technological advancements leading to more accurate, automated, and user-friendly devices; expanding healthcare infrastructure, particularly in emerging economies; and growing demand for rapid diagnostics in both clinical and research settings. Regulatory support for advanced diagnostic tools further fuels market expansion.
Challenges in the Osmometer Market Sector
The osmometer market faces challenges including stringent regulatory requirements for medical devices, potential supply chain disruptions affecting component availability, and intense competition among established players and new entrants. The high initial investment cost for advanced osmometer systems can also be a barrier to market entry, particularly for smaller laboratories or clinics. These factors can negatively impact market growth, although the overall positive trends still outweigh the challenges. The estimated total cost for regulatory compliance alone accounts for approximately xx Million USD annually in the global market.
Leading Players in the Osmometer Market
- ASTORI TECNICA
- ELITechGroup
- Löser Messtechnik
- Nova Biomedical
- KNAUER Wissenschaftliche Geräte GmbH
- ARKRAY Inc
- Precision Systems Inc
- Advanced Instruments LLC
Key Developments in Osmometer Market Sector
- September 2022: Trukera Medical announced the launch of the New ScoutPro Osmolarity System, a portable device designed for point-of-care testing, expanding market access to remote areas.
- September 2021: The launch of Advanced QC, a web-based quality control program for osmometers, improved data sharing and quality control processes within clinical laboratories. This initiative enhanced standardization and comparability of results across different laboratories.
Strategic Osmometer Market Outlook
The osmometer market presents significant growth opportunities, particularly in emerging economies with expanding healthcare infrastructure and rising prevalence of chronic diseases. Strategic investments in research and development, focusing on miniaturization, automation, and advanced features, will be crucial for sustained growth. Collaborations and partnerships within the healthcare ecosystem will enhance market penetration and create new avenues for innovation. The focus on point-of-care testing and telemedicine will further accelerate market growth in the coming years. The market is poised for continued expansion, driven by technological advancements and increasing healthcare demands globally.
Osmometer Market Segmentation
-
1. Product Type
- 1.1. Freezing Point Osmometers
- 1.2. Vapor Pressure Osmometers
- 1.3. Membrane Osmometers
-
2. Sampling Capacity
- 2.1. Single-sample Osmometers
- 2.2. Multi-sample Osmometers
-
3. Application
- 3.1. Clinical
- 3.2. Pharmaceutical and Biotech
- 3.3. Other Applications
-
4. End User
- 4.1. Hospitals
- 4.2. Laboratory and Diagnostic Centers
- 4.3. Other End Users
Osmometer Market Segmentation By Geography
-
1. North America
- 1.1. United States
- 1.2. Canada
- 1.3. Mexico
-
2. Europe
- 2.1. Germany
- 2.2. United Kingdom
- 2.3. France
- 2.4. Italy
- 2.5. Spain
- 2.6. Rest of Europe
-
3. Asia Pacific
- 3.1. China
- 3.2. Japan
- 3.3. India
- 3.4. Australia
- 3.5. South Korea
- 3.6. Rest of Asia Pacific
- 4. Rest of the World
Osmometer Market REPORT HIGHLIGHTS
| Aspects | Details |
|---|---|
| Study Period | 2019-2033 |
| Base Year | 2024 |
| Estimated Year | 2025 |
| Forecast Period | 2025-2033 |
| Historical Period | 2019-2024 |
| Growth Rate | CAGR of 15.29% from 2019-2033 |
| Segmentation |
|
Table of Contents
- 1. Introduction
- 1.1. Research Scope
- 1.2. Market Segmentation
- 1.3. Research Methodology
- 1.4. Definitions and Assumptions
- 2. Executive Summary
- 2.1. Introduction
- 3. Market Dynamics
- 3.1. Introduction
- 3.2. Market Drivers
- 3.2.1. Technological Advancements in Osmometers and High Demand for Automation; Growing R&D Investments and Increase in Burden of Various Diseases
- 3.3. Market Restrains
- 3.3.1. Limitations of Osmometers; Dearth of Skilled Professionals
- 3.4. Market Trends
- 3.4.1. Freezing Point Osmometers are Expected to have Healthy Growth Rate
- 4. Market Factor Analysis
- 4.1. Porters Five Forces
- 4.2. Supply/Value Chain
- 4.3. PESTEL analysis
- 4.4. Market Entropy
- 4.5. Patent/Trademark Analysis
- 5. Global Osmometer Market Analysis, Insights and Forecast, 2019-2031
- 5.1. Market Analysis, Insights and Forecast - by Product Type
- 5.1.1. Freezing Point Osmometers
- 5.1.2. Vapor Pressure Osmometers
- 5.1.3. Membrane Osmometers
- 5.2. Market Analysis, Insights and Forecast - by Sampling Capacity
- 5.2.1. Single-sample Osmometers
- 5.2.2. Multi-sample Osmometers
- 5.3. Market Analysis, Insights and Forecast - by Application
- 5.3.1. Clinical
- 5.3.2. Pharmaceutical and Biotech
- 5.3.3. Other Applications
- 5.4. Market Analysis, Insights and Forecast - by End User
- 5.4.1. Hospitals
- 5.4.2. Laboratory and Diagnostic Centers
- 5.4.3. Other End Users
- 5.5. Market Analysis, Insights and Forecast - by Region
- 5.5.1. North America
- 5.5.2. Europe
- 5.5.3. Asia Pacific
- 5.5.4. Rest of the World
- 5.1. Market Analysis, Insights and Forecast - by Product Type
- 6. North America Osmometer Market Analysis, Insights and Forecast, 2019-2031
- 6.1. Market Analysis, Insights and Forecast - by Product Type
- 6.1.1. Freezing Point Osmometers
- 6.1.2. Vapor Pressure Osmometers
- 6.1.3. Membrane Osmometers
- 6.2. Market Analysis, Insights and Forecast - by Sampling Capacity
- 6.2.1. Single-sample Osmometers
- 6.2.2. Multi-sample Osmometers
- 6.3. Market Analysis, Insights and Forecast - by Application
- 6.3.1. Clinical
- 6.3.2. Pharmaceutical and Biotech
- 6.3.3. Other Applications
- 6.4. Market Analysis, Insights and Forecast - by End User
- 6.4.1. Hospitals
- 6.4.2. Laboratory and Diagnostic Centers
- 6.4.3. Other End Users
- 6.1. Market Analysis, Insights and Forecast - by Product Type
- 7. Europe Osmometer Market Analysis, Insights and Forecast, 2019-2031
- 7.1. Market Analysis, Insights and Forecast - by Product Type
- 7.1.1. Freezing Point Osmometers
- 7.1.2. Vapor Pressure Osmometers
- 7.1.3. Membrane Osmometers
- 7.2. Market Analysis, Insights and Forecast - by Sampling Capacity
- 7.2.1. Single-sample Osmometers
- 7.2.2. Multi-sample Osmometers
- 7.3. Market Analysis, Insights and Forecast - by Application
- 7.3.1. Clinical
- 7.3.2. Pharmaceutical and Biotech
- 7.3.3. Other Applications
- 7.4. Market Analysis, Insights and Forecast - by End User
- 7.4.1. Hospitals
- 7.4.2. Laboratory and Diagnostic Centers
- 7.4.3. Other End Users
- 7.1. Market Analysis, Insights and Forecast - by Product Type
- 8. Asia Pacific Osmometer Market Analysis, Insights and Forecast, 2019-2031
- 8.1. Market Analysis, Insights and Forecast - by Product Type
- 8.1.1. Freezing Point Osmometers
- 8.1.2. Vapor Pressure Osmometers
- 8.1.3. Membrane Osmometers
- 8.2. Market Analysis, Insights and Forecast - by Sampling Capacity
- 8.2.1. Single-sample Osmometers
- 8.2.2. Multi-sample Osmometers
- 8.3. Market Analysis, Insights and Forecast - by Application
- 8.3.1. Clinical
- 8.3.2. Pharmaceutical and Biotech
- 8.3.3. Other Applications
- 8.4. Market Analysis, Insights and Forecast - by End User
- 8.4.1. Hospitals
- 8.4.2. Laboratory and Diagnostic Centers
- 8.4.3. Other End Users
- 8.1. Market Analysis, Insights and Forecast - by Product Type
- 9. Rest of the World Osmometer Market Analysis, Insights and Forecast, 2019-2031
- 9.1. Market Analysis, Insights and Forecast - by Product Type
- 9.1.1. Freezing Point Osmometers
- 9.1.2. Vapor Pressure Osmometers
- 9.1.3. Membrane Osmometers
- 9.2. Market Analysis, Insights and Forecast - by Sampling Capacity
- 9.2.1. Single-sample Osmometers
- 9.2.2. Multi-sample Osmometers
- 9.3. Market Analysis, Insights and Forecast - by Application
- 9.3.1. Clinical
- 9.3.2. Pharmaceutical and Biotech
- 9.3.3. Other Applications
- 9.4. Market Analysis, Insights and Forecast - by End User
- 9.4.1. Hospitals
- 9.4.2. Laboratory and Diagnostic Centers
- 9.4.3. Other End Users
- 9.1. Market Analysis, Insights and Forecast - by Product Type
- 10. North America Osmometer Market Analysis, Insights and Forecast, 2019-2031
- 10.1. Market Analysis, Insights and Forecast - By Country/Sub-region
- 10.1.1 United States
- 10.1.2 Canada
- 10.1.3 Mexico
- 11. Europe Osmometer Market Analysis, Insights and Forecast, 2019-2031
- 11.1. Market Analysis, Insights and Forecast - By Country/Sub-region
- 11.1.1 Germany
- 11.1.2 United Kingdom
- 11.1.3 France
- 11.1.4 Spain
- 11.1.5 Italy
- 11.1.6 Spain
- 11.1.7 Belgium
- 11.1.8 Netherland
- 11.1.9 Nordics
- 11.1.10 Rest of Europe
- 12. Asia Pacific Osmometer Market Analysis, Insights and Forecast, 2019-2031
- 12.1. Market Analysis, Insights and Forecast - By Country/Sub-region
- 12.1.1 China
- 12.1.2 Japan
- 12.1.3 India
- 12.1.4 South Korea
- 12.1.5 Southeast Asia
- 12.1.6 Australia
- 12.1.7 Indonesia
- 12.1.8 Phillipes
- 12.1.9 Singapore
- 12.1.10 Thailandc
- 12.1.11 Rest of Asia Pacific
- 13. South America Osmometer Market Analysis, Insights and Forecast, 2019-2031
- 13.1. Market Analysis, Insights and Forecast - By Country/Sub-region
- 13.1.1 Brazil
- 13.1.2 Argentina
- 13.1.3 Peru
- 13.1.4 Chile
- 13.1.5 Colombia
- 13.1.6 Ecuador
- 13.1.7 Venezuela
- 13.1.8 Rest of South America
- 14. North America Osmometer Market Analysis, Insights and Forecast, 2019-2031
- 14.1. Market Analysis, Insights and Forecast - By Country/Sub-region
- 14.1.1 United States
- 14.1.2 Canada
- 14.1.3 Mexico
- 15. MEA Osmometer Market Analysis, Insights and Forecast, 2019-2031
- 15.1. Market Analysis, Insights and Forecast - By Country/Sub-region
- 15.1.1 United Arab Emirates
- 15.1.2 Saudi Arabia
- 15.1.3 South Africa
- 15.1.4 Rest of Middle East and Africa
- 16. Competitive Analysis
- 16.1. Global Market Share Analysis 2024
- 16.2. Company Profiles
- 16.2.1 ASTORI TECNICA
- 16.2.1.1. Overview
- 16.2.1.2. Products
- 16.2.1.3. SWOT Analysis
- 16.2.1.4. Recent Developments
- 16.2.1.5. Financials (Based on Availability)
- 16.2.2 ELITechGroup
- 16.2.2.1. Overview
- 16.2.2.2. Products
- 16.2.2.3. SWOT Analysis
- 16.2.2.4. Recent Developments
- 16.2.2.5. Financials (Based on Availability)
- 16.2.3 Löser Messtechnik
- 16.2.3.1. Overview
- 16.2.3.2. Products
- 16.2.3.3. SWOT Analysis
- 16.2.3.4. Recent Developments
- 16.2.3.5. Financials (Based on Availability)
- 16.2.4 Nova Biomedical
- 16.2.4.1. Overview
- 16.2.4.2. Products
- 16.2.4.3. SWOT Analysis
- 16.2.4.4. Recent Developments
- 16.2.4.5. Financials (Based on Availability)
- 16.2.5 KNAUER Wissenschaftliche Gerete GmbH
- 16.2.5.1. Overview
- 16.2.5.2. Products
- 16.2.5.3. SWOT Analysis
- 16.2.5.4. Recent Developments
- 16.2.5.5. Financials (Based on Availability)
- 16.2.6 ARKRAY Inc
- 16.2.6.1. Overview
- 16.2.6.2. Products
- 16.2.6.3. SWOT Analysis
- 16.2.6.4. Recent Developments
- 16.2.6.5. Financials (Based on Availability)
- 16.2.7 Precision Systems Inc
- 16.2.7.1. Overview
- 16.2.7.2. Products
- 16.2.7.3. SWOT Analysis
- 16.2.7.4. Recent Developments
- 16.2.7.5. Financials (Based on Availability)
- 16.2.8 Advanced Instruments LLC
- 16.2.8.1. Overview
- 16.2.8.2. Products
- 16.2.8.3. SWOT Analysis
- 16.2.8.4. Recent Developments
- 16.2.8.5. Financials (Based on Availability)
- 16.2.1 ASTORI TECNICA
List of Figures
- Figure 1: Global Osmometer Market Revenue Breakdown (Million, %) by Region 2024 & 2032
- Figure 2: Global Osmometer Market Volume Breakdown (K Unit, %) by Region 2024 & 2032
- Figure 3: North America Osmometer Market Revenue (Million), by Country 2024 & 2032
- Figure 4: North America Osmometer Market Volume (K Unit), by Country 2024 & 2032
- Figure 5: North America Osmometer Market Revenue Share (%), by Country 2024 & 2032
- Figure 6: North America Osmometer Market Volume Share (%), by Country 2024 & 2032
- Figure 7: Europe Osmometer Market Revenue (Million), by Country 2024 & 2032
- Figure 8: Europe Osmometer Market Volume (K Unit), by Country 2024 & 2032
- Figure 9: Europe Osmometer Market Revenue Share (%), by Country 2024 & 2032
- Figure 10: Europe Osmometer Market Volume Share (%), by Country 2024 & 2032
- Figure 11: Asia Pacific Osmometer Market Revenue (Million), by Country 2024 & 2032
- Figure 12: Asia Pacific Osmometer Market Volume (K Unit), by Country 2024 & 2032
- Figure 13: Asia Pacific Osmometer Market Revenue Share (%), by Country 2024 & 2032
- Figure 14: Asia Pacific Osmometer Market Volume Share (%), by Country 2024 & 2032
- Figure 15: South America Osmometer Market Revenue (Million), by Country 2024 & 2032
- Figure 16: South America Osmometer Market Volume (K Unit), by Country 2024 & 2032
- Figure 17: South America Osmometer Market Revenue Share (%), by Country 2024 & 2032
- Figure 18: South America Osmometer Market Volume Share (%), by Country 2024 & 2032
- Figure 19: North America Osmometer Market Revenue (Million), by Country 2024 & 2032
- Figure 20: North America Osmometer Market Volume (K Unit), by Country 2024 & 2032
- Figure 21: North America Osmometer Market Revenue Share (%), by Country 2024 & 2032
- Figure 22: North America Osmometer Market Volume Share (%), by Country 2024 & 2032
- Figure 23: MEA Osmometer Market Revenue (Million), by Country 2024 & 2032
- Figure 24: MEA Osmometer Market Volume (K Unit), by Country 2024 & 2032
- Figure 25: MEA Osmometer Market Revenue Share (%), by Country 2024 & 2032
- Figure 26: MEA Osmometer Market Volume Share (%), by Country 2024 & 2032
- Figure 27: North America Osmometer Market Revenue (Million), by Product Type 2024 & 2032
- Figure 28: North America Osmometer Market Volume (K Unit), by Product Type 2024 & 2032
- Figure 29: North America Osmometer Market Revenue Share (%), by Product Type 2024 & 2032
- Figure 30: North America Osmometer Market Volume Share (%), by Product Type 2024 & 2032
- Figure 31: North America Osmometer Market Revenue (Million), by Sampling Capacity 2024 & 2032
- Figure 32: North America Osmometer Market Volume (K Unit), by Sampling Capacity 2024 & 2032
- Figure 33: North America Osmometer Market Revenue Share (%), by Sampling Capacity 2024 & 2032
- Figure 34: North America Osmometer Market Volume Share (%), by Sampling Capacity 2024 & 2032
- Figure 35: North America Osmometer Market Revenue (Million), by Application 2024 & 2032
- Figure 36: North America Osmometer Market Volume (K Unit), by Application 2024 & 2032
- Figure 37: North America Osmometer Market Revenue Share (%), by Application 2024 & 2032
- Figure 38: North America Osmometer Market Volume Share (%), by Application 2024 & 2032
- Figure 39: North America Osmometer Market Revenue (Million), by End User 2024 & 2032
- Figure 40: North America Osmometer Market Volume (K Unit), by End User 2024 & 2032
- Figure 41: North America Osmometer Market Revenue Share (%), by End User 2024 & 2032
- Figure 42: North America Osmometer Market Volume Share (%), by End User 2024 & 2032
- Figure 43: North America Osmometer Market Revenue (Million), by Country 2024 & 2032
- Figure 44: North America Osmometer Market Volume (K Unit), by Country 2024 & 2032
- Figure 45: North America Osmometer Market Revenue Share (%), by Country 2024 & 2032
- Figure 46: North America Osmometer Market Volume Share (%), by Country 2024 & 2032
- Figure 47: Europe Osmometer Market Revenue (Million), by Product Type 2024 & 2032
- Figure 48: Europe Osmometer Market Volume (K Unit), by Product Type 2024 & 2032
- Figure 49: Europe Osmometer Market Revenue Share (%), by Product Type 2024 & 2032
- Figure 50: Europe Osmometer Market Volume Share (%), by Product Type 2024 & 2032
- Figure 51: Europe Osmometer Market Revenue (Million), by Sampling Capacity 2024 & 2032
- Figure 52: Europe Osmometer Market Volume (K Unit), by Sampling Capacity 2024 & 2032
- Figure 53: Europe Osmometer Market Revenue Share (%), by Sampling Capacity 2024 & 2032
- Figure 54: Europe Osmometer Market Volume Share (%), by Sampling Capacity 2024 & 2032
- Figure 55: Europe Osmometer Market Revenue (Million), by Application 2024 & 2032
- Figure 56: Europe Osmometer Market Volume (K Unit), by Application 2024 & 2032
- Figure 57: Europe Osmometer Market Revenue Share (%), by Application 2024 & 2032
- Figure 58: Europe Osmometer Market Volume Share (%), by Application 2024 & 2032
- Figure 59: Europe Osmometer Market Revenue (Million), by End User 2024 & 2032
- Figure 60: Europe Osmometer Market Volume (K Unit), by End User 2024 & 2032
- Figure 61: Europe Osmometer Market Revenue Share (%), by End User 2024 & 2032
- Figure 62: Europe Osmometer Market Volume Share (%), by End User 2024 & 2032
- Figure 63: Europe Osmometer Market Revenue (Million), by Country 2024 & 2032
- Figure 64: Europe Osmometer Market Volume (K Unit), by Country 2024 & 2032
- Figure 65: Europe Osmometer Market Revenue Share (%), by Country 2024 & 2032
- Figure 66: Europe Osmometer Market Volume Share (%), by Country 2024 & 2032
- Figure 67: Asia Pacific Osmometer Market Revenue (Million), by Product Type 2024 & 2032
- Figure 68: Asia Pacific Osmometer Market Volume (K Unit), by Product Type 2024 & 2032
- Figure 69: Asia Pacific Osmometer Market Revenue Share (%), by Product Type 2024 & 2032
- Figure 70: Asia Pacific Osmometer Market Volume Share (%), by Product Type 2024 & 2032
- Figure 71: Asia Pacific Osmometer Market Revenue (Million), by Sampling Capacity 2024 & 2032
- Figure 72: Asia Pacific Osmometer Market Volume (K Unit), by Sampling Capacity 2024 & 2032
- Figure 73: Asia Pacific Osmometer Market Revenue Share (%), by Sampling Capacity 2024 & 2032
- Figure 74: Asia Pacific Osmometer Market Volume Share (%), by Sampling Capacity 2024 & 2032
- Figure 75: Asia Pacific Osmometer Market Revenue (Million), by Application 2024 & 2032
- Figure 76: Asia Pacific Osmometer Market Volume (K Unit), by Application 2024 & 2032
- Figure 77: Asia Pacific Osmometer Market Revenue Share (%), by Application 2024 & 2032
- Figure 78: Asia Pacific Osmometer Market Volume Share (%), by Application 2024 & 2032
- Figure 79: Asia Pacific Osmometer Market Revenue (Million), by End User 2024 & 2032
- Figure 80: Asia Pacific Osmometer Market Volume (K Unit), by End User 2024 & 2032
- Figure 81: Asia Pacific Osmometer Market Revenue Share (%), by End User 2024 & 2032
- Figure 82: Asia Pacific Osmometer Market Volume Share (%), by End User 2024 & 2032
- Figure 83: Asia Pacific Osmometer Market Revenue (Million), by Country 2024 & 2032
- Figure 84: Asia Pacific Osmometer Market Volume (K Unit), by Country 2024 & 2032
- Figure 85: Asia Pacific Osmometer Market Revenue Share (%), by Country 2024 & 2032
- Figure 86: Asia Pacific Osmometer Market Volume Share (%), by Country 2024 & 2032
- Figure 87: Rest of the World Osmometer Market Revenue (Million), by Product Type 2024 & 2032
- Figure 88: Rest of the World Osmometer Market Volume (K Unit), by Product Type 2024 & 2032
- Figure 89: Rest of the World Osmometer Market Revenue Share (%), by Product Type 2024 & 2032
- Figure 90: Rest of the World Osmometer Market Volume Share (%), by Product Type 2024 & 2032
- Figure 91: Rest of the World Osmometer Market Revenue (Million), by Sampling Capacity 2024 & 2032
- Figure 92: Rest of the World Osmometer Market Volume (K Unit), by Sampling Capacity 2024 & 2032
- Figure 93: Rest of the World Osmometer Market Revenue Share (%), by Sampling Capacity 2024 & 2032
- Figure 94: Rest of the World Osmometer Market Volume Share (%), by Sampling Capacity 2024 & 2032
- Figure 95: Rest of the World Osmometer Market Revenue (Million), by Application 2024 & 2032
- Figure 96: Rest of the World Osmometer Market Volume (K Unit), by Application 2024 & 2032
- Figure 97: Rest of the World Osmometer Market Revenue Share (%), by Application 2024 & 2032
- Figure 98: Rest of the World Osmometer Market Volume Share (%), by Application 2024 & 2032
- Figure 99: Rest of the World Osmometer Market Revenue (Million), by End User 2024 & 2032
- Figure 100: Rest of the World Osmometer Market Volume (K Unit), by End User 2024 & 2032
- Figure 101: Rest of the World Osmometer Market Revenue Share (%), by End User 2024 & 2032
- Figure 102: Rest of the World Osmometer Market Volume Share (%), by End User 2024 & 2032
- Figure 103: Rest of the World Osmometer Market Revenue (Million), by Country 2024 & 2032
- Figure 104: Rest of the World Osmometer Market Volume (K Unit), by Country 2024 & 2032
- Figure 105: Rest of the World Osmometer Market Revenue Share (%), by Country 2024 & 2032
- Figure 106: Rest of the World Osmometer Market Volume Share (%), by Country 2024 & 2032
List of Tables
- Table 1: Global Osmometer Market Revenue Million Forecast, by Region 2019 & 2032
- Table 2: Global Osmometer Market Volume K Unit Forecast, by Region 2019 & 2032
- Table 3: Global Osmometer Market Revenue Million Forecast, by Product Type 2019 & 2032
- Table 4: Global Osmometer Market Volume K Unit Forecast, by Product Type 2019 & 2032
- Table 5: Global Osmometer Market Revenue Million Forecast, by Sampling Capacity 2019 & 2032
- Table 6: Global Osmometer Market Volume K Unit Forecast, by Sampling Capacity 2019 & 2032
- Table 7: Global Osmometer Market Revenue Million Forecast, by Application 2019 & 2032
- Table 8: Global Osmometer Market Volume K Unit Forecast, by Application 2019 & 2032
- Table 9: Global Osmometer Market Revenue Million Forecast, by End User 2019 & 2032
- Table 10: Global Osmometer Market Volume K Unit Forecast, by End User 2019 & 2032
- Table 11: Global Osmometer Market Revenue Million Forecast, by Region 2019 & 2032
- Table 12: Global Osmometer Market Volume K Unit Forecast, by Region 2019 & 2032
- Table 13: Global Osmometer Market Revenue Million Forecast, by Country 2019 & 2032
- Table 14: Global Osmometer Market Volume K Unit Forecast, by Country 2019 & 2032
- Table 15: United States Osmometer Market Revenue (Million) Forecast, by Application 2019 & 2032
- Table 16: United States Osmometer Market Volume (K Unit) Forecast, by Application 2019 & 2032
- Table 17: Canada Osmometer Market Revenue (Million) Forecast, by Application 2019 & 2032
- Table 18: Canada Osmometer Market Volume (K Unit) Forecast, by Application 2019 & 2032
- Table 19: Mexico Osmometer Market Revenue (Million) Forecast, by Application 2019 & 2032
- Table 20: Mexico Osmometer Market Volume (K Unit) Forecast, by Application 2019 & 2032
- Table 21: Global Osmometer Market Revenue Million Forecast, by Country 2019 & 2032
- Table 22: Global Osmometer Market Volume K Unit Forecast, by Country 2019 & 2032
- Table 23: Germany Osmometer Market Revenue (Million) Forecast, by Application 2019 & 2032
- Table 24: Germany Osmometer Market Volume (K Unit) Forecast, by Application 2019 & 2032
- Table 25: United Kingdom Osmometer Market Revenue (Million) Forecast, by Application 2019 & 2032
- Table 26: United Kingdom Osmometer Market Volume (K Unit) Forecast, by Application 2019 & 2032
- Table 27: France Osmometer Market Revenue (Million) Forecast, by Application 2019 & 2032
- Table 28: France Osmometer Market Volume (K Unit) Forecast, by Application 2019 & 2032
- Table 29: Spain Osmometer Market Revenue (Million) Forecast, by Application 2019 & 2032
- Table 30: Spain Osmometer Market Volume (K Unit) Forecast, by Application 2019 & 2032
- Table 31: Italy Osmometer Market Revenue (Million) Forecast, by Application 2019 & 2032
- Table 32: Italy Osmometer Market Volume (K Unit) Forecast, by Application 2019 & 2032
- Table 33: Spain Osmometer Market Revenue (Million) Forecast, by Application 2019 & 2032
- Table 34: Spain Osmometer Market Volume (K Unit) Forecast, by Application 2019 & 2032
- Table 35: Belgium Osmometer Market Revenue (Million) Forecast, by Application 2019 & 2032
- Table 36: Belgium Osmometer Market Volume (K Unit) Forecast, by Application 2019 & 2032
- Table 37: Netherland Osmometer Market Revenue (Million) Forecast, by Application 2019 & 2032
- Table 38: Netherland Osmometer Market Volume (K Unit) Forecast, by Application 2019 & 2032
- Table 39: Nordics Osmometer Market Revenue (Million) Forecast, by Application 2019 & 2032
- Table 40: Nordics Osmometer Market Volume (K Unit) Forecast, by Application 2019 & 2032
- Table 41: Rest of Europe Osmometer Market Revenue (Million) Forecast, by Application 2019 & 2032
- Table 42: Rest of Europe Osmometer Market Volume (K Unit) Forecast, by Application 2019 & 2032
- Table 43: Global Osmometer Market Revenue Million Forecast, by Country 2019 & 2032
- Table 44: Global Osmometer Market Volume K Unit Forecast, by Country 2019 & 2032
- Table 45: China Osmometer Market Revenue (Million) Forecast, by Application 2019 & 2032
- Table 46: China Osmometer Market Volume (K Unit) Forecast, by Application 2019 & 2032
- Table 47: Japan Osmometer Market Revenue (Million) Forecast, by Application 2019 & 2032
- Table 48: Japan Osmometer Market Volume (K Unit) Forecast, by Application 2019 & 2032
- Table 49: India Osmometer Market Revenue (Million) Forecast, by Application 2019 & 2032
- Table 50: India Osmometer Market Volume (K Unit) Forecast, by Application 2019 & 2032
- Table 51: South Korea Osmometer Market Revenue (Million) Forecast, by Application 2019 & 2032
- Table 52: South Korea Osmometer Market Volume (K Unit) Forecast, by Application 2019 & 2032
- Table 53: Southeast Asia Osmometer Market Revenue (Million) Forecast, by Application 2019 & 2032
- Table 54: Southeast Asia Osmometer Market Volume (K Unit) Forecast, by Application 2019 & 2032
- Table 55: Australia Osmometer Market Revenue (Million) Forecast, by Application 2019 & 2032
- Table 56: Australia Osmometer Market Volume (K Unit) Forecast, by Application 2019 & 2032
- Table 57: Indonesia Osmometer Market Revenue (Million) Forecast, by Application 2019 & 2032
- Table 58: Indonesia Osmometer Market Volume (K Unit) Forecast, by Application 2019 & 2032
- Table 59: Phillipes Osmometer Market Revenue (Million) Forecast, by Application 2019 & 2032
- Table 60: Phillipes Osmometer Market Volume (K Unit) Forecast, by Application 2019 & 2032
- Table 61: Singapore Osmometer Market Revenue (Million) Forecast, by Application 2019 & 2032
- Table 62: Singapore Osmometer Market Volume (K Unit) Forecast, by Application 2019 & 2032
- Table 63: Thailandc Osmometer Market Revenue (Million) Forecast, by Application 2019 & 2032
- Table 64: Thailandc Osmometer Market Volume (K Unit) Forecast, by Application 2019 & 2032
- Table 65: Rest of Asia Pacific Osmometer Market Revenue (Million) Forecast, by Application 2019 & 2032
- Table 66: Rest of Asia Pacific Osmometer Market Volume (K Unit) Forecast, by Application 2019 & 2032
- Table 67: Global Osmometer Market Revenue Million Forecast, by Country 2019 & 2032
- Table 68: Global Osmometer Market Volume K Unit Forecast, by Country 2019 & 2032
- Table 69: Brazil Osmometer Market Revenue (Million) Forecast, by Application 2019 & 2032
- Table 70: Brazil Osmometer Market Volume (K Unit) Forecast, by Application 2019 & 2032
- Table 71: Argentina Osmometer Market Revenue (Million) Forecast, by Application 2019 & 2032
- Table 72: Argentina Osmometer Market Volume (K Unit) Forecast, by Application 2019 & 2032
- Table 73: Peru Osmometer Market Revenue (Million) Forecast, by Application 2019 & 2032
- Table 74: Peru Osmometer Market Volume (K Unit) Forecast, by Application 2019 & 2032
- Table 75: Chile Osmometer Market Revenue (Million) Forecast, by Application 2019 & 2032
- Table 76: Chile Osmometer Market Volume (K Unit) Forecast, by Application 2019 & 2032
- Table 77: Colombia Osmometer Market Revenue (Million) Forecast, by Application 2019 & 2032
- Table 78: Colombia Osmometer Market Volume (K Unit) Forecast, by Application 2019 & 2032
- Table 79: Ecuador Osmometer Market Revenue (Million) Forecast, by Application 2019 & 2032
- Table 80: Ecuador Osmometer Market Volume (K Unit) Forecast, by Application 2019 & 2032
- Table 81: Venezuela Osmometer Market Revenue (Million) Forecast, by Application 2019 & 2032
- Table 82: Venezuela Osmometer Market Volume (K Unit) Forecast, by Application 2019 & 2032
- Table 83: Rest of South America Osmometer Market Revenue (Million) Forecast, by Application 2019 & 2032
- Table 84: Rest of South America Osmometer Market Volume (K Unit) Forecast, by Application 2019 & 2032
- Table 85: Global Osmometer Market Revenue Million Forecast, by Country 2019 & 2032
- Table 86: Global Osmometer Market Volume K Unit Forecast, by Country 2019 & 2032
- Table 87: United States Osmometer Market Revenue (Million) Forecast, by Application 2019 & 2032
- Table 88: United States Osmometer Market Volume (K Unit) Forecast, by Application 2019 & 2032
- Table 89: Canada Osmometer Market Revenue (Million) Forecast, by Application 2019 & 2032
- Table 90: Canada Osmometer Market Volume (K Unit) Forecast, by Application 2019 & 2032
- Table 91: Mexico Osmometer Market Revenue (Million) Forecast, by Application 2019 & 2032
- Table 92: Mexico Osmometer Market Volume (K Unit) Forecast, by Application 2019 & 2032
- Table 93: Global Osmometer Market Revenue Million Forecast, by Country 2019 & 2032
- Table 94: Global Osmometer Market Volume K Unit Forecast, by Country 2019 & 2032
- Table 95: United Arab Emirates Osmometer Market Revenue (Million) Forecast, by Application 2019 & 2032
- Table 96: United Arab Emirates Osmometer Market Volume (K Unit) Forecast, by Application 2019 & 2032
- Table 97: Saudi Arabia Osmometer Market Revenue (Million) Forecast, by Application 2019 & 2032
- Table 98: Saudi Arabia Osmometer Market Volume (K Unit) Forecast, by Application 2019 & 2032
- Table 99: South Africa Osmometer Market Revenue (Million) Forecast, by Application 2019 & 2032
- Table 100: South Africa Osmometer Market Volume (K Unit) Forecast, by Application 2019 & 2032
- Table 101: Rest of Middle East and Africa Osmometer Market Revenue (Million) Forecast, by Application 2019 & 2032
- Table 102: Rest of Middle East and Africa Osmometer Market Volume (K Unit) Forecast, by Application 2019 & 2032
- Table 103: Global Osmometer Market Revenue Million Forecast, by Product Type 2019 & 2032
- Table 104: Global Osmometer Market Volume K Unit Forecast, by Product Type 2019 & 2032
- Table 105: Global Osmometer Market Revenue Million Forecast, by Sampling Capacity 2019 & 2032
- Table 106: Global Osmometer Market Volume K Unit Forecast, by Sampling Capacity 2019 & 2032
- Table 107: Global Osmometer Market Revenue Million Forecast, by Application 2019 & 2032
- Table 108: Global Osmometer Market Volume K Unit Forecast, by Application 2019 & 2032
- Table 109: Global Osmometer Market Revenue Million Forecast, by End User 2019 & 2032
- Table 110: Global Osmometer Market Volume K Unit Forecast, by End User 2019 & 2032
- Table 111: Global Osmometer Market Revenue Million Forecast, by Country 2019 & 2032
- Table 112: Global Osmometer Market Volume K Unit Forecast, by Country 2019 & 2032
- Table 113: United States Osmometer Market Revenue (Million) Forecast, by Application 2019 & 2032
- Table 114: United States Osmometer Market Volume (K Unit) Forecast, by Application 2019 & 2032
- Table 115: Canada Osmometer Market Revenue (Million) Forecast, by Application 2019 & 2032
- Table 116: Canada Osmometer Market Volume (K Unit) Forecast, by Application 2019 & 2032
- Table 117: Mexico Osmometer Market Revenue (Million) Forecast, by Application 2019 & 2032
- Table 118: Mexico Osmometer Market Volume (K Unit) Forecast, by Application 2019 & 2032
- Table 119: Global Osmometer Market Revenue Million Forecast, by Product Type 2019 & 2032
- Table 120: Global Osmometer Market Volume K Unit Forecast, by Product Type 2019 & 2032
- Table 121: Global Osmometer Market Revenue Million Forecast, by Sampling Capacity 2019 & 2032
- Table 122: Global Osmometer Market Volume K Unit Forecast, by Sampling Capacity 2019 & 2032
- Table 123: Global Osmometer Market Revenue Million Forecast, by Application 2019 & 2032
- Table 124: Global Osmometer Market Volume K Unit Forecast, by Application 2019 & 2032
- Table 125: Global Osmometer Market Revenue Million Forecast, by End User 2019 & 2032
- Table 126: Global Osmometer Market Volume K Unit Forecast, by End User 2019 & 2032
- Table 127: Global Osmometer Market Revenue Million Forecast, by Country 2019 & 2032
- Table 128: Global Osmometer Market Volume K Unit Forecast, by Country 2019 & 2032
- Table 129: Germany Osmometer Market Revenue (Million) Forecast, by Application 2019 & 2032
- Table 130: Germany Osmometer Market Volume (K Unit) Forecast, by Application 2019 & 2032
- Table 131: United Kingdom Osmometer Market Revenue (Million) Forecast, by Application 2019 & 2032
- Table 132: United Kingdom Osmometer Market Volume (K Unit) Forecast, by Application 2019 & 2032
- Table 133: France Osmometer Market Revenue (Million) Forecast, by Application 2019 & 2032
- Table 134: France Osmometer Market Volume (K Unit) Forecast, by Application 2019 & 2032
- Table 135: Italy Osmometer Market Revenue (Million) Forecast, by Application 2019 & 2032
- Table 136: Italy Osmometer Market Volume (K Unit) Forecast, by Application 2019 & 2032
- Table 137: Spain Osmometer Market Revenue (Million) Forecast, by Application 2019 & 2032
- Table 138: Spain Osmometer Market Volume (K Unit) Forecast, by Application 2019 & 2032
- Table 139: Rest of Europe Osmometer Market Revenue (Million) Forecast, by Application 2019 & 2032
- Table 140: Rest of Europe Osmometer Market Volume (K Unit) Forecast, by Application 2019 & 2032
- Table 141: Global Osmometer Market Revenue Million Forecast, by Product Type 2019 & 2032
- Table 142: Global Osmometer Market Volume K Unit Forecast, by Product Type 2019 & 2032
- Table 143: Global Osmometer Market Revenue Million Forecast, by Sampling Capacity 2019 & 2032
- Table 144: Global Osmometer Market Volume K Unit Forecast, by Sampling Capacity 2019 & 2032
- Table 145: Global Osmometer Market Revenue Million Forecast, by Application 2019 & 2032
- Table 146: Global Osmometer Market Volume K Unit Forecast, by Application 2019 & 2032
- Table 147: Global Osmometer Market Revenue Million Forecast, by End User 2019 & 2032
- Table 148: Global Osmometer Market Volume K Unit Forecast, by End User 2019 & 2032
- Table 149: Global Osmometer Market Revenue Million Forecast, by Country 2019 & 2032
- Table 150: Global Osmometer Market Volume K Unit Forecast, by Country 2019 & 2032
- Table 151: China Osmometer Market Revenue (Million) Forecast, by Application 2019 & 2032
- Table 152: China Osmometer Market Volume (K Unit) Forecast, by Application 2019 & 2032
- Table 153: Japan Osmometer Market Revenue (Million) Forecast, by Application 2019 & 2032
- Table 154: Japan Osmometer Market Volume (K Unit) Forecast, by Application 2019 & 2032
- Table 155: India Osmometer Market Revenue (Million) Forecast, by Application 2019 & 2032
- Table 156: India Osmometer Market Volume (K Unit) Forecast, by Application 2019 & 2032
- Table 157: Australia Osmometer Market Revenue (Million) Forecast, by Application 2019 & 2032
- Table 158: Australia Osmometer Market Volume (K Unit) Forecast, by Application 2019 & 2032
- Table 159: South Korea Osmometer Market Revenue (Million) Forecast, by Application 2019 & 2032
- Table 160: South Korea Osmometer Market Volume (K Unit) Forecast, by Application 2019 & 2032
- Table 161: Rest of Asia Pacific Osmometer Market Revenue (Million) Forecast, by Application 2019 & 2032
- Table 162: Rest of Asia Pacific Osmometer Market Volume (K Unit) Forecast, by Application 2019 & 2032
- Table 163: Global Osmometer Market Revenue Million Forecast, by Product Type 2019 & 2032
- Table 164: Global Osmometer Market Volume K Unit Forecast, by Product Type 2019 & 2032
- Table 165: Global Osmometer Market Revenue Million Forecast, by Sampling Capacity 2019 & 2032
- Table 166: Global Osmometer Market Volume K Unit Forecast, by Sampling Capacity 2019 & 2032
- Table 167: Global Osmometer Market Revenue Million Forecast, by Application 2019 & 2032
- Table 168: Global Osmometer Market Volume K Unit Forecast, by Application 2019 & 2032
- Table 169: Global Osmometer Market Revenue Million Forecast, by End User 2019 & 2032
- Table 170: Global Osmometer Market Volume K Unit Forecast, by End User 2019 & 2032
- Table 171: Global Osmometer Market Revenue Million Forecast, by Country 2019 & 2032
- Table 172: Global Osmometer Market Volume K Unit Forecast, by Country 2019 & 2032
Frequently Asked Questions
1. What is the projected Compound Annual Growth Rate (CAGR) of the Osmometer Market?
The projected CAGR is approximately 15.29%.
2. Which companies are prominent players in the Osmometer Market?
Key companies in the market include ASTORI TECNICA, ELITechGroup, Löser Messtechnik , Nova Biomedical, KNAUER Wissenschaftliche Gerete GmbH, ARKRAY Inc, Precision Systems Inc, Advanced Instruments LLC.
3. What are the main segments of the Osmometer Market?
The market segments include Product Type, Sampling Capacity, Application, End User.
4. Can you provide details about the market size?
The market size is estimated to be USD 149.65 Million as of 2022.
5. What are some drivers contributing to market growth?
Technological Advancements in Osmometers and High Demand for Automation; Growing R&D Investments and Increase in Burden of Various Diseases.
6. What are the notable trends driving market growth?
Freezing Point Osmometers are Expected to have Healthy Growth Rate.
7. Are there any restraints impacting market growth?
Limitations of Osmometers; Dearth of Skilled Professionals.
8. Can you provide examples of recent developments in the market?
September 2022: Trukera Medical announced the launch of the New ScoutPro Osmolarity System.
9. What pricing options are available for accessing the report?
Pricing options include single-user, multi-user, and enterprise licenses priced at USD 4750, USD 5250, and USD 8750 respectively.
10. Is the market size provided in terms of value or volume?
The market size is provided in terms of value, measured in Million and volume, measured in K Unit.
11. Are there any specific market keywords associated with the report?
Yes, the market keyword associated with the report is "Osmometer Market," which aids in identifying and referencing the specific market segment covered.
12. How do I determine which pricing option suits my needs best?
The pricing options vary based on user requirements and access needs. Individual users may opt for single-user licenses, while businesses requiring broader access may choose multi-user or enterprise licenses for cost-effective access to the report.
13. Are there any additional resources or data provided in the Osmometer Market report?
While the report offers comprehensive insights, it's advisable to review the specific contents or supplementary materials provided to ascertain if additional resources or data are available.
14. How can I stay updated on further developments or reports in the Osmometer Market?
To stay informed about further developments, trends, and reports in the Osmometer Market, consider subscribing to industry newsletters, following relevant companies and organizations, or regularly checking reputable industry news sources and publications.
Methodology
Step 1 - Identification of Relevant Samples Size from Population Database


Step 2 - Approaches for Defining Global Market Size (Value, Volume* & Price*)

Note*: In applicable scenarios
Step 3 - Data Sources
Primary Research
- Web Analytics
- Survey Reports
- Research Institute
- Latest Research Reports
- Opinion Leaders
Secondary Research
- Annual Reports
- White Paper
- Latest Press Release
- Industry Association
- Paid Database
- Investor Presentations

Step 4 - Data Triangulation
Involves using different sources of information in order to increase the validity of a study
These sources are likely to be stakeholders in a program - participants, other researchers, program staff, other community members, and so on.
Then we put all data in single framework & apply various statistical tools to find out the dynamic on the market.
During the analysis stage, feedback from the stakeholder groups would be compared to determine areas of agreement as well as areas of divergence


