
Key Insights
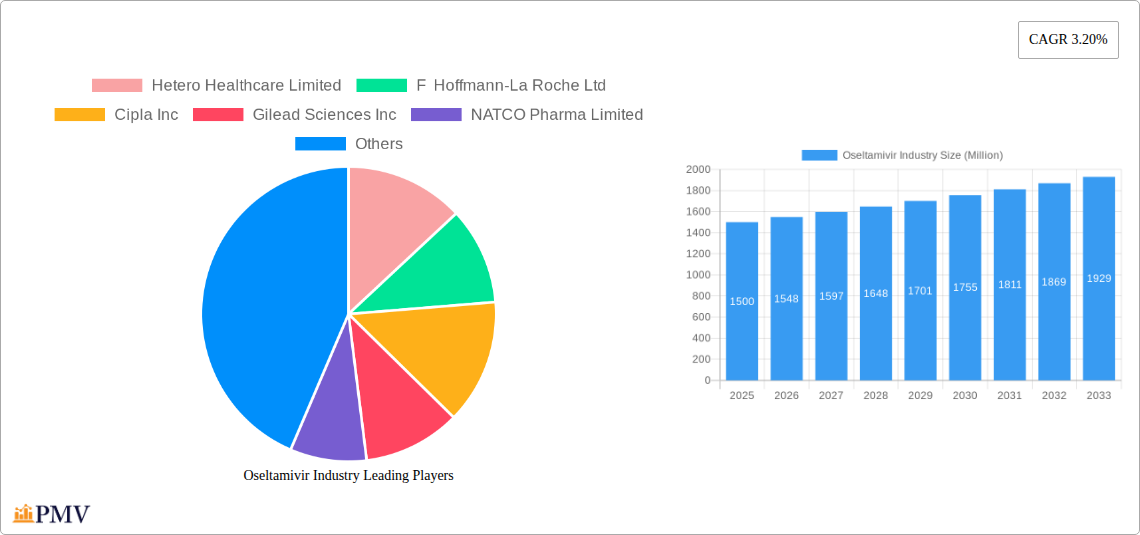
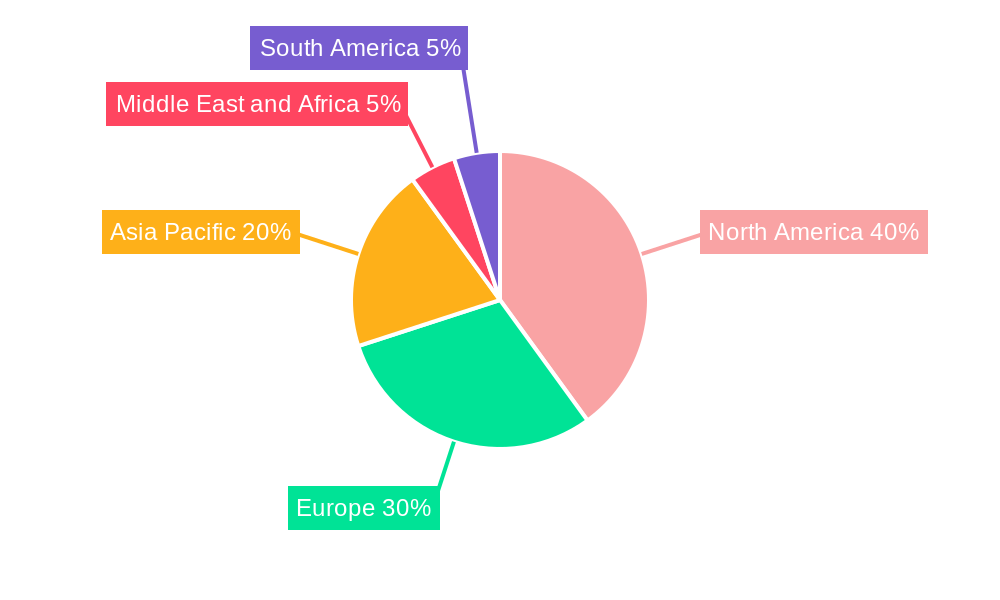
The global Oseltamivir market, valued at approximately $1.5 billion in 2025, is projected to experience steady growth, driven primarily by the persistent threat of influenza outbreaks and the increasing prevalence of drug-resistant strains. The market's Compound Annual Growth Rate (CAGR) of 3.20% from 2025 to 2033 indicates a continuous, albeit moderate, expansion. Key drivers include seasonal influenza epidemics, the emergence of novel influenza strains requiring antiviral treatment, and growing awareness among healthcare professionals and the public regarding the importance of prompt antiviral therapy. The market is segmented by product type (capsule, suspension, others) and application (influenza A, influenza B, others), with capsules currently holding the largest market share due to ease of administration. Growth in the suspension segment is expected, driven by increasing demand for pediatric formulations. Geographic distribution shows a concentration in developed markets like North America and Europe, reflecting higher healthcare expenditure and better access to antiviral medications. However, rising healthcare infrastructure and awareness in emerging economies like those in Asia-Pacific are expected to fuel market expansion in these regions over the forecast period. While the presence of generic alternatives exerts downward pressure on prices, the ongoing need for effective influenza treatment ensures sustained market demand.
Market restraints include the potential for adverse effects associated with oseltamivir, the development of antiviral resistance, and the availability of alternative influenza prevention methods like vaccination. Despite these challenges, the continuous threat of influenza pandemics and the ongoing research into improved formulations and delivery systems suggest a stable future for the oseltamivir market. Key players like Hetero Healthcare Limited, Roche, and Cipla are strategically focusing on strengthening their product portfolio, expanding market reach, and investing in research and development to maintain their competitive edge in this evolving landscape. The continued development of novel influenza strains and the likelihood of future pandemics present both a challenge and an opportunity for growth within this market segment.
Oseltamivir Industry Market Report: 2019-2033
This comprehensive report provides a detailed analysis of the global Oseltamivir industry, covering the period 2019-2033. With a focus on market structure, competitive dynamics, key players, and future growth prospects, this report is an essential resource for industry professionals, investors, and researchers. The report leverages a robust data-driven methodology, incorporating both historical data (2019-2024) and projections (2025-2033) to offer actionable insights. The base year for this analysis is 2025, and the estimated year is also 2025. The market is segmented by product type (Capsule, Suspension, Other Product Types) and application (Influenza A, Influenza B, Other Applications).
Oseltamivir Industry Market Structure & Competitive Dynamics
The global oseltamivir market exhibits a moderately concentrated structure, with a few dominant players holding significant market share. The industry is characterized by a dynamic interplay of established pharmaceutical giants and emerging generic manufacturers. Innovation within the oseltamivir space is largely focused on improving formulation, delivery systems, and exploring combination therapies. Regulatory frameworks, particularly concerning generic approvals and pricing policies, significantly influence market dynamics. The presence of limited direct substitutes, mainly other antiviral drugs for influenza, creates a relatively stable market landscape. However, the emergence of novel antiviral agents and evolving consumer preferences pose potential competitive threats. Mergers and acquisitions (M&A) activity in the industry has been moderate in recent years, with deals primarily focused on expanding market access and strengthening product portfolios. For example, the combined market share of the top three players in 2025 is estimated to be approximately xx%, indicating a consolidated market. The total M&A deal value in the oseltamivir industry between 2019 and 2024 was approximately xx Million, with a noticeable increase in activity towards the latter half of the period.
- Key Market Concentration Metrics: Top 3 players market share (2025): xx%; Herfindahl-Hirschman Index (HHI) (2025): xx.
- Significant M&A Activities (2019-2024): xx Million in total deal value, with a focus on market expansion and product diversification.
- Regulatory Landscape: Stringent regulatory approvals and pricing pressures influence market entry and profitability.
- End-User Trends: Growing awareness of influenza prevention and treatment drives demand, while evolving treatment protocols shape market preferences.
Oseltamivir Industry Trends & Insights
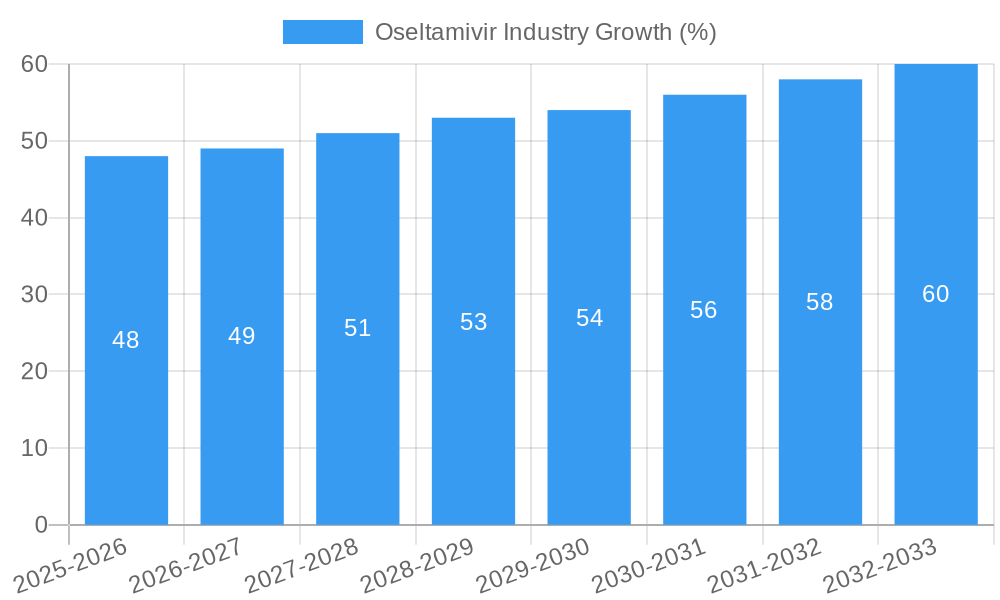
The global oseltamivir market is projected to experience a Compound Annual Growth Rate (CAGR) of xx% during the forecast period (2025-2033). This growth is primarily driven by factors such as the increasing prevalence of influenza globally, heightened awareness of the disease and its potential complications, and the continued demand for effective antiviral treatments. Technological advancements in drug delivery and formulation are leading to improved patient compliance and efficacy. Consumer preferences are increasingly shifting towards convenient dosage forms like oral suspensions, particularly for pediatric populations. However, the emergence of drug resistance and the development of alternative antiviral therapies present potential challenges to market growth. Market penetration of oseltamivir, particularly in developing economies, remains relatively low, presenting significant growth opportunities. The ongoing threat of influenza pandemics acts as a key growth driver, influencing both public health preparedness and pharmaceutical industry investments. Furthermore, increasing investments in research and development of new influenza treatments, as well as improved healthcare infrastructure in many regions are further stimulating market growth. The market penetration rate in developed countries is estimated to be approximately xx% in 2025, while in developing economies it stands at roughly xx%.
Dominant Markets & Segments in Oseltamivir Industry
Leading Region/Country: The North American region dominates the oseltamivir market, driven by high healthcare expenditure, advanced healthcare infrastructure, and strong public health initiatives.
Dominant Segment (By Product Type): Capsules represent the largest segment in terms of market share, owing to their ease of administration and established market presence.
Dominant Segment (By Application): Influenza A dominates the application segment, reflecting the higher prevalence of this strain and its association with severe illness.
Key Drivers of Regional Dominance:
- North America: High healthcare expenditure, well-established healthcare infrastructure, and high influenza prevalence rates.
- Europe: High awareness of influenza and strong public health campaigns.
- Asia-Pacific: Rising disposable incomes, improved healthcare access, and a growing elderly population.
Detailed Dominance Analysis: The dominance of North America stems from several factors including robust healthcare systems, high levels of influenza awareness, widespread vaccination programs, and a comparatively high per capita income. This region's developed infrastructure and extensive access to healthcare services facilitate efficient distribution and widespread access to oseltamivir. The capsule format has sustained market leadership due to its ease of consumption and long-standing presence in the market. Influenza A's dominance in application is attributable to its prevalence and potential severity, driving demand for effective antiviral treatments.
Oseltamivir Industry Product Innovations
Recent advancements in oseltamivir primarily focus on improving formulation, particularly for pediatric populations. The development of convenient and palatable oral suspensions has addressed challenges associated with administering capsules to children. Furthermore, research efforts are directed toward exploring combination therapies with other antiviral agents to enhance efficacy and overcome resistance. The emphasis is on improving patient compliance and expanding the therapeutic utility of oseltamivir in managing various influenza strains and patient demographics. These innovations contribute to improved market fit and sustain the drug’s competitiveness in the face of emerging alternative therapies.
Report Segmentation & Scope
This report segments the oseltamivir market by product type and application.
By Product Type:
Capsules: This segment is expected to witness xx Million in revenue in 2025 and maintain a significant market share due to its established presence and ease of use. Competitive dynamics are primarily driven by pricing strategies among generic manufacturers.
Suspension: The suspension segment is anticipated to reach xx Million in revenue by 2025 and is projected to experience strong growth, driven by increased demand in pediatric populations. Innovation in flavoring and palatability enhancement represents a key competitive differentiator.
Other Product Types: This segment includes other formulations and delivery systems, with projected revenue of xx Million in 2025. Future growth in this segment depends on technological advancements and the successful introduction of novel delivery systems.
By Application:
- Influenza A: This segment commands a major market share, reflecting the prevalence of Influenza A infections. The market size is predicted to reach xx Million in 2025.
- Influenza B: Market size for Influenza B is estimated at xx Million in 2025. Competitive dynamics are similar to Influenza A, with focus on efficacy and pricing.
- Other Applications: This segment includes off-label applications and research studies, with an estimated market size of xx Million in 2025.
Key Drivers of Oseltamivir Industry Growth
Several key factors fuel the growth of the oseltamivir industry: the increasing global prevalence of influenza, particularly during seasonal outbreaks and potential pandemics; the growing awareness among healthcare professionals and the public about the benefits of early antiviral treatment; and the sustained demand for effective treatment options for influenza, especially among vulnerable populations. Additionally, ongoing research and development efforts leading to improved formulations and potential combination therapies are contributing to market expansion. Finally, supportive government policies and public health initiatives, such as increased vaccination campaigns, promote usage.
Challenges in the Oseltamivir Industry Sector
The oseltamivir market faces challenges including the rise of drug-resistant influenza strains, reducing the effectiveness of treatment. The development of novel antiviral drugs offers competitive pressure. Fluctuations in influenza outbreaks lead to inconsistent demand, creating supply chain issues. Stringent regulatory processes can complicate and delay market entry for new products. Generic competition, especially in established markets, impacts pricing and profit margins. These factors together impose significant obstacles to consistent growth and profitability.
Leading Players in the Oseltamivir Industry Market
- Hetero Healthcare Limited
- F Hoffmann-La Roche Ltd
- Cipla Inc
- Gilead Sciences Inc
- NATCO Pharma Limited
- Strides Pharma Science Limited
- Amneal Pharmaceuticals LLC
- Lupin Limited
- Alembic Pharmaceuticals Limited
- Macleods Pharmaceuticals Ltd
- Zydus Cadila
Key Developments in Oseltamivir Industry Sector
October 2021: M.D. Anderson Cancer Center initiated a Phase II clinical study on the effect of baloxavir in combination with oseltamivir in treating severe influenza infection in patients who have previously received a hematopoietic (blood) stem cell transplant. This signifies exploration of combination therapies and potential expansion into niche patient groups.
January 2022: Strides Pharma Science Ltd received approval from the U.S. health regulator for its generic version of oseltamivir phosphate for oral suspension. This expands market competition and increases accessibility to affordable treatment.
Strategic Oseltamivir Industry Market Outlook
The future of the oseltamivir market hinges on adapting to evolving challenges. The development of next-generation antiviral therapies and the ongoing threat of influenza pandemics present both risks and opportunities. Strategic initiatives should focus on expanding into under-served markets, pursuing innovative formulations, and establishing robust supply chains to handle fluctuating demand. Further research into combination therapies and addressing drug resistance will be critical for sustaining market growth and ensuring the long-term relevance of oseltamivir. Exploration of personalized medicine approaches and targeted delivery systems also represent significant avenues for growth.
Oseltamivir Industry Segmentation
-
1. Product Type
- 1.1. Capsule
- 1.2. Suspension
- 1.3. Other Product Types
-
2. Industry vertical
- 2.1. Influenza A
- 2.2. Influenza B
- 2.3. Other
Oseltamivir Industry Segmentation By Geography
-
1. North America
- 1.1. United States
- 1.2. Canada
- 1.3. Mexico
-
2. Europe
- 2.1. Germany
- 2.2. United Kingdom
- 2.3. France
- 2.4. Italy
- 2.5. Spain
- 2.6. Rest of Europe
-
3. Asia Pacific
- 3.1. China
- 3.2. Japan
- 3.3. India
- 3.4. Australia
- 3.5. South Korea
- 3.6. Rest of Asia Pacific
-
4. Middle East and Africa
- 4.1. GCC
- 4.2. South Africa
- 4.3. Rest of Middle East and Africa
-
5. South America
- 5.1. Brazil
- 5.2. Argentina
- 5.3. Rest of South America
Oseltamivir Industry REPORT HIGHLIGHTS
| Aspects | Details |
|---|---|
| Study Period | 2019-2033 |
| Base Year | 2024 |
| Estimated Year | 2025 |
| Forecast Period | 2025-2033 |
| Historical Period | 2019-2024 |
| Growth Rate | CAGR of 3.20% from 2019-2033 |
| Segmentation |
|
Table of Contents
- 1. Introduction
- 1.1. Research Scope
- 1.2. Market Segmentation
- 1.3. Research Methodology
- 1.4. Definitions and Assumptions
- 2. Executive Summary
- 2.1. Introduction
- 3. Market Dynamics
- 3.1. Introduction
- 3.2. Market Drivers
- 3.2.1. Rising Prevalence of Influenza Virus Infections; Increase in the Number of Research and Development Activities
- 3.3. Market Restrains
- 3.3.1. Side Effects Associated with Oseltamivir Treatment
- 3.4. Market Trends
- 3.4.1. Influenza A Segment Expects to Register a High CAGR Over the Forecast Period
- 4. Market Factor Analysis
- 4.1. Porters Five Forces
- 4.2. Supply/Value Chain
- 4.3. PESTEL analysis
- 4.4. Market Entropy
- 4.5. Patent/Trademark Analysis
- 5. Global Oseltamivir Industry Analysis, Insights and Forecast, 2019-2031
- 5.1. Market Analysis, Insights and Forecast - by Product Type
- 5.1.1. Capsule
- 5.1.2. Suspension
- 5.1.3. Other Product Types
- 5.2. Market Analysis, Insights and Forecast - by Industry vertical
- 5.2.1. Influenza A
- 5.2.2. Influenza B
- 5.2.3. Other
- 5.3. Market Analysis, Insights and Forecast - by Region
- 5.3.1. North America
- 5.3.2. Europe
- 5.3.3. Asia Pacific
- 5.3.4. Middle East and Africa
- 5.3.5. South America
- 5.1. Market Analysis, Insights and Forecast - by Product Type
- 6. North America Oseltamivir Industry Analysis, Insights and Forecast, 2019-2031
- 6.1. Market Analysis, Insights and Forecast - by Product Type
- 6.1.1. Capsule
- 6.1.2. Suspension
- 6.1.3. Other Product Types
- 6.2. Market Analysis, Insights and Forecast - by Industry vertical
- 6.2.1. Influenza A
- 6.2.2. Influenza B
- 6.2.3. Other
- 6.1. Market Analysis, Insights and Forecast - by Product Type
- 7. Europe Oseltamivir Industry Analysis, Insights and Forecast, 2019-2031
- 7.1. Market Analysis, Insights and Forecast - by Product Type
- 7.1.1. Capsule
- 7.1.2. Suspension
- 7.1.3. Other Product Types
- 7.2. Market Analysis, Insights and Forecast - by Industry vertical
- 7.2.1. Influenza A
- 7.2.2. Influenza B
- 7.2.3. Other
- 7.1. Market Analysis, Insights and Forecast - by Product Type
- 8. Asia Pacific Oseltamivir Industry Analysis, Insights and Forecast, 2019-2031
- 8.1. Market Analysis, Insights and Forecast - by Product Type
- 8.1.1. Capsule
- 8.1.2. Suspension
- 8.1.3. Other Product Types
- 8.2. Market Analysis, Insights and Forecast - by Industry vertical
- 8.2.1. Influenza A
- 8.2.2. Influenza B
- 8.2.3. Other
- 8.1. Market Analysis, Insights and Forecast - by Product Type
- 9. Middle East and Africa Oseltamivir Industry Analysis, Insights and Forecast, 2019-2031
- 9.1. Market Analysis, Insights and Forecast - by Product Type
- 9.1.1. Capsule
- 9.1.2. Suspension
- 9.1.3. Other Product Types
- 9.2. Market Analysis, Insights and Forecast - by Industry vertical
- 9.2.1. Influenza A
- 9.2.2. Influenza B
- 9.2.3. Other
- 9.1. Market Analysis, Insights and Forecast - by Product Type
- 10. South America Oseltamivir Industry Analysis, Insights and Forecast, 2019-2031
- 10.1. Market Analysis, Insights and Forecast - by Product Type
- 10.1.1. Capsule
- 10.1.2. Suspension
- 10.1.3. Other Product Types
- 10.2. Market Analysis, Insights and Forecast - by Industry vertical
- 10.2.1. Influenza A
- 10.2.2. Influenza B
- 10.2.3. Other
- 10.1. Market Analysis, Insights and Forecast - by Product Type
- 11. North America Oseltamivir Industry Analysis, Insights and Forecast, 2019-2031
- 11.1. Market Analysis, Insights and Forecast - By Country/Sub-region
- 11.1.1 United States
- 11.1.2 Canada
- 11.1.3 Mexico
- 12. Europe Oseltamivir Industry Analysis, Insights and Forecast, 2019-2031
- 12.1. Market Analysis, Insights and Forecast - By Country/Sub-region
- 12.1.1 Germany
- 12.1.2 United Kingdom
- 12.1.3 France
- 12.1.4 Italy
- 12.1.5 Spain
- 12.1.6 Rest of Europe
- 13. Asia Pacific Oseltamivir Industry Analysis, Insights and Forecast, 2019-2031
- 13.1. Market Analysis, Insights and Forecast - By Country/Sub-region
- 13.1.1 China
- 13.1.2 Japan
- 13.1.3 India
- 13.1.4 Australia
- 13.1.5 South Korea
- 13.1.6 Rest of Asia Pacific
- 14. Middle East and Africa Oseltamivir Industry Analysis, Insights and Forecast, 2019-2031
- 14.1. Market Analysis, Insights and Forecast - By Country/Sub-region
- 14.1.1 GCC
- 14.1.2 South Africa
- 14.1.3 Rest of Middle East and Africa
- 15. South America Oseltamivir Industry Analysis, Insights and Forecast, 2019-2031
- 15.1. Market Analysis, Insights and Forecast - By Country/Sub-region
- 15.1.1 Brazil
- 15.1.2 Argentina
- 15.1.3 Rest of South America
- 16. Competitive Analysis
- 16.1. Global Market Share Analysis 2024
- 16.2. Company Profiles
- 16.2.1 Hetero Healthcare Limited
- 16.2.1.1. Overview
- 16.2.1.2. Products
- 16.2.1.3. SWOT Analysis
- 16.2.1.4. Recent Developments
- 16.2.1.5. Financials (Based on Availability)
- 16.2.2 F Hoffmann-La Roche Ltd
- 16.2.2.1. Overview
- 16.2.2.2. Products
- 16.2.2.3. SWOT Analysis
- 16.2.2.4. Recent Developments
- 16.2.2.5. Financials (Based on Availability)
- 16.2.3 Cipla Inc
- 16.2.3.1. Overview
- 16.2.3.2. Products
- 16.2.3.3. SWOT Analysis
- 16.2.3.4. Recent Developments
- 16.2.3.5. Financials (Based on Availability)
- 16.2.4 Gilead Sciences Inc
- 16.2.4.1. Overview
- 16.2.4.2. Products
- 16.2.4.3. SWOT Analysis
- 16.2.4.4. Recent Developments
- 16.2.4.5. Financials (Based on Availability)
- 16.2.5 NATCO Pharma Limited
- 16.2.5.1. Overview
- 16.2.5.2. Products
- 16.2.5.3. SWOT Analysis
- 16.2.5.4. Recent Developments
- 16.2.5.5. Financials (Based on Availability)
- 16.2.6 Strides Pharma Science Limited
- 16.2.6.1. Overview
- 16.2.6.2. Products
- 16.2.6.3. SWOT Analysis
- 16.2.6.4. Recent Developments
- 16.2.6.5. Financials (Based on Availability)
- 16.2.7 Amneal Pharmaceuticals LLC
- 16.2.7.1. Overview
- 16.2.7.2. Products
- 16.2.7.3. SWOT Analysis
- 16.2.7.4. Recent Developments
- 16.2.7.5. Financials (Based on Availability)
- 16.2.8 Lupin Limited
- 16.2.8.1. Overview
- 16.2.8.2. Products
- 16.2.8.3. SWOT Analysis
- 16.2.8.4. Recent Developments
- 16.2.8.5. Financials (Based on Availability)
- 16.2.9 Alembic Pharmaceuticals Limited
- 16.2.9.1. Overview
- 16.2.9.2. Products
- 16.2.9.3. SWOT Analysis
- 16.2.9.4. Recent Developments
- 16.2.9.5. Financials (Based on Availability)
- 16.2.10 Macleods Pharmaceuticals Ltd
- 16.2.10.1. Overview
- 16.2.10.2. Products
- 16.2.10.3. SWOT Analysis
- 16.2.10.4. Recent Developments
- 16.2.10.5. Financials (Based on Availability)
- 16.2.11 Zydus Cadila
- 16.2.11.1. Overview
- 16.2.11.2. Products
- 16.2.11.3. SWOT Analysis
- 16.2.11.4. Recent Developments
- 16.2.11.5. Financials (Based on Availability)
- 16.2.1 Hetero Healthcare Limited
List of Figures
- Figure 1: Global Oseltamivir Industry Revenue Breakdown (Million, %) by Region 2024 & 2032
- Figure 2: Global Oseltamivir Industry Volume Breakdown (K Unit, %) by Region 2024 & 2032
- Figure 3: North America Oseltamivir Industry Revenue (Million), by Country 2024 & 2032
- Figure 4: North America Oseltamivir Industry Volume (K Unit), by Country 2024 & 2032
- Figure 5: North America Oseltamivir Industry Revenue Share (%), by Country 2024 & 2032
- Figure 6: North America Oseltamivir Industry Volume Share (%), by Country 2024 & 2032
- Figure 7: Europe Oseltamivir Industry Revenue (Million), by Country 2024 & 2032
- Figure 8: Europe Oseltamivir Industry Volume (K Unit), by Country 2024 & 2032
- Figure 9: Europe Oseltamivir Industry Revenue Share (%), by Country 2024 & 2032
- Figure 10: Europe Oseltamivir Industry Volume Share (%), by Country 2024 & 2032
- Figure 11: Asia Pacific Oseltamivir Industry Revenue (Million), by Country 2024 & 2032
- Figure 12: Asia Pacific Oseltamivir Industry Volume (K Unit), by Country 2024 & 2032
- Figure 13: Asia Pacific Oseltamivir Industry Revenue Share (%), by Country 2024 & 2032
- Figure 14: Asia Pacific Oseltamivir Industry Volume Share (%), by Country 2024 & 2032
- Figure 15: Middle East and Africa Oseltamivir Industry Revenue (Million), by Country 2024 & 2032
- Figure 16: Middle East and Africa Oseltamivir Industry Volume (K Unit), by Country 2024 & 2032
- Figure 17: Middle East and Africa Oseltamivir Industry Revenue Share (%), by Country 2024 & 2032
- Figure 18: Middle East and Africa Oseltamivir Industry Volume Share (%), by Country 2024 & 2032
- Figure 19: South America Oseltamivir Industry Revenue (Million), by Country 2024 & 2032
- Figure 20: South America Oseltamivir Industry Volume (K Unit), by Country 2024 & 2032
- Figure 21: South America Oseltamivir Industry Revenue Share (%), by Country 2024 & 2032
- Figure 22: South America Oseltamivir Industry Volume Share (%), by Country 2024 & 2032
- Figure 23: North America Oseltamivir Industry Revenue (Million), by Product Type 2024 & 2032
- Figure 24: North America Oseltamivir Industry Volume (K Unit), by Product Type 2024 & 2032
- Figure 25: North America Oseltamivir Industry Revenue Share (%), by Product Type 2024 & 2032
- Figure 26: North America Oseltamivir Industry Volume Share (%), by Product Type 2024 & 2032
- Figure 27: North America Oseltamivir Industry Revenue (Million), by Industry vertical 2024 & 2032
- Figure 28: North America Oseltamivir Industry Volume (K Unit), by Industry vertical 2024 & 2032
- Figure 29: North America Oseltamivir Industry Revenue Share (%), by Industry vertical 2024 & 2032
- Figure 30: North America Oseltamivir Industry Volume Share (%), by Industry vertical 2024 & 2032
- Figure 31: North America Oseltamivir Industry Revenue (Million), by Country 2024 & 2032
- Figure 32: North America Oseltamivir Industry Volume (K Unit), by Country 2024 & 2032
- Figure 33: North America Oseltamivir Industry Revenue Share (%), by Country 2024 & 2032
- Figure 34: North America Oseltamivir Industry Volume Share (%), by Country 2024 & 2032
- Figure 35: Europe Oseltamivir Industry Revenue (Million), by Product Type 2024 & 2032
- Figure 36: Europe Oseltamivir Industry Volume (K Unit), by Product Type 2024 & 2032
- Figure 37: Europe Oseltamivir Industry Revenue Share (%), by Product Type 2024 & 2032
- Figure 38: Europe Oseltamivir Industry Volume Share (%), by Product Type 2024 & 2032
- Figure 39: Europe Oseltamivir Industry Revenue (Million), by Industry vertical 2024 & 2032
- Figure 40: Europe Oseltamivir Industry Volume (K Unit), by Industry vertical 2024 & 2032
- Figure 41: Europe Oseltamivir Industry Revenue Share (%), by Industry vertical 2024 & 2032
- Figure 42: Europe Oseltamivir Industry Volume Share (%), by Industry vertical 2024 & 2032
- Figure 43: Europe Oseltamivir Industry Revenue (Million), by Country 2024 & 2032
- Figure 44: Europe Oseltamivir Industry Volume (K Unit), by Country 2024 & 2032
- Figure 45: Europe Oseltamivir Industry Revenue Share (%), by Country 2024 & 2032
- Figure 46: Europe Oseltamivir Industry Volume Share (%), by Country 2024 & 2032
- Figure 47: Asia Pacific Oseltamivir Industry Revenue (Million), by Product Type 2024 & 2032
- Figure 48: Asia Pacific Oseltamivir Industry Volume (K Unit), by Product Type 2024 & 2032
- Figure 49: Asia Pacific Oseltamivir Industry Revenue Share (%), by Product Type 2024 & 2032
- Figure 50: Asia Pacific Oseltamivir Industry Volume Share (%), by Product Type 2024 & 2032
- Figure 51: Asia Pacific Oseltamivir Industry Revenue (Million), by Industry vertical 2024 & 2032
- Figure 52: Asia Pacific Oseltamivir Industry Volume (K Unit), by Industry vertical 2024 & 2032
- Figure 53: Asia Pacific Oseltamivir Industry Revenue Share (%), by Industry vertical 2024 & 2032
- Figure 54: Asia Pacific Oseltamivir Industry Volume Share (%), by Industry vertical 2024 & 2032
- Figure 55: Asia Pacific Oseltamivir Industry Revenue (Million), by Country 2024 & 2032
- Figure 56: Asia Pacific Oseltamivir Industry Volume (K Unit), by Country 2024 & 2032
- Figure 57: Asia Pacific Oseltamivir Industry Revenue Share (%), by Country 2024 & 2032
- Figure 58: Asia Pacific Oseltamivir Industry Volume Share (%), by Country 2024 & 2032
- Figure 59: Middle East and Africa Oseltamivir Industry Revenue (Million), by Product Type 2024 & 2032
- Figure 60: Middle East and Africa Oseltamivir Industry Volume (K Unit), by Product Type 2024 & 2032
- Figure 61: Middle East and Africa Oseltamivir Industry Revenue Share (%), by Product Type 2024 & 2032
- Figure 62: Middle East and Africa Oseltamivir Industry Volume Share (%), by Product Type 2024 & 2032
- Figure 63: Middle East and Africa Oseltamivir Industry Revenue (Million), by Industry vertical 2024 & 2032
- Figure 64: Middle East and Africa Oseltamivir Industry Volume (K Unit), by Industry vertical 2024 & 2032
- Figure 65: Middle East and Africa Oseltamivir Industry Revenue Share (%), by Industry vertical 2024 & 2032
- Figure 66: Middle East and Africa Oseltamivir Industry Volume Share (%), by Industry vertical 2024 & 2032
- Figure 67: Middle East and Africa Oseltamivir Industry Revenue (Million), by Country 2024 & 2032
- Figure 68: Middle East and Africa Oseltamivir Industry Volume (K Unit), by Country 2024 & 2032
- Figure 69: Middle East and Africa Oseltamivir Industry Revenue Share (%), by Country 2024 & 2032
- Figure 70: Middle East and Africa Oseltamivir Industry Volume Share (%), by Country 2024 & 2032
- Figure 71: South America Oseltamivir Industry Revenue (Million), by Product Type 2024 & 2032
- Figure 72: South America Oseltamivir Industry Volume (K Unit), by Product Type 2024 & 2032
- Figure 73: South America Oseltamivir Industry Revenue Share (%), by Product Type 2024 & 2032
- Figure 74: South America Oseltamivir Industry Volume Share (%), by Product Type 2024 & 2032
- Figure 75: South America Oseltamivir Industry Revenue (Million), by Industry vertical 2024 & 2032
- Figure 76: South America Oseltamivir Industry Volume (K Unit), by Industry vertical 2024 & 2032
- Figure 77: South America Oseltamivir Industry Revenue Share (%), by Industry vertical 2024 & 2032
- Figure 78: South America Oseltamivir Industry Volume Share (%), by Industry vertical 2024 & 2032
- Figure 79: South America Oseltamivir Industry Revenue (Million), by Country 2024 & 2032
- Figure 80: South America Oseltamivir Industry Volume (K Unit), by Country 2024 & 2032
- Figure 81: South America Oseltamivir Industry Revenue Share (%), by Country 2024 & 2032
- Figure 82: South America Oseltamivir Industry Volume Share (%), by Country 2024 & 2032
List of Tables
- Table 1: Global Oseltamivir Industry Revenue Million Forecast, by Region 2019 & 2032
- Table 2: Global Oseltamivir Industry Volume K Unit Forecast, by Region 2019 & 2032
- Table 3: Global Oseltamivir Industry Revenue Million Forecast, by Product Type 2019 & 2032
- Table 4: Global Oseltamivir Industry Volume K Unit Forecast, by Product Type 2019 & 2032
- Table 5: Global Oseltamivir Industry Revenue Million Forecast, by Industry vertical 2019 & 2032
- Table 6: Global Oseltamivir Industry Volume K Unit Forecast, by Industry vertical 2019 & 2032
- Table 7: Global Oseltamivir Industry Revenue Million Forecast, by Region 2019 & 2032
- Table 8: Global Oseltamivir Industry Volume K Unit Forecast, by Region 2019 & 2032
- Table 9: Global Oseltamivir Industry Revenue Million Forecast, by Country 2019 & 2032
- Table 10: Global Oseltamivir Industry Volume K Unit Forecast, by Country 2019 & 2032
- Table 11: United States Oseltamivir Industry Revenue (Million) Forecast, by Application 2019 & 2032
- Table 12: United States Oseltamivir Industry Volume (K Unit) Forecast, by Application 2019 & 2032
- Table 13: Canada Oseltamivir Industry Revenue (Million) Forecast, by Application 2019 & 2032
- Table 14: Canada Oseltamivir Industry Volume (K Unit) Forecast, by Application 2019 & 2032
- Table 15: Mexico Oseltamivir Industry Revenue (Million) Forecast, by Application 2019 & 2032
- Table 16: Mexico Oseltamivir Industry Volume (K Unit) Forecast, by Application 2019 & 2032
- Table 17: Global Oseltamivir Industry Revenue Million Forecast, by Country 2019 & 2032
- Table 18: Global Oseltamivir Industry Volume K Unit Forecast, by Country 2019 & 2032
- Table 19: Germany Oseltamivir Industry Revenue (Million) Forecast, by Application 2019 & 2032
- Table 20: Germany Oseltamivir Industry Volume (K Unit) Forecast, by Application 2019 & 2032
- Table 21: United Kingdom Oseltamivir Industry Revenue (Million) Forecast, by Application 2019 & 2032
- Table 22: United Kingdom Oseltamivir Industry Volume (K Unit) Forecast, by Application 2019 & 2032
- Table 23: France Oseltamivir Industry Revenue (Million) Forecast, by Application 2019 & 2032
- Table 24: France Oseltamivir Industry Volume (K Unit) Forecast, by Application 2019 & 2032
- Table 25: Italy Oseltamivir Industry Revenue (Million) Forecast, by Application 2019 & 2032
- Table 26: Italy Oseltamivir Industry Volume (K Unit) Forecast, by Application 2019 & 2032
- Table 27: Spain Oseltamivir Industry Revenue (Million) Forecast, by Application 2019 & 2032
- Table 28: Spain Oseltamivir Industry Volume (K Unit) Forecast, by Application 2019 & 2032
- Table 29: Rest of Europe Oseltamivir Industry Revenue (Million) Forecast, by Application 2019 & 2032
- Table 30: Rest of Europe Oseltamivir Industry Volume (K Unit) Forecast, by Application 2019 & 2032
- Table 31: Global Oseltamivir Industry Revenue Million Forecast, by Country 2019 & 2032
- Table 32: Global Oseltamivir Industry Volume K Unit Forecast, by Country 2019 & 2032
- Table 33: China Oseltamivir Industry Revenue (Million) Forecast, by Application 2019 & 2032
- Table 34: China Oseltamivir Industry Volume (K Unit) Forecast, by Application 2019 & 2032
- Table 35: Japan Oseltamivir Industry Revenue (Million) Forecast, by Application 2019 & 2032
- Table 36: Japan Oseltamivir Industry Volume (K Unit) Forecast, by Application 2019 & 2032
- Table 37: India Oseltamivir Industry Revenue (Million) Forecast, by Application 2019 & 2032
- Table 38: India Oseltamivir Industry Volume (K Unit) Forecast, by Application 2019 & 2032
- Table 39: Australia Oseltamivir Industry Revenue (Million) Forecast, by Application 2019 & 2032
- Table 40: Australia Oseltamivir Industry Volume (K Unit) Forecast, by Application 2019 & 2032
- Table 41: South Korea Oseltamivir Industry Revenue (Million) Forecast, by Application 2019 & 2032
- Table 42: South Korea Oseltamivir Industry Volume (K Unit) Forecast, by Application 2019 & 2032
- Table 43: Rest of Asia Pacific Oseltamivir Industry Revenue (Million) Forecast, by Application 2019 & 2032
- Table 44: Rest of Asia Pacific Oseltamivir Industry Volume (K Unit) Forecast, by Application 2019 & 2032
- Table 45: Global Oseltamivir Industry Revenue Million Forecast, by Country 2019 & 2032
- Table 46: Global Oseltamivir Industry Volume K Unit Forecast, by Country 2019 & 2032
- Table 47: GCC Oseltamivir Industry Revenue (Million) Forecast, by Application 2019 & 2032
- Table 48: GCC Oseltamivir Industry Volume (K Unit) Forecast, by Application 2019 & 2032
- Table 49: South Africa Oseltamivir Industry Revenue (Million) Forecast, by Application 2019 & 2032
- Table 50: South Africa Oseltamivir Industry Volume (K Unit) Forecast, by Application 2019 & 2032
- Table 51: Rest of Middle East and Africa Oseltamivir Industry Revenue (Million) Forecast, by Application 2019 & 2032
- Table 52: Rest of Middle East and Africa Oseltamivir Industry Volume (K Unit) Forecast, by Application 2019 & 2032
- Table 53: Global Oseltamivir Industry Revenue Million Forecast, by Country 2019 & 2032
- Table 54: Global Oseltamivir Industry Volume K Unit Forecast, by Country 2019 & 2032
- Table 55: Brazil Oseltamivir Industry Revenue (Million) Forecast, by Application 2019 & 2032
- Table 56: Brazil Oseltamivir Industry Volume (K Unit) Forecast, by Application 2019 & 2032
- Table 57: Argentina Oseltamivir Industry Revenue (Million) Forecast, by Application 2019 & 2032
- Table 58: Argentina Oseltamivir Industry Volume (K Unit) Forecast, by Application 2019 & 2032
- Table 59: Rest of South America Oseltamivir Industry Revenue (Million) Forecast, by Application 2019 & 2032
- Table 60: Rest of South America Oseltamivir Industry Volume (K Unit) Forecast, by Application 2019 & 2032
- Table 61: Global Oseltamivir Industry Revenue Million Forecast, by Product Type 2019 & 2032
- Table 62: Global Oseltamivir Industry Volume K Unit Forecast, by Product Type 2019 & 2032
- Table 63: Global Oseltamivir Industry Revenue Million Forecast, by Industry vertical 2019 & 2032
- Table 64: Global Oseltamivir Industry Volume K Unit Forecast, by Industry vertical 2019 & 2032
- Table 65: Global Oseltamivir Industry Revenue Million Forecast, by Country 2019 & 2032
- Table 66: Global Oseltamivir Industry Volume K Unit Forecast, by Country 2019 & 2032
- Table 67: United States Oseltamivir Industry Revenue (Million) Forecast, by Application 2019 & 2032
- Table 68: United States Oseltamivir Industry Volume (K Unit) Forecast, by Application 2019 & 2032
- Table 69: Canada Oseltamivir Industry Revenue (Million) Forecast, by Application 2019 & 2032
- Table 70: Canada Oseltamivir Industry Volume (K Unit) Forecast, by Application 2019 & 2032
- Table 71: Mexico Oseltamivir Industry Revenue (Million) Forecast, by Application 2019 & 2032
- Table 72: Mexico Oseltamivir Industry Volume (K Unit) Forecast, by Application 2019 & 2032
- Table 73: Global Oseltamivir Industry Revenue Million Forecast, by Product Type 2019 & 2032
- Table 74: Global Oseltamivir Industry Volume K Unit Forecast, by Product Type 2019 & 2032
- Table 75: Global Oseltamivir Industry Revenue Million Forecast, by Industry vertical 2019 & 2032
- Table 76: Global Oseltamivir Industry Volume K Unit Forecast, by Industry vertical 2019 & 2032
- Table 77: Global Oseltamivir Industry Revenue Million Forecast, by Country 2019 & 2032
- Table 78: Global Oseltamivir Industry Volume K Unit Forecast, by Country 2019 & 2032
- Table 79: Germany Oseltamivir Industry Revenue (Million) Forecast, by Application 2019 & 2032
- Table 80: Germany Oseltamivir Industry Volume (K Unit) Forecast, by Application 2019 & 2032
- Table 81: United Kingdom Oseltamivir Industry Revenue (Million) Forecast, by Application 2019 & 2032
- Table 82: United Kingdom Oseltamivir Industry Volume (K Unit) Forecast, by Application 2019 & 2032
- Table 83: France Oseltamivir Industry Revenue (Million) Forecast, by Application 2019 & 2032
- Table 84: France Oseltamivir Industry Volume (K Unit) Forecast, by Application 2019 & 2032
- Table 85: Italy Oseltamivir Industry Revenue (Million) Forecast, by Application 2019 & 2032
- Table 86: Italy Oseltamivir Industry Volume (K Unit) Forecast, by Application 2019 & 2032
- Table 87: Spain Oseltamivir Industry Revenue (Million) Forecast, by Application 2019 & 2032
- Table 88: Spain Oseltamivir Industry Volume (K Unit) Forecast, by Application 2019 & 2032
- Table 89: Rest of Europe Oseltamivir Industry Revenue (Million) Forecast, by Application 2019 & 2032
- Table 90: Rest of Europe Oseltamivir Industry Volume (K Unit) Forecast, by Application 2019 & 2032
- Table 91: Global Oseltamivir Industry Revenue Million Forecast, by Product Type 2019 & 2032
- Table 92: Global Oseltamivir Industry Volume K Unit Forecast, by Product Type 2019 & 2032
- Table 93: Global Oseltamivir Industry Revenue Million Forecast, by Industry vertical 2019 & 2032
- Table 94: Global Oseltamivir Industry Volume K Unit Forecast, by Industry vertical 2019 & 2032
- Table 95: Global Oseltamivir Industry Revenue Million Forecast, by Country 2019 & 2032
- Table 96: Global Oseltamivir Industry Volume K Unit Forecast, by Country 2019 & 2032
- Table 97: China Oseltamivir Industry Revenue (Million) Forecast, by Application 2019 & 2032
- Table 98: China Oseltamivir Industry Volume (K Unit) Forecast, by Application 2019 & 2032
- Table 99: Japan Oseltamivir Industry Revenue (Million) Forecast, by Application 2019 & 2032
- Table 100: Japan Oseltamivir Industry Volume (K Unit) Forecast, by Application 2019 & 2032
- Table 101: India Oseltamivir Industry Revenue (Million) Forecast, by Application 2019 & 2032
- Table 102: India Oseltamivir Industry Volume (K Unit) Forecast, by Application 2019 & 2032
- Table 103: Australia Oseltamivir Industry Revenue (Million) Forecast, by Application 2019 & 2032
- Table 104: Australia Oseltamivir Industry Volume (K Unit) Forecast, by Application 2019 & 2032
- Table 105: South Korea Oseltamivir Industry Revenue (Million) Forecast, by Application 2019 & 2032
- Table 106: South Korea Oseltamivir Industry Volume (K Unit) Forecast, by Application 2019 & 2032
- Table 107: Rest of Asia Pacific Oseltamivir Industry Revenue (Million) Forecast, by Application 2019 & 2032
- Table 108: Rest of Asia Pacific Oseltamivir Industry Volume (K Unit) Forecast, by Application 2019 & 2032
- Table 109: Global Oseltamivir Industry Revenue Million Forecast, by Product Type 2019 & 2032
- Table 110: Global Oseltamivir Industry Volume K Unit Forecast, by Product Type 2019 & 2032
- Table 111: Global Oseltamivir Industry Revenue Million Forecast, by Industry vertical 2019 & 2032
- Table 112: Global Oseltamivir Industry Volume K Unit Forecast, by Industry vertical 2019 & 2032
- Table 113: Global Oseltamivir Industry Revenue Million Forecast, by Country 2019 & 2032
- Table 114: Global Oseltamivir Industry Volume K Unit Forecast, by Country 2019 & 2032
- Table 115: GCC Oseltamivir Industry Revenue (Million) Forecast, by Application 2019 & 2032
- Table 116: GCC Oseltamivir Industry Volume (K Unit) Forecast, by Application 2019 & 2032
- Table 117: South Africa Oseltamivir Industry Revenue (Million) Forecast, by Application 2019 & 2032
- Table 118: South Africa Oseltamivir Industry Volume (K Unit) Forecast, by Application 2019 & 2032
- Table 119: Rest of Middle East and Africa Oseltamivir Industry Revenue (Million) Forecast, by Application 2019 & 2032
- Table 120: Rest of Middle East and Africa Oseltamivir Industry Volume (K Unit) Forecast, by Application 2019 & 2032
- Table 121: Global Oseltamivir Industry Revenue Million Forecast, by Product Type 2019 & 2032
- Table 122: Global Oseltamivir Industry Volume K Unit Forecast, by Product Type 2019 & 2032
- Table 123: Global Oseltamivir Industry Revenue Million Forecast, by Industry vertical 2019 & 2032
- Table 124: Global Oseltamivir Industry Volume K Unit Forecast, by Industry vertical 2019 & 2032
- Table 125: Global Oseltamivir Industry Revenue Million Forecast, by Country 2019 & 2032
- Table 126: Global Oseltamivir Industry Volume K Unit Forecast, by Country 2019 & 2032
- Table 127: Brazil Oseltamivir Industry Revenue (Million) Forecast, by Application 2019 & 2032
- Table 128: Brazil Oseltamivir Industry Volume (K Unit) Forecast, by Application 2019 & 2032
- Table 129: Argentina Oseltamivir Industry Revenue (Million) Forecast, by Application 2019 & 2032
- Table 130: Argentina Oseltamivir Industry Volume (K Unit) Forecast, by Application 2019 & 2032
- Table 131: Rest of South America Oseltamivir Industry Revenue (Million) Forecast, by Application 2019 & 2032
- Table 132: Rest of South America Oseltamivir Industry Volume (K Unit) Forecast, by Application 2019 & 2032
Frequently Asked Questions
1. What is the projected Compound Annual Growth Rate (CAGR) of the Oseltamivir Industry?
The projected CAGR is approximately 3.20%.
2. Which companies are prominent players in the Oseltamivir Industry?
Key companies in the market include Hetero Healthcare Limited, F Hoffmann-La Roche Ltd, Cipla Inc, Gilead Sciences Inc, NATCO Pharma Limited, Strides Pharma Science Limited, Amneal Pharmaceuticals LLC, Lupin Limited, Alembic Pharmaceuticals Limited, Macleods Pharmaceuticals Ltd, Zydus Cadila.
3. What are the main segments of the Oseltamivir Industry?
The market segments include Product Type, Industry vertical.
4. Can you provide details about the market size?
The market size is estimated to be USD XX Million as of 2022.
5. What are some drivers contributing to market growth?
Rising Prevalence of Influenza Virus Infections; Increase in the Number of Research and Development Activities.
6. What are the notable trends driving market growth?
Influenza A Segment Expects to Register a High CAGR Over the Forecast Period.
7. Are there any restraints impacting market growth?
Side Effects Associated with Oseltamivir Treatment.
8. Can you provide examples of recent developments in the market?
October 2021: M.D. Anderson Cancer Center initiated a Phase II clinical study on the effect of baloxavir in combination with oseltamivir in treating severe influenza infection in patients who have previously received a hematopoietic (blood) stem cell transplant.
9. What pricing options are available for accessing the report?
Pricing options include single-user, multi-user, and enterprise licenses priced at USD 4750, USD 5250, and USD 8750 respectively.
10. Is the market size provided in terms of value or volume?
The market size is provided in terms of value, measured in Million and volume, measured in K Unit.
11. Are there any specific market keywords associated with the report?
Yes, the market keyword associated with the report is "Oseltamivir Industry," which aids in identifying and referencing the specific market segment covered.
12. How do I determine which pricing option suits my needs best?
The pricing options vary based on user requirements and access needs. Individual users may opt for single-user licenses, while businesses requiring broader access may choose multi-user or enterprise licenses for cost-effective access to the report.
13. Are there any additional resources or data provided in the Oseltamivir Industry report?
While the report offers comprehensive insights, it's advisable to review the specific contents or supplementary materials provided to ascertain if additional resources or data are available.
14. How can I stay updated on further developments or reports in the Oseltamivir Industry?
To stay informed about further developments, trends, and reports in the Oseltamivir Industry, consider subscribing to industry newsletters, following relevant companies and organizations, or regularly checking reputable industry news sources and publications.
Methodology
Step 1 - Identification of Relevant Samples Size from Population Database


Step 2 - Approaches for Defining Global Market Size (Value, Volume* & Price*)

Note*: In applicable scenarios
Step 3 - Data Sources
Primary Research
- Web Analytics
- Survey Reports
- Research Institute
- Latest Research Reports
- Opinion Leaders
Secondary Research
- Annual Reports
- White Paper
- Latest Press Release
- Industry Association
- Paid Database
- Investor Presentations

Step 4 - Data Triangulation
Involves using different sources of information in order to increase the validity of a study
These sources are likely to be stakeholders in a program - participants, other researchers, program staff, other community members, and so on.
Then we put all data in single framework & apply various statistical tools to find out the dynamic on the market.
During the analysis stage, feedback from the stakeholder groups would be compared to determine areas of agreement as well as areas of divergence


