
Key Insights
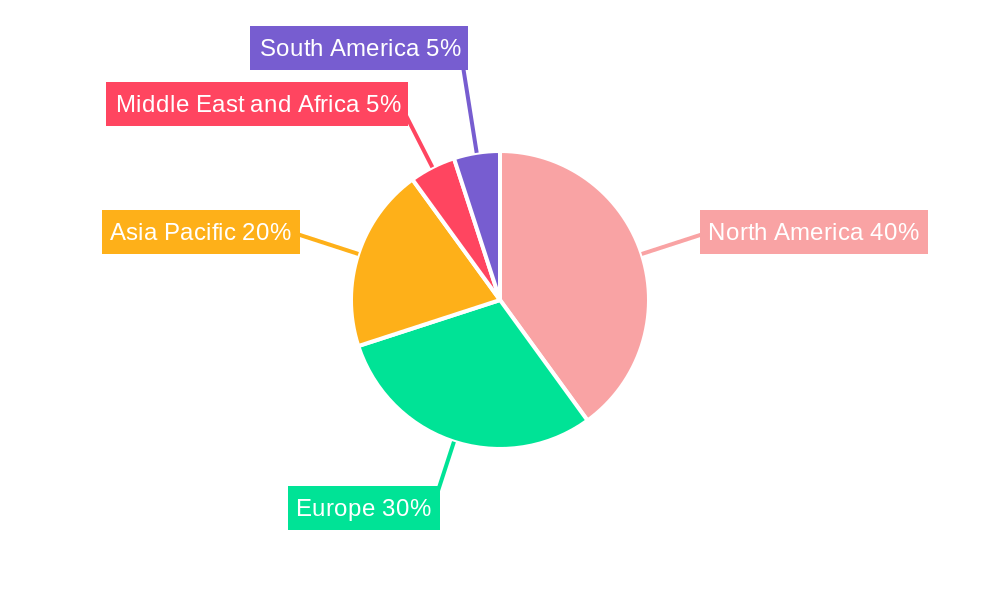
The global oral transmucosal drug market is experiencing robust growth, projected to reach a substantial size driven by several key factors. The market's 7.40% CAGR from 2019 to 2024 indicates a consistent upward trajectory, expected to continue throughout the forecast period (2025-2033). Rising prevalence of chronic conditions like opioid dependence, nausea and vomiting, erectile dysfunction, and neurological disorders fuels demand for effective and rapid-acting therapies offered by oral transmucosal drug delivery systems. Patient preference for non-invasive administration methods, coupled with improved bioavailability and faster onset of action compared to oral or intravenous routes, further contributes to market expansion. The market is segmented by product type (tablets, films, liquids & sprays, others), route of administration (sublingual, buccal, others), indication, and distribution channel (hospital, retail, online pharmacies). The segment breakdown reveals significant growth potential across all categories, particularly in tablets and films due to their ease of use and patient acceptance. North America currently holds a significant market share, driven by high healthcare expenditure and advanced healthcare infrastructure. However, the Asia Pacific region demonstrates rapid growth potential due to expanding healthcare facilities and rising disposable incomes. Key players like Sunovion Pharmaceuticals, Novartis, and Pfizer are actively engaged in research and development, driving innovation and competition within the market. The market faces challenges including stringent regulatory approvals and high research and development costs; nevertheless, the overall outlook remains optimistic with considerable opportunities for market expansion and innovation.
The strategic approach of pharmaceutical companies in focusing on developing novel formulations and expanding their product portfolios in various therapeutic areas significantly impacts market growth. The increasing adoption of online pharmacies is also expected to contribute to market expansion, offering convenient access to medications. However, potential restraints include the risk of side effects associated with certain oral transmucosal drugs and the price sensitivity of patients and healthcare providers. Further market segmentation analysis reveals distinct growth patterns across various regions and indications. Specifically, the increasing prevalence of neurological disorders and the growing geriatric population are expected to create a high demand for effective and convenient oral transmucosal therapies in the years to come. Continuous technological advancements, such as improved drug delivery systems and novel formulation technologies, will play a key role in driving future market growth and expansion. Competitive landscape analysis suggests a dynamic environment with both established and emerging players focusing on research and development, strategic partnerships, and geographic expansion to maintain their market position and capitalize on emerging opportunities.

Oral Transmucosal Drugs Market: A Comprehensive Report (2019-2033)
This comprehensive report provides an in-depth analysis of the global Oral Transmucosal Drugs market, offering invaluable insights for stakeholders across the pharmaceutical industry. The study covers the period from 2019 to 2033, with a focus on the forecast period from 2025 to 2033, utilizing 2025 as the base year and estimated year. The report segments the market by product type, route of administration, indication, and distribution channel, providing a granular understanding of market dynamics and growth potential. Key players analyzed include Sunovion Pharmaceuticals Inc, Seoul Pharmaceuticals, Shilpa Therapeutics, Novartis AG, Aquestive Therapeutics Inc, ZIM Laboratories Limited, GW Pharmaceuticals plc, C L Pharm Co Ltd, IntelGenx Corp, and Pfizer Inc. The report projects a market value of xx Million by 2033, driven by factors explored in detail within.
Oral Transmucosal Drugs Market Market Structure & Competitive Dynamics
The oral transmucosal drugs market exhibits a moderately concentrated structure, with a few major players holding significant market share. Market concentration is influenced by factors such as strong intellectual property protection, high R&D investments, and stringent regulatory approvals. The market's innovation ecosystem is dynamic, with continuous efforts towards developing novel formulations and exploring new therapeutic applications. Regulatory frameworks vary across geographies, impacting market entry and product approvals. The market also faces competition from alternative drug delivery systems. End-user preferences are shifting towards more convenient and faster-acting formulations, driving demand for oral transmucosal drugs. M&A activities are relatively frequent, with larger companies acquiring smaller biotech firms to expand their product portfolios and enhance their market presence. While precise M&A deal values are confidential, estimated aggregate deal values for the historical period (2019-2024) reached approximately xx Million, with an anticipated increase of xx% during the forecast period. Market share data for key players shows that the top 5 companies hold approximately xx% of the overall market.
Oral Transmucosal Drugs Market Industry Trends & Insights
The global oral transmucosal drugs market is experiencing robust growth, with a projected Compound Annual Growth Rate (CAGR) of xx% during the forecast period (2025-2033). This growth is primarily driven by factors such as the increasing prevalence of chronic diseases requiring convenient and rapid drug delivery, technological advancements leading to improved formulations and enhanced patient compliance, and rising demand for personalized medicine. The market is witnessing significant technological disruptions, with the introduction of novel drug delivery systems, including advanced film formulations and innovative spray technologies. These advancements are improving drug absorption, reducing side effects, and enhancing patient experience. Consumer preferences are shifting towards more convenient and user-friendly drug delivery methods, which favors the adoption of oral transmucosal drugs. Furthermore, increasing healthcare expenditure and favorable reimbursement policies in several regions are fueling market expansion. The market penetration of oral transmucosal drugs is expected to increase from xx% in 2025 to xx% by 2033, driven by rising awareness among healthcare professionals and patients about the benefits of this drug delivery route. Competitive dynamics remain intense, with companies focusing on product innovation, strategic partnerships, and geographic expansion to gain a competitive edge.

Dominant Markets & Segments in Oral Transmucosal Drugs Market
Leading Region: North America currently holds the largest market share, driven by high healthcare expenditure, technological advancements, and a robust regulatory environment. Europe is another significant market, exhibiting substantial growth potential.
Dominant Segments:
- By Product Type: Oral films are projected to be the dominant segment, owing to their ease of use, rapid onset of action, and improved patient compliance compared to traditional tablets.
- By Route of Administration: Sublingual mucosa administration holds the largest share, due to its rich vascularization and faster absorption rate.
- By Indication: The market for oral transmucosal drugs used in the treatment of opioid dependence is anticipated to show strong growth, driven by rising concerns about opioid abuse. The segment for erectile dysfunction treatment is also projected to experience robust growth.
- By Distribution Channel: Retail pharmacies account for the largest share of the distribution channel, however, online pharmacies are experiencing rapid growth, driven by the increasing use of e-commerce platforms and telemedicine.
Key drivers in dominant regions include robust healthcare infrastructure, strong government support for pharmaceutical innovation, and high rates of chronic disease prevalence. The dominance of specific segments reflects factors such as efficacy, convenience, patient preference, and market penetration of relevant therapeutic areas.
Oral Transmucosal Drugs Market Product Innovations
Recent years have witnessed significant advancements in oral transmucosal drug delivery systems. New formulations, including rapidly dissolving tablets, thin films, and innovative sprays, are being developed to enhance bioavailability, improve patient compliance, and minimize side effects. These advancements leverage nanotechnology, microencapsulation, and other technologies to improve drug delivery efficiency. The focus is on developing personalized therapies, optimizing drug release profiles, and creating more patient-friendly products. These innovations are improving the overall market competitiveness and shaping future market growth trajectories.
Report Segmentation & Scope
This report segments the oral transmucosal drugs market comprehensively across four key parameters:
By Product Type: Tablets, Films, Liquid & Spray, Others. Each segment exhibits varying growth rates, influenced by factors such as manufacturing complexity, ease of administration, and patient acceptance. The films segment shows the highest growth projection.
By Route of Administration: Sublingual Mucosa, Buccal Mucosa, Others. Sublingual and buccal administration are projected to dominate due to their rapid absorption and convenience.
By Indication: Opioid Dependence, Nausea and Vomiting, Erectile Dysfunction, Neurological Disorders, Others. The market is highly fragmented based on indication, reflecting the wide range of therapeutic applications for this drug delivery system. Opioid dependence and neurological disorders are key growth areas.
By Distribution Channel: Hospital Pharmacies, Retail Pharmacies, Online Pharmacies. Retail pharmacies currently hold the largest market share, but the online segment is exhibiting the highest growth rate.
Key Drivers of Oral Transmucosal Drugs Market Growth
The oral transmucosal drugs market is propelled by several key factors. Technological advancements, such as the development of innovative drug delivery systems, are improving drug absorption and patient compliance. The rising prevalence of chronic diseases requiring rapid drug delivery also fuels market expansion. Favorable regulatory environments in certain regions, along with increasing healthcare expenditure, further contribute to growth. Finally, the increasing demand for personalized medicine is creating opportunities for tailored oral transmucosal drug formulations.
Challenges in the Oral Transmucosal Drugs Market Sector
The oral transmucosal drugs market faces certain challenges, including stringent regulatory approvals and complex manufacturing processes, potentially resulting in higher production costs. The development of robust and stable formulations can also present technical hurdles. Competition from other drug delivery systems, such as injectables and transdermal patches, also poses a challenge. The market is also subject to supply chain disruptions, which can impact the availability of raw materials and finished products. These factors collectively influence market expansion and growth trajectories.
Leading Players in the Oral Transmucosal Drugs Market Market
- Sunovion Pharmaceuticals Inc
- Seoul Pharmaceuticals
- Shilpa Therapeutics
- Novartis AG
- Aquestive Therapeutics Inc
- ZIM Laboratories Limited
- GW Pharmaceuticals plc
- C L Pharm Co Ltd
- IntelGenx Corp
- Pfizer Inc
Key Developments in Oral Transmucosal Drugs Market Sector
- September 2021: IntelGenx Corp. launched RIZAPORT (rizatriptan benzoate oral film) in Spain, partnering with Exeltis Healthcare S.L. in the European Union.
- January 2021: CURE Pharmaceutical's CUREfilm Blue (sildenafil citrate oral film) received FDA Investigational New Drug (IND) application approval for erectile dysfunction treatment.
Strategic Oral Transmucosal Drugs Market Market Outlook
The oral transmucosal drugs market is poised for continued growth, driven by ongoing innovation in drug delivery technologies, expanding therapeutic applications, and increasing patient demand for convenient and effective treatment options. Strategic opportunities exist in developing personalized therapies, exploring novel drug formulations, and expanding into emerging markets. Companies that focus on research and development, strategic partnerships, and efficient manufacturing processes are expected to thrive in this dynamic market. The market's future potential is substantial, offering significant opportunities for growth and innovation.
Oral Transmucosal Drugs Market Segmentation
-
1. Product Type
- 1.1. Tablets
- 1.2. Films
- 1.3. Liquid & Spray
- 1.4. Others
-
2. Route of Administration
- 2.1. Sublingual Mucosa
- 2.2. Buccal Mucosa
- 2.3. Others
-
3. Indication
- 3.1. Opioid Dependence
- 3.2. Nausea and Vomiting
- 3.3. Erectile Dysfunction
- 3.4. Neurological Disorders
- 3.5. Others
-
4. Distribution Channel
- 4.1. Hospital Pharmacies
- 4.2. Retail Pharmacies
- 4.3. Online Pharmacies
Oral Transmucosal Drugs Market Segmentation By Geography
-
1. North America
- 1.1. United States
- 1.2. Canada
- 1.3. Mexico
-
2. Europe
- 2.1. Germany
- 2.2. United Kingdom
- 2.3. France
- 2.4. Italy
- 2.5. Spain
- 2.6. Rest of Europe
-
3. Asia Pacific
- 3.1. China
- 3.2. Japan
- 3.3. India
- 3.4. Australia
- 3.5. South Korea
- 3.6. Rest of Asia Pacific
-
4. Middle East and Africa
- 4.1. GCC
- 4.2. South Africa
- 4.3. Rest of Middle East and Africa
-
5. South America
- 5.1. Brazil
- 5.2. Argentina
- 5.3. Rest of South America
Oral Transmucosal Drugs Market REPORT HIGHLIGHTS
| Aspects | Details |
|---|---|
| Study Period | 2019-2033 |
| Base Year | 2024 |
| Estimated Year | 2025 |
| Forecast Period | 2025-2033 |
| Historical Period | 2019-2024 |
| Growth Rate | CAGR of 7.40% from 2019-2033 |
| Segmentation |
|
Table of Contents
- 1. Introduction
- 1.1. Research Scope
- 1.2. Market Segmentation
- 1.3. Research Methodology
- 1.4. Definitions and Assumptions
- 2. Executive Summary
- 2.1. Introduction
- 3. Market Dynamics
- 3.1. Introduction
- 3.2. Market Drivers
- 3.2.1. Growing Burden of Target Diseases; Rise in R&D Activities and Product Launches
- 3.3. Market Restrains
- 3.3.1. Disadvantages Associated With Oral Transmucosal Drug Delivery
- 3.4. Market Trends
- 3.4.1. Tablets segment is Expected to Hold a Significant Share Over the Forecast Period
- 4. Market Factor Analysis
- 4.1. Porters Five Forces
- 4.2. Supply/Value Chain
- 4.3. PESTEL analysis
- 4.4. Market Entropy
- 4.5. Patent/Trademark Analysis
- 5. Global Oral Transmucosal Drugs Market Analysis, Insights and Forecast, 2019-2031
- 5.1. Market Analysis, Insights and Forecast - by Product Type
- 5.1.1. Tablets
- 5.1.2. Films
- 5.1.3. Liquid & Spray
- 5.1.4. Others
- 5.2. Market Analysis, Insights and Forecast - by Route of Administration
- 5.2.1. Sublingual Mucosa
- 5.2.2. Buccal Mucosa
- 5.2.3. Others
- 5.3. Market Analysis, Insights and Forecast - by Indication
- 5.3.1. Opioid Dependence
- 5.3.2. Nausea and Vomiting
- 5.3.3. Erectile Dysfunction
- 5.3.4. Neurological Disorders
- 5.3.5. Others
- 5.4. Market Analysis, Insights and Forecast - by Distribution Channel
- 5.4.1. Hospital Pharmacies
- 5.4.2. Retail Pharmacies
- 5.4.3. Online Pharmacies
- 5.5. Market Analysis, Insights and Forecast - by Region
- 5.5.1. North America
- 5.5.2. Europe
- 5.5.3. Asia Pacific
- 5.5.4. Middle East and Africa
- 5.5.5. South America
- 5.1. Market Analysis, Insights and Forecast - by Product Type
- 6. North America Oral Transmucosal Drugs Market Analysis, Insights and Forecast, 2019-2031
- 6.1. Market Analysis, Insights and Forecast - by Product Type
- 6.1.1. Tablets
- 6.1.2. Films
- 6.1.3. Liquid & Spray
- 6.1.4. Others
- 6.2. Market Analysis, Insights and Forecast - by Route of Administration
- 6.2.1. Sublingual Mucosa
- 6.2.2. Buccal Mucosa
- 6.2.3. Others
- 6.3. Market Analysis, Insights and Forecast - by Indication
- 6.3.1. Opioid Dependence
- 6.3.2. Nausea and Vomiting
- 6.3.3. Erectile Dysfunction
- 6.3.4. Neurological Disorders
- 6.3.5. Others
- 6.4. Market Analysis, Insights and Forecast - by Distribution Channel
- 6.4.1. Hospital Pharmacies
- 6.4.2. Retail Pharmacies
- 6.4.3. Online Pharmacies
- 6.1. Market Analysis, Insights and Forecast - by Product Type
- 7. Europe Oral Transmucosal Drugs Market Analysis, Insights and Forecast, 2019-2031
- 7.1. Market Analysis, Insights and Forecast - by Product Type
- 7.1.1. Tablets
- 7.1.2. Films
- 7.1.3. Liquid & Spray
- 7.1.4. Others
- 7.2. Market Analysis, Insights and Forecast - by Route of Administration
- 7.2.1. Sublingual Mucosa
- 7.2.2. Buccal Mucosa
- 7.2.3. Others
- 7.3. Market Analysis, Insights and Forecast - by Indication
- 7.3.1. Opioid Dependence
- 7.3.2. Nausea and Vomiting
- 7.3.3. Erectile Dysfunction
- 7.3.4. Neurological Disorders
- 7.3.5. Others
- 7.4. Market Analysis, Insights and Forecast - by Distribution Channel
- 7.4.1. Hospital Pharmacies
- 7.4.2. Retail Pharmacies
- 7.4.3. Online Pharmacies
- 7.1. Market Analysis, Insights and Forecast - by Product Type
- 8. Asia Pacific Oral Transmucosal Drugs Market Analysis, Insights and Forecast, 2019-2031
- 8.1. Market Analysis, Insights and Forecast - by Product Type
- 8.1.1. Tablets
- 8.1.2. Films
- 8.1.3. Liquid & Spray
- 8.1.4. Others
- 8.2. Market Analysis, Insights and Forecast - by Route of Administration
- 8.2.1. Sublingual Mucosa
- 8.2.2. Buccal Mucosa
- 8.2.3. Others
- 8.3. Market Analysis, Insights and Forecast - by Indication
- 8.3.1. Opioid Dependence
- 8.3.2. Nausea and Vomiting
- 8.3.3. Erectile Dysfunction
- 8.3.4. Neurological Disorders
- 8.3.5. Others
- 8.4. Market Analysis, Insights and Forecast - by Distribution Channel
- 8.4.1. Hospital Pharmacies
- 8.4.2. Retail Pharmacies
- 8.4.3. Online Pharmacies
- 8.1. Market Analysis, Insights and Forecast - by Product Type
- 9. Middle East and Africa Oral Transmucosal Drugs Market Analysis, Insights and Forecast, 2019-2031
- 9.1. Market Analysis, Insights and Forecast - by Product Type
- 9.1.1. Tablets
- 9.1.2. Films
- 9.1.3. Liquid & Spray
- 9.1.4. Others
- 9.2. Market Analysis, Insights and Forecast - by Route of Administration
- 9.2.1. Sublingual Mucosa
- 9.2.2. Buccal Mucosa
- 9.2.3. Others
- 9.3. Market Analysis, Insights and Forecast - by Indication
- 9.3.1. Opioid Dependence
- 9.3.2. Nausea and Vomiting
- 9.3.3. Erectile Dysfunction
- 9.3.4. Neurological Disorders
- 9.3.5. Others
- 9.4. Market Analysis, Insights and Forecast - by Distribution Channel
- 9.4.1. Hospital Pharmacies
- 9.4.2. Retail Pharmacies
- 9.4.3. Online Pharmacies
- 9.1. Market Analysis, Insights and Forecast - by Product Type
- 10. South America Oral Transmucosal Drugs Market Analysis, Insights and Forecast, 2019-2031
- 10.1. Market Analysis, Insights and Forecast - by Product Type
- 10.1.1. Tablets
- 10.1.2. Films
- 10.1.3. Liquid & Spray
- 10.1.4. Others
- 10.2. Market Analysis, Insights and Forecast - by Route of Administration
- 10.2.1. Sublingual Mucosa
- 10.2.2. Buccal Mucosa
- 10.2.3. Others
- 10.3. Market Analysis, Insights and Forecast - by Indication
- 10.3.1. Opioid Dependence
- 10.3.2. Nausea and Vomiting
- 10.3.3. Erectile Dysfunction
- 10.3.4. Neurological Disorders
- 10.3.5. Others
- 10.4. Market Analysis, Insights and Forecast - by Distribution Channel
- 10.4.1. Hospital Pharmacies
- 10.4.2. Retail Pharmacies
- 10.4.3. Online Pharmacies
- 10.1. Market Analysis, Insights and Forecast - by Product Type
- 11. North America Oral Transmucosal Drugs Market Analysis, Insights and Forecast, 2019-2031
- 11.1. Market Analysis, Insights and Forecast - By Country/Sub-region
- 11.1.1 United States
- 11.1.2 Canada
- 11.1.3 Mexico
- 12. Europe Oral Transmucosal Drugs Market Analysis, Insights and Forecast, 2019-2031
- 12.1. Market Analysis, Insights and Forecast - By Country/Sub-region
- 12.1.1 Germany
- 12.1.2 United Kingdom
- 12.1.3 France
- 12.1.4 Italy
- 12.1.5 Spain
- 12.1.6 Rest of Europe
- 13. Asia Pacific Oral Transmucosal Drugs Market Analysis, Insights and Forecast, 2019-2031
- 13.1. Market Analysis, Insights and Forecast - By Country/Sub-region
- 13.1.1 China
- 13.1.2 Japan
- 13.1.3 India
- 13.1.4 Australia
- 13.1.5 South Korea
- 13.1.6 Rest of Asia Pacific
- 14. Middle East and Africa Oral Transmucosal Drugs Market Analysis, Insights and Forecast, 2019-2031
- 14.1. Market Analysis, Insights and Forecast - By Country/Sub-region
- 14.1.1 GCC
- 14.1.2 South Africa
- 14.1.3 Rest of Middle East and Africa
- 15. South America Oral Transmucosal Drugs Market Analysis, Insights and Forecast, 2019-2031
- 15.1. Market Analysis, Insights and Forecast - By Country/Sub-region
- 15.1.1 Brazil
- 15.1.2 Argentina
- 15.1.3 Rest of South America
- 16. Competitive Analysis
- 16.1. Global Market Share Analysis 2024
- 16.2. Company Profiles
- 16.2.1 Sunovion Pharmaceuticals Inc
- 16.2.1.1. Overview
- 16.2.1.2. Products
- 16.2.1.3. SWOT Analysis
- 16.2.1.4. Recent Developments
- 16.2.1.5. Financials (Based on Availability)
- 16.2.2 Seoul Pharmaceuticals
- 16.2.2.1. Overview
- 16.2.2.2. Products
- 16.2.2.3. SWOT Analysis
- 16.2.2.4. Recent Developments
- 16.2.2.5. Financials (Based on Availability)
- 16.2.3 Shilpa Therapeutics
- 16.2.3.1. Overview
- 16.2.3.2. Products
- 16.2.3.3. SWOT Analysis
- 16.2.3.4. Recent Developments
- 16.2.3.5. Financials (Based on Availability)
- 16.2.4 Novartis AG
- 16.2.4.1. Overview
- 16.2.4.2. Products
- 16.2.4.3. SWOT Analysis
- 16.2.4.4. Recent Developments
- 16.2.4.5. Financials (Based on Availability)
- 16.2.5 Aquestive Therapeutics Inc
- 16.2.5.1. Overview
- 16.2.5.2. Products
- 16.2.5.3. SWOT Analysis
- 16.2.5.4. Recent Developments
- 16.2.5.5. Financials (Based on Availability)
- 16.2.6 ZIM Laboratories Limited
- 16.2.6.1. Overview
- 16.2.6.2. Products
- 16.2.6.3. SWOT Analysis
- 16.2.6.4. Recent Developments
- 16.2.6.5. Financials (Based on Availability)
- 16.2.7 GW Pharmaceuticals plc
- 16.2.7.1. Overview
- 16.2.7.2. Products
- 16.2.7.3. SWOT Analysis
- 16.2.7.4. Recent Developments
- 16.2.7.5. Financials (Based on Availability)
- 16.2.8 C L Pharm Co Ltd
- 16.2.8.1. Overview
- 16.2.8.2. Products
- 16.2.8.3. SWOT Analysis
- 16.2.8.4. Recent Developments
- 16.2.8.5. Financials (Based on Availability)
- 16.2.9 IntelGenx Corp
- 16.2.9.1. Overview
- 16.2.9.2. Products
- 16.2.9.3. SWOT Analysis
- 16.2.9.4. Recent Developments
- 16.2.9.5. Financials (Based on Availability)
- 16.2.10 Pfizer Inc
- 16.2.10.1. Overview
- 16.2.10.2. Products
- 16.2.10.3. SWOT Analysis
- 16.2.10.4. Recent Developments
- 16.2.10.5. Financials (Based on Availability)
- 16.2.1 Sunovion Pharmaceuticals Inc
List of Figures
- Figure 1: Global Oral Transmucosal Drugs Market Revenue Breakdown (Million, %) by Region 2024 & 2032
- Figure 2: Global Oral Transmucosal Drugs Market Volume Breakdown (K Unit, %) by Region 2024 & 2032
- Figure 3: North America Oral Transmucosal Drugs Market Revenue (Million), by Country 2024 & 2032
- Figure 4: North America Oral Transmucosal Drugs Market Volume (K Unit), by Country 2024 & 2032
- Figure 5: North America Oral Transmucosal Drugs Market Revenue Share (%), by Country 2024 & 2032
- Figure 6: North America Oral Transmucosal Drugs Market Volume Share (%), by Country 2024 & 2032
- Figure 7: Europe Oral Transmucosal Drugs Market Revenue (Million), by Country 2024 & 2032
- Figure 8: Europe Oral Transmucosal Drugs Market Volume (K Unit), by Country 2024 & 2032
- Figure 9: Europe Oral Transmucosal Drugs Market Revenue Share (%), by Country 2024 & 2032
- Figure 10: Europe Oral Transmucosal Drugs Market Volume Share (%), by Country 2024 & 2032
- Figure 11: Asia Pacific Oral Transmucosal Drugs Market Revenue (Million), by Country 2024 & 2032
- Figure 12: Asia Pacific Oral Transmucosal Drugs Market Volume (K Unit), by Country 2024 & 2032
- Figure 13: Asia Pacific Oral Transmucosal Drugs Market Revenue Share (%), by Country 2024 & 2032
- Figure 14: Asia Pacific Oral Transmucosal Drugs Market Volume Share (%), by Country 2024 & 2032
- Figure 15: Middle East and Africa Oral Transmucosal Drugs Market Revenue (Million), by Country 2024 & 2032
- Figure 16: Middle East and Africa Oral Transmucosal Drugs Market Volume (K Unit), by Country 2024 & 2032
- Figure 17: Middle East and Africa Oral Transmucosal Drugs Market Revenue Share (%), by Country 2024 & 2032
- Figure 18: Middle East and Africa Oral Transmucosal Drugs Market Volume Share (%), by Country 2024 & 2032
- Figure 19: South America Oral Transmucosal Drugs Market Revenue (Million), by Country 2024 & 2032
- Figure 20: South America Oral Transmucosal Drugs Market Volume (K Unit), by Country 2024 & 2032
- Figure 21: South America Oral Transmucosal Drugs Market Revenue Share (%), by Country 2024 & 2032
- Figure 22: South America Oral Transmucosal Drugs Market Volume Share (%), by Country 2024 & 2032
- Figure 23: North America Oral Transmucosal Drugs Market Revenue (Million), by Product Type 2024 & 2032
- Figure 24: North America Oral Transmucosal Drugs Market Volume (K Unit), by Product Type 2024 & 2032
- Figure 25: North America Oral Transmucosal Drugs Market Revenue Share (%), by Product Type 2024 & 2032
- Figure 26: North America Oral Transmucosal Drugs Market Volume Share (%), by Product Type 2024 & 2032
- Figure 27: North America Oral Transmucosal Drugs Market Revenue (Million), by Route of Administration 2024 & 2032
- Figure 28: North America Oral Transmucosal Drugs Market Volume (K Unit), by Route of Administration 2024 & 2032
- Figure 29: North America Oral Transmucosal Drugs Market Revenue Share (%), by Route of Administration 2024 & 2032
- Figure 30: North America Oral Transmucosal Drugs Market Volume Share (%), by Route of Administration 2024 & 2032
- Figure 31: North America Oral Transmucosal Drugs Market Revenue (Million), by Indication 2024 & 2032
- Figure 32: North America Oral Transmucosal Drugs Market Volume (K Unit), by Indication 2024 & 2032
- Figure 33: North America Oral Transmucosal Drugs Market Revenue Share (%), by Indication 2024 & 2032
- Figure 34: North America Oral Transmucosal Drugs Market Volume Share (%), by Indication 2024 & 2032
- Figure 35: North America Oral Transmucosal Drugs Market Revenue (Million), by Distribution Channel 2024 & 2032
- Figure 36: North America Oral Transmucosal Drugs Market Volume (K Unit), by Distribution Channel 2024 & 2032
- Figure 37: North America Oral Transmucosal Drugs Market Revenue Share (%), by Distribution Channel 2024 & 2032
- Figure 38: North America Oral Transmucosal Drugs Market Volume Share (%), by Distribution Channel 2024 & 2032
- Figure 39: North America Oral Transmucosal Drugs Market Revenue (Million), by Country 2024 & 2032
- Figure 40: North America Oral Transmucosal Drugs Market Volume (K Unit), by Country 2024 & 2032
- Figure 41: North America Oral Transmucosal Drugs Market Revenue Share (%), by Country 2024 & 2032
- Figure 42: North America Oral Transmucosal Drugs Market Volume Share (%), by Country 2024 & 2032
- Figure 43: Europe Oral Transmucosal Drugs Market Revenue (Million), by Product Type 2024 & 2032
- Figure 44: Europe Oral Transmucosal Drugs Market Volume (K Unit), by Product Type 2024 & 2032
- Figure 45: Europe Oral Transmucosal Drugs Market Revenue Share (%), by Product Type 2024 & 2032
- Figure 46: Europe Oral Transmucosal Drugs Market Volume Share (%), by Product Type 2024 & 2032
- Figure 47: Europe Oral Transmucosal Drugs Market Revenue (Million), by Route of Administration 2024 & 2032
- Figure 48: Europe Oral Transmucosal Drugs Market Volume (K Unit), by Route of Administration 2024 & 2032
- Figure 49: Europe Oral Transmucosal Drugs Market Revenue Share (%), by Route of Administration 2024 & 2032
- Figure 50: Europe Oral Transmucosal Drugs Market Volume Share (%), by Route of Administration 2024 & 2032
- Figure 51: Europe Oral Transmucosal Drugs Market Revenue (Million), by Indication 2024 & 2032
- Figure 52: Europe Oral Transmucosal Drugs Market Volume (K Unit), by Indication 2024 & 2032
- Figure 53: Europe Oral Transmucosal Drugs Market Revenue Share (%), by Indication 2024 & 2032
- Figure 54: Europe Oral Transmucosal Drugs Market Volume Share (%), by Indication 2024 & 2032
- Figure 55: Europe Oral Transmucosal Drugs Market Revenue (Million), by Distribution Channel 2024 & 2032
- Figure 56: Europe Oral Transmucosal Drugs Market Volume (K Unit), by Distribution Channel 2024 & 2032
- Figure 57: Europe Oral Transmucosal Drugs Market Revenue Share (%), by Distribution Channel 2024 & 2032
- Figure 58: Europe Oral Transmucosal Drugs Market Volume Share (%), by Distribution Channel 2024 & 2032
- Figure 59: Europe Oral Transmucosal Drugs Market Revenue (Million), by Country 2024 & 2032
- Figure 60: Europe Oral Transmucosal Drugs Market Volume (K Unit), by Country 2024 & 2032
- Figure 61: Europe Oral Transmucosal Drugs Market Revenue Share (%), by Country 2024 & 2032
- Figure 62: Europe Oral Transmucosal Drugs Market Volume Share (%), by Country 2024 & 2032
- Figure 63: Asia Pacific Oral Transmucosal Drugs Market Revenue (Million), by Product Type 2024 & 2032
- Figure 64: Asia Pacific Oral Transmucosal Drugs Market Volume (K Unit), by Product Type 2024 & 2032
- Figure 65: Asia Pacific Oral Transmucosal Drugs Market Revenue Share (%), by Product Type 2024 & 2032
- Figure 66: Asia Pacific Oral Transmucosal Drugs Market Volume Share (%), by Product Type 2024 & 2032
- Figure 67: Asia Pacific Oral Transmucosal Drugs Market Revenue (Million), by Route of Administration 2024 & 2032
- Figure 68: Asia Pacific Oral Transmucosal Drugs Market Volume (K Unit), by Route of Administration 2024 & 2032
- Figure 69: Asia Pacific Oral Transmucosal Drugs Market Revenue Share (%), by Route of Administration 2024 & 2032
- Figure 70: Asia Pacific Oral Transmucosal Drugs Market Volume Share (%), by Route of Administration 2024 & 2032
- Figure 71: Asia Pacific Oral Transmucosal Drugs Market Revenue (Million), by Indication 2024 & 2032
- Figure 72: Asia Pacific Oral Transmucosal Drugs Market Volume (K Unit), by Indication 2024 & 2032
- Figure 73: Asia Pacific Oral Transmucosal Drugs Market Revenue Share (%), by Indication 2024 & 2032
- Figure 74: Asia Pacific Oral Transmucosal Drugs Market Volume Share (%), by Indication 2024 & 2032
- Figure 75: Asia Pacific Oral Transmucosal Drugs Market Revenue (Million), by Distribution Channel 2024 & 2032
- Figure 76: Asia Pacific Oral Transmucosal Drugs Market Volume (K Unit), by Distribution Channel 2024 & 2032
- Figure 77: Asia Pacific Oral Transmucosal Drugs Market Revenue Share (%), by Distribution Channel 2024 & 2032
- Figure 78: Asia Pacific Oral Transmucosal Drugs Market Volume Share (%), by Distribution Channel 2024 & 2032
- Figure 79: Asia Pacific Oral Transmucosal Drugs Market Revenue (Million), by Country 2024 & 2032
- Figure 80: Asia Pacific Oral Transmucosal Drugs Market Volume (K Unit), by Country 2024 & 2032
- Figure 81: Asia Pacific Oral Transmucosal Drugs Market Revenue Share (%), by Country 2024 & 2032
- Figure 82: Asia Pacific Oral Transmucosal Drugs Market Volume Share (%), by Country 2024 & 2032
- Figure 83: Middle East and Africa Oral Transmucosal Drugs Market Revenue (Million), by Product Type 2024 & 2032
- Figure 84: Middle East and Africa Oral Transmucosal Drugs Market Volume (K Unit), by Product Type 2024 & 2032
- Figure 85: Middle East and Africa Oral Transmucosal Drugs Market Revenue Share (%), by Product Type 2024 & 2032
- Figure 86: Middle East and Africa Oral Transmucosal Drugs Market Volume Share (%), by Product Type 2024 & 2032
- Figure 87: Middle East and Africa Oral Transmucosal Drugs Market Revenue (Million), by Route of Administration 2024 & 2032
- Figure 88: Middle East and Africa Oral Transmucosal Drugs Market Volume (K Unit), by Route of Administration 2024 & 2032
- Figure 89: Middle East and Africa Oral Transmucosal Drugs Market Revenue Share (%), by Route of Administration 2024 & 2032
- Figure 90: Middle East and Africa Oral Transmucosal Drugs Market Volume Share (%), by Route of Administration 2024 & 2032
- Figure 91: Middle East and Africa Oral Transmucosal Drugs Market Revenue (Million), by Indication 2024 & 2032
- Figure 92: Middle East and Africa Oral Transmucosal Drugs Market Volume (K Unit), by Indication 2024 & 2032
- Figure 93: Middle East and Africa Oral Transmucosal Drugs Market Revenue Share (%), by Indication 2024 & 2032
- Figure 94: Middle East and Africa Oral Transmucosal Drugs Market Volume Share (%), by Indication 2024 & 2032
- Figure 95: Middle East and Africa Oral Transmucosal Drugs Market Revenue (Million), by Distribution Channel 2024 & 2032
- Figure 96: Middle East and Africa Oral Transmucosal Drugs Market Volume (K Unit), by Distribution Channel 2024 & 2032
- Figure 97: Middle East and Africa Oral Transmucosal Drugs Market Revenue Share (%), by Distribution Channel 2024 & 2032
- Figure 98: Middle East and Africa Oral Transmucosal Drugs Market Volume Share (%), by Distribution Channel 2024 & 2032
- Figure 99: Middle East and Africa Oral Transmucosal Drugs Market Revenue (Million), by Country 2024 & 2032
- Figure 100: Middle East and Africa Oral Transmucosal Drugs Market Volume (K Unit), by Country 2024 & 2032
- Figure 101: Middle East and Africa Oral Transmucosal Drugs Market Revenue Share (%), by Country 2024 & 2032
- Figure 102: Middle East and Africa Oral Transmucosal Drugs Market Volume Share (%), by Country 2024 & 2032
- Figure 103: South America Oral Transmucosal Drugs Market Revenue (Million), by Product Type 2024 & 2032
- Figure 104: South America Oral Transmucosal Drugs Market Volume (K Unit), by Product Type 2024 & 2032
- Figure 105: South America Oral Transmucosal Drugs Market Revenue Share (%), by Product Type 2024 & 2032
- Figure 106: South America Oral Transmucosal Drugs Market Volume Share (%), by Product Type 2024 & 2032
- Figure 107: South America Oral Transmucosal Drugs Market Revenue (Million), by Route of Administration 2024 & 2032
- Figure 108: South America Oral Transmucosal Drugs Market Volume (K Unit), by Route of Administration 2024 & 2032
- Figure 109: South America Oral Transmucosal Drugs Market Revenue Share (%), by Route of Administration 2024 & 2032
- Figure 110: South America Oral Transmucosal Drugs Market Volume Share (%), by Route of Administration 2024 & 2032
- Figure 111: South America Oral Transmucosal Drugs Market Revenue (Million), by Indication 2024 & 2032
- Figure 112: South America Oral Transmucosal Drugs Market Volume (K Unit), by Indication 2024 & 2032
- Figure 113: South America Oral Transmucosal Drugs Market Revenue Share (%), by Indication 2024 & 2032
- Figure 114: South America Oral Transmucosal Drugs Market Volume Share (%), by Indication 2024 & 2032
- Figure 115: South America Oral Transmucosal Drugs Market Revenue (Million), by Distribution Channel 2024 & 2032
- Figure 116: South America Oral Transmucosal Drugs Market Volume (K Unit), by Distribution Channel 2024 & 2032
- Figure 117: South America Oral Transmucosal Drugs Market Revenue Share (%), by Distribution Channel 2024 & 2032
- Figure 118: South America Oral Transmucosal Drugs Market Volume Share (%), by Distribution Channel 2024 & 2032
- Figure 119: South America Oral Transmucosal Drugs Market Revenue (Million), by Country 2024 & 2032
- Figure 120: South America Oral Transmucosal Drugs Market Volume (K Unit), by Country 2024 & 2032
- Figure 121: South America Oral Transmucosal Drugs Market Revenue Share (%), by Country 2024 & 2032
- Figure 122: South America Oral Transmucosal Drugs Market Volume Share (%), by Country 2024 & 2032
List of Tables
- Table 1: Global Oral Transmucosal Drugs Market Revenue Million Forecast, by Region 2019 & 2032
- Table 2: Global Oral Transmucosal Drugs Market Volume K Unit Forecast, by Region 2019 & 2032
- Table 3: Global Oral Transmucosal Drugs Market Revenue Million Forecast, by Product Type 2019 & 2032
- Table 4: Global Oral Transmucosal Drugs Market Volume K Unit Forecast, by Product Type 2019 & 2032
- Table 5: Global Oral Transmucosal Drugs Market Revenue Million Forecast, by Route of Administration 2019 & 2032
- Table 6: Global Oral Transmucosal Drugs Market Volume K Unit Forecast, by Route of Administration 2019 & 2032
- Table 7: Global Oral Transmucosal Drugs Market Revenue Million Forecast, by Indication 2019 & 2032
- Table 8: Global Oral Transmucosal Drugs Market Volume K Unit Forecast, by Indication 2019 & 2032
- Table 9: Global Oral Transmucosal Drugs Market Revenue Million Forecast, by Distribution Channel 2019 & 2032
- Table 10: Global Oral Transmucosal Drugs Market Volume K Unit Forecast, by Distribution Channel 2019 & 2032
- Table 11: Global Oral Transmucosal Drugs Market Revenue Million Forecast, by Region 2019 & 2032
- Table 12: Global Oral Transmucosal Drugs Market Volume K Unit Forecast, by Region 2019 & 2032
- Table 13: Global Oral Transmucosal Drugs Market Revenue Million Forecast, by Country 2019 & 2032
- Table 14: Global Oral Transmucosal Drugs Market Volume K Unit Forecast, by Country 2019 & 2032
- Table 15: United States Oral Transmucosal Drugs Market Revenue (Million) Forecast, by Application 2019 & 2032
- Table 16: United States Oral Transmucosal Drugs Market Volume (K Unit) Forecast, by Application 2019 & 2032
- Table 17: Canada Oral Transmucosal Drugs Market Revenue (Million) Forecast, by Application 2019 & 2032
- Table 18: Canada Oral Transmucosal Drugs Market Volume (K Unit) Forecast, by Application 2019 & 2032
- Table 19: Mexico Oral Transmucosal Drugs Market Revenue (Million) Forecast, by Application 2019 & 2032
- Table 20: Mexico Oral Transmucosal Drugs Market Volume (K Unit) Forecast, by Application 2019 & 2032
- Table 21: Global Oral Transmucosal Drugs Market Revenue Million Forecast, by Country 2019 & 2032
- Table 22: Global Oral Transmucosal Drugs Market Volume K Unit Forecast, by Country 2019 & 2032
- Table 23: Germany Oral Transmucosal Drugs Market Revenue (Million) Forecast, by Application 2019 & 2032
- Table 24: Germany Oral Transmucosal Drugs Market Volume (K Unit) Forecast, by Application 2019 & 2032
- Table 25: United Kingdom Oral Transmucosal Drugs Market Revenue (Million) Forecast, by Application 2019 & 2032
- Table 26: United Kingdom Oral Transmucosal Drugs Market Volume (K Unit) Forecast, by Application 2019 & 2032
- Table 27: France Oral Transmucosal Drugs Market Revenue (Million) Forecast, by Application 2019 & 2032
- Table 28: France Oral Transmucosal Drugs Market Volume (K Unit) Forecast, by Application 2019 & 2032
- Table 29: Italy Oral Transmucosal Drugs Market Revenue (Million) Forecast, by Application 2019 & 2032
- Table 30: Italy Oral Transmucosal Drugs Market Volume (K Unit) Forecast, by Application 2019 & 2032
- Table 31: Spain Oral Transmucosal Drugs Market Revenue (Million) Forecast, by Application 2019 & 2032
- Table 32: Spain Oral Transmucosal Drugs Market Volume (K Unit) Forecast, by Application 2019 & 2032
- Table 33: Rest of Europe Oral Transmucosal Drugs Market Revenue (Million) Forecast, by Application 2019 & 2032
- Table 34: Rest of Europe Oral Transmucosal Drugs Market Volume (K Unit) Forecast, by Application 2019 & 2032
- Table 35: Global Oral Transmucosal Drugs Market Revenue Million Forecast, by Country 2019 & 2032
- Table 36: Global Oral Transmucosal Drugs Market Volume K Unit Forecast, by Country 2019 & 2032
- Table 37: China Oral Transmucosal Drugs Market Revenue (Million) Forecast, by Application 2019 & 2032
- Table 38: China Oral Transmucosal Drugs Market Volume (K Unit) Forecast, by Application 2019 & 2032
- Table 39: Japan Oral Transmucosal Drugs Market Revenue (Million) Forecast, by Application 2019 & 2032
- Table 40: Japan Oral Transmucosal Drugs Market Volume (K Unit) Forecast, by Application 2019 & 2032
- Table 41: India Oral Transmucosal Drugs Market Revenue (Million) Forecast, by Application 2019 & 2032
- Table 42: India Oral Transmucosal Drugs Market Volume (K Unit) Forecast, by Application 2019 & 2032
- Table 43: Australia Oral Transmucosal Drugs Market Revenue (Million) Forecast, by Application 2019 & 2032
- Table 44: Australia Oral Transmucosal Drugs Market Volume (K Unit) Forecast, by Application 2019 & 2032
- Table 45: South Korea Oral Transmucosal Drugs Market Revenue (Million) Forecast, by Application 2019 & 2032
- Table 46: South Korea Oral Transmucosal Drugs Market Volume (K Unit) Forecast, by Application 2019 & 2032
- Table 47: Rest of Asia Pacific Oral Transmucosal Drugs Market Revenue (Million) Forecast, by Application 2019 & 2032
- Table 48: Rest of Asia Pacific Oral Transmucosal Drugs Market Volume (K Unit) Forecast, by Application 2019 & 2032
- Table 49: Global Oral Transmucosal Drugs Market Revenue Million Forecast, by Country 2019 & 2032
- Table 50: Global Oral Transmucosal Drugs Market Volume K Unit Forecast, by Country 2019 & 2032
- Table 51: GCC Oral Transmucosal Drugs Market Revenue (Million) Forecast, by Application 2019 & 2032
- Table 52: GCC Oral Transmucosal Drugs Market Volume (K Unit) Forecast, by Application 2019 & 2032
- Table 53: South Africa Oral Transmucosal Drugs Market Revenue (Million) Forecast, by Application 2019 & 2032
- Table 54: South Africa Oral Transmucosal Drugs Market Volume (K Unit) Forecast, by Application 2019 & 2032
- Table 55: Rest of Middle East and Africa Oral Transmucosal Drugs Market Revenue (Million) Forecast, by Application 2019 & 2032
- Table 56: Rest of Middle East and Africa Oral Transmucosal Drugs Market Volume (K Unit) Forecast, by Application 2019 & 2032
- Table 57: Global Oral Transmucosal Drugs Market Revenue Million Forecast, by Country 2019 & 2032
- Table 58: Global Oral Transmucosal Drugs Market Volume K Unit Forecast, by Country 2019 & 2032
- Table 59: Brazil Oral Transmucosal Drugs Market Revenue (Million) Forecast, by Application 2019 & 2032
- Table 60: Brazil Oral Transmucosal Drugs Market Volume (K Unit) Forecast, by Application 2019 & 2032
- Table 61: Argentina Oral Transmucosal Drugs Market Revenue (Million) Forecast, by Application 2019 & 2032
- Table 62: Argentina Oral Transmucosal Drugs Market Volume (K Unit) Forecast, by Application 2019 & 2032
- Table 63: Rest of South America Oral Transmucosal Drugs Market Revenue (Million) Forecast, by Application 2019 & 2032
- Table 64: Rest of South America Oral Transmucosal Drugs Market Volume (K Unit) Forecast, by Application 2019 & 2032
- Table 65: Global Oral Transmucosal Drugs Market Revenue Million Forecast, by Product Type 2019 & 2032
- Table 66: Global Oral Transmucosal Drugs Market Volume K Unit Forecast, by Product Type 2019 & 2032
- Table 67: Global Oral Transmucosal Drugs Market Revenue Million Forecast, by Route of Administration 2019 & 2032
- Table 68: Global Oral Transmucosal Drugs Market Volume K Unit Forecast, by Route of Administration 2019 & 2032
- Table 69: Global Oral Transmucosal Drugs Market Revenue Million Forecast, by Indication 2019 & 2032
- Table 70: Global Oral Transmucosal Drugs Market Volume K Unit Forecast, by Indication 2019 & 2032
- Table 71: Global Oral Transmucosal Drugs Market Revenue Million Forecast, by Distribution Channel 2019 & 2032
- Table 72: Global Oral Transmucosal Drugs Market Volume K Unit Forecast, by Distribution Channel 2019 & 2032
- Table 73: Global Oral Transmucosal Drugs Market Revenue Million Forecast, by Country 2019 & 2032
- Table 74: Global Oral Transmucosal Drugs Market Volume K Unit Forecast, by Country 2019 & 2032
- Table 75: United States Oral Transmucosal Drugs Market Revenue (Million) Forecast, by Application 2019 & 2032
- Table 76: United States Oral Transmucosal Drugs Market Volume (K Unit) Forecast, by Application 2019 & 2032
- Table 77: Canada Oral Transmucosal Drugs Market Revenue (Million) Forecast, by Application 2019 & 2032
- Table 78: Canada Oral Transmucosal Drugs Market Volume (K Unit) Forecast, by Application 2019 & 2032
- Table 79: Mexico Oral Transmucosal Drugs Market Revenue (Million) Forecast, by Application 2019 & 2032
- Table 80: Mexico Oral Transmucosal Drugs Market Volume (K Unit) Forecast, by Application 2019 & 2032
- Table 81: Global Oral Transmucosal Drugs Market Revenue Million Forecast, by Product Type 2019 & 2032
- Table 82: Global Oral Transmucosal Drugs Market Volume K Unit Forecast, by Product Type 2019 & 2032
- Table 83: Global Oral Transmucosal Drugs Market Revenue Million Forecast, by Route of Administration 2019 & 2032
- Table 84: Global Oral Transmucosal Drugs Market Volume K Unit Forecast, by Route of Administration 2019 & 2032
- Table 85: Global Oral Transmucosal Drugs Market Revenue Million Forecast, by Indication 2019 & 2032
- Table 86: Global Oral Transmucosal Drugs Market Volume K Unit Forecast, by Indication 2019 & 2032
- Table 87: Global Oral Transmucosal Drugs Market Revenue Million Forecast, by Distribution Channel 2019 & 2032
- Table 88: Global Oral Transmucosal Drugs Market Volume K Unit Forecast, by Distribution Channel 2019 & 2032
- Table 89: Global Oral Transmucosal Drugs Market Revenue Million Forecast, by Country 2019 & 2032
- Table 90: Global Oral Transmucosal Drugs Market Volume K Unit Forecast, by Country 2019 & 2032
- Table 91: Germany Oral Transmucosal Drugs Market Revenue (Million) Forecast, by Application 2019 & 2032
- Table 92: Germany Oral Transmucosal Drugs Market Volume (K Unit) Forecast, by Application 2019 & 2032
- Table 93: United Kingdom Oral Transmucosal Drugs Market Revenue (Million) Forecast, by Application 2019 & 2032
- Table 94: United Kingdom Oral Transmucosal Drugs Market Volume (K Unit) Forecast, by Application 2019 & 2032
- Table 95: France Oral Transmucosal Drugs Market Revenue (Million) Forecast, by Application 2019 & 2032
- Table 96: France Oral Transmucosal Drugs Market Volume (K Unit) Forecast, by Application 2019 & 2032
- Table 97: Italy Oral Transmucosal Drugs Market Revenue (Million) Forecast, by Application 2019 & 2032
- Table 98: Italy Oral Transmucosal Drugs Market Volume (K Unit) Forecast, by Application 2019 & 2032
- Table 99: Spain Oral Transmucosal Drugs Market Revenue (Million) Forecast, by Application 2019 & 2032
- Table 100: Spain Oral Transmucosal Drugs Market Volume (K Unit) Forecast, by Application 2019 & 2032
- Table 101: Rest of Europe Oral Transmucosal Drugs Market Revenue (Million) Forecast, by Application 2019 & 2032
- Table 102: Rest of Europe Oral Transmucosal Drugs Market Volume (K Unit) Forecast, by Application 2019 & 2032
- Table 103: Global Oral Transmucosal Drugs Market Revenue Million Forecast, by Product Type 2019 & 2032
- Table 104: Global Oral Transmucosal Drugs Market Volume K Unit Forecast, by Product Type 2019 & 2032
- Table 105: Global Oral Transmucosal Drugs Market Revenue Million Forecast, by Route of Administration 2019 & 2032
- Table 106: Global Oral Transmucosal Drugs Market Volume K Unit Forecast, by Route of Administration 2019 & 2032
- Table 107: Global Oral Transmucosal Drugs Market Revenue Million Forecast, by Indication 2019 & 2032
- Table 108: Global Oral Transmucosal Drugs Market Volume K Unit Forecast, by Indication 2019 & 2032
- Table 109: Global Oral Transmucosal Drugs Market Revenue Million Forecast, by Distribution Channel 2019 & 2032
- Table 110: Global Oral Transmucosal Drugs Market Volume K Unit Forecast, by Distribution Channel 2019 & 2032
- Table 111: Global Oral Transmucosal Drugs Market Revenue Million Forecast, by Country 2019 & 2032
- Table 112: Global Oral Transmucosal Drugs Market Volume K Unit Forecast, by Country 2019 & 2032
- Table 113: China Oral Transmucosal Drugs Market Revenue (Million) Forecast, by Application 2019 & 2032
- Table 114: China Oral Transmucosal Drugs Market Volume (K Unit) Forecast, by Application 2019 & 2032
- Table 115: Japan Oral Transmucosal Drugs Market Revenue (Million) Forecast, by Application 2019 & 2032
- Table 116: Japan Oral Transmucosal Drugs Market Volume (K Unit) Forecast, by Application 2019 & 2032
- Table 117: India Oral Transmucosal Drugs Market Revenue (Million) Forecast, by Application 2019 & 2032
- Table 118: India Oral Transmucosal Drugs Market Volume (K Unit) Forecast, by Application 2019 & 2032
- Table 119: Australia Oral Transmucosal Drugs Market Revenue (Million) Forecast, by Application 2019 & 2032
- Table 120: Australia Oral Transmucosal Drugs Market Volume (K Unit) Forecast, by Application 2019 & 2032
- Table 121: South Korea Oral Transmucosal Drugs Market Revenue (Million) Forecast, by Application 2019 & 2032
- Table 122: South Korea Oral Transmucosal Drugs Market Volume (K Unit) Forecast, by Application 2019 & 2032
- Table 123: Rest of Asia Pacific Oral Transmucosal Drugs Market Revenue (Million) Forecast, by Application 2019 & 2032
- Table 124: Rest of Asia Pacific Oral Transmucosal Drugs Market Volume (K Unit) Forecast, by Application 2019 & 2032
- Table 125: Global Oral Transmucosal Drugs Market Revenue Million Forecast, by Product Type 2019 & 2032
- Table 126: Global Oral Transmucosal Drugs Market Volume K Unit Forecast, by Product Type 2019 & 2032
- Table 127: Global Oral Transmucosal Drugs Market Revenue Million Forecast, by Route of Administration 2019 & 2032
- Table 128: Global Oral Transmucosal Drugs Market Volume K Unit Forecast, by Route of Administration 2019 & 2032
- Table 129: Global Oral Transmucosal Drugs Market Revenue Million Forecast, by Indication 2019 & 2032
- Table 130: Global Oral Transmucosal Drugs Market Volume K Unit Forecast, by Indication 2019 & 2032
- Table 131: Global Oral Transmucosal Drugs Market Revenue Million Forecast, by Distribution Channel 2019 & 2032
- Table 132: Global Oral Transmucosal Drugs Market Volume K Unit Forecast, by Distribution Channel 2019 & 2032
- Table 133: Global Oral Transmucosal Drugs Market Revenue Million Forecast, by Country 2019 & 2032
- Table 134: Global Oral Transmucosal Drugs Market Volume K Unit Forecast, by Country 2019 & 2032
- Table 135: GCC Oral Transmucosal Drugs Market Revenue (Million) Forecast, by Application 2019 & 2032
- Table 136: GCC Oral Transmucosal Drugs Market Volume (K Unit) Forecast, by Application 2019 & 2032
- Table 137: South Africa Oral Transmucosal Drugs Market Revenue (Million) Forecast, by Application 2019 & 2032
- Table 138: South Africa Oral Transmucosal Drugs Market Volume (K Unit) Forecast, by Application 2019 & 2032
- Table 139: Rest of Middle East and Africa Oral Transmucosal Drugs Market Revenue (Million) Forecast, by Application 2019 & 2032
- Table 140: Rest of Middle East and Africa Oral Transmucosal Drugs Market Volume (K Unit) Forecast, by Application 2019 & 2032
- Table 141: Global Oral Transmucosal Drugs Market Revenue Million Forecast, by Product Type 2019 & 2032
- Table 142: Global Oral Transmucosal Drugs Market Volume K Unit Forecast, by Product Type 2019 & 2032
- Table 143: Global Oral Transmucosal Drugs Market Revenue Million Forecast, by Route of Administration 2019 & 2032
- Table 144: Global Oral Transmucosal Drugs Market Volume K Unit Forecast, by Route of Administration 2019 & 2032
- Table 145: Global Oral Transmucosal Drugs Market Revenue Million Forecast, by Indication 2019 & 2032
- Table 146: Global Oral Transmucosal Drugs Market Volume K Unit Forecast, by Indication 2019 & 2032
- Table 147: Global Oral Transmucosal Drugs Market Revenue Million Forecast, by Distribution Channel 2019 & 2032
- Table 148: Global Oral Transmucosal Drugs Market Volume K Unit Forecast, by Distribution Channel 2019 & 2032
- Table 149: Global Oral Transmucosal Drugs Market Revenue Million Forecast, by Country 2019 & 2032
- Table 150: Global Oral Transmucosal Drugs Market Volume K Unit Forecast, by Country 2019 & 2032
- Table 151: Brazil Oral Transmucosal Drugs Market Revenue (Million) Forecast, by Application 2019 & 2032
- Table 152: Brazil Oral Transmucosal Drugs Market Volume (K Unit) Forecast, by Application 2019 & 2032
- Table 153: Argentina Oral Transmucosal Drugs Market Revenue (Million) Forecast, by Application 2019 & 2032
- Table 154: Argentina Oral Transmucosal Drugs Market Volume (K Unit) Forecast, by Application 2019 & 2032
- Table 155: Rest of South America Oral Transmucosal Drugs Market Revenue (Million) Forecast, by Application 2019 & 2032
- Table 156: Rest of South America Oral Transmucosal Drugs Market Volume (K Unit) Forecast, by Application 2019 & 2032
Frequently Asked Questions
1. What is the projected Compound Annual Growth Rate (CAGR) of the Oral Transmucosal Drugs Market?
The projected CAGR is approximately 7.40%.
2. Which companies are prominent players in the Oral Transmucosal Drugs Market?
Key companies in the market include Sunovion Pharmaceuticals Inc, Seoul Pharmaceuticals, Shilpa Therapeutics, Novartis AG, Aquestive Therapeutics Inc, ZIM Laboratories Limited, GW Pharmaceuticals plc , C L Pharm Co Ltd, IntelGenx Corp, Pfizer Inc.
3. What are the main segments of the Oral Transmucosal Drugs Market?
The market segments include Product Type, Route of Administration, Indication, Distribution Channel.
4. Can you provide details about the market size?
The market size is estimated to be USD XX Million as of 2022.
5. What are some drivers contributing to market growth?
Growing Burden of Target Diseases; Rise in R&D Activities and Product Launches.
6. What are the notable trends driving market growth?
Tablets segment is Expected to Hold a Significant Share Over the Forecast Period.
7. Are there any restraints impacting market growth?
Disadvantages Associated With Oral Transmucosal Drug Delivery.
8. Can you provide examples of recent developments in the market?
In September 2021, IntelGenx Corp. launched RIZAPORT in Spain. Exeltis Healthcare S.L. is a commercialization partner of IntelGenx Corp. in the European Union for RIZAPORT. It is an oral film formulation of rizatriptan benzoate.
9. What pricing options are available for accessing the report?
Pricing options include single-user, multi-user, and enterprise licenses priced at USD 4750, USD 5250, and USD 8750 respectively.
10. Is the market size provided in terms of value or volume?
The market size is provided in terms of value, measured in Million and volume, measured in K Unit.
11. Are there any specific market keywords associated with the report?
Yes, the market keyword associated with the report is "Oral Transmucosal Drugs Market," which aids in identifying and referencing the specific market segment covered.
12. How do I determine which pricing option suits my needs best?
The pricing options vary based on user requirements and access needs. Individual users may opt for single-user licenses, while businesses requiring broader access may choose multi-user or enterprise licenses for cost-effective access to the report.
13. Are there any additional resources or data provided in the Oral Transmucosal Drugs Market report?
While the report offers comprehensive insights, it's advisable to review the specific contents or supplementary materials provided to ascertain if additional resources or data are available.
14. How can I stay updated on further developments or reports in the Oral Transmucosal Drugs Market?
To stay informed about further developments, trends, and reports in the Oral Transmucosal Drugs Market, consider subscribing to industry newsletters, following relevant companies and organizations, or regularly checking reputable industry news sources and publications.
Methodology
Step 1 - Identification of Relevant Samples Size from Population Database


Step 2 - Approaches for Defining Global Market Size (Value, Volume* & Price*)

Note*: In applicable scenarios
Step 3 - Data Sources
Primary Research
- Web Analytics
- Survey Reports
- Research Institute
- Latest Research Reports
- Opinion Leaders
Secondary Research
- Annual Reports
- White Paper
- Latest Press Release
- Industry Association
- Paid Database
- Investor Presentations

Step 4 - Data Triangulation
Involves using different sources of information in order to increase the validity of a study
These sources are likely to be stakeholders in a program - participants, other researchers, program staff, other community members, and so on.
Then we put all data in single framework & apply various statistical tools to find out the dynamic on the market.
During the analysis stage, feedback from the stakeholder groups would be compared to determine areas of agreement as well as areas of divergence


