
Key Insights
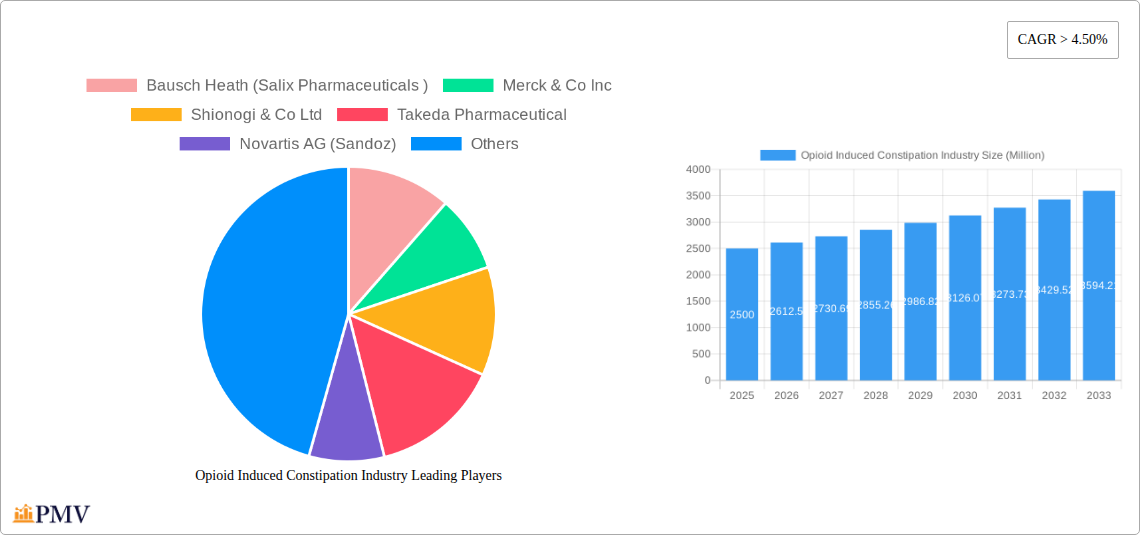
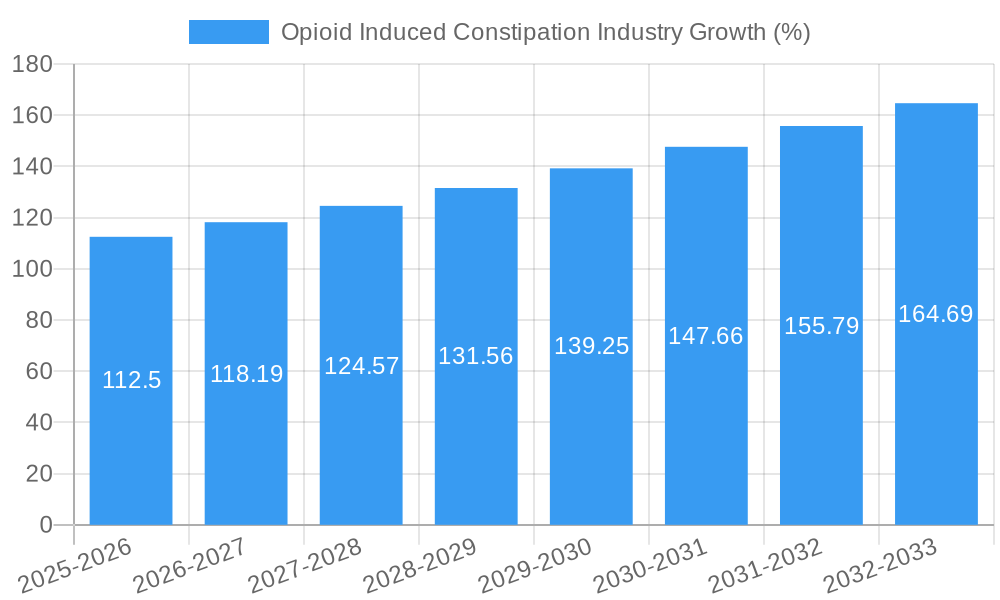
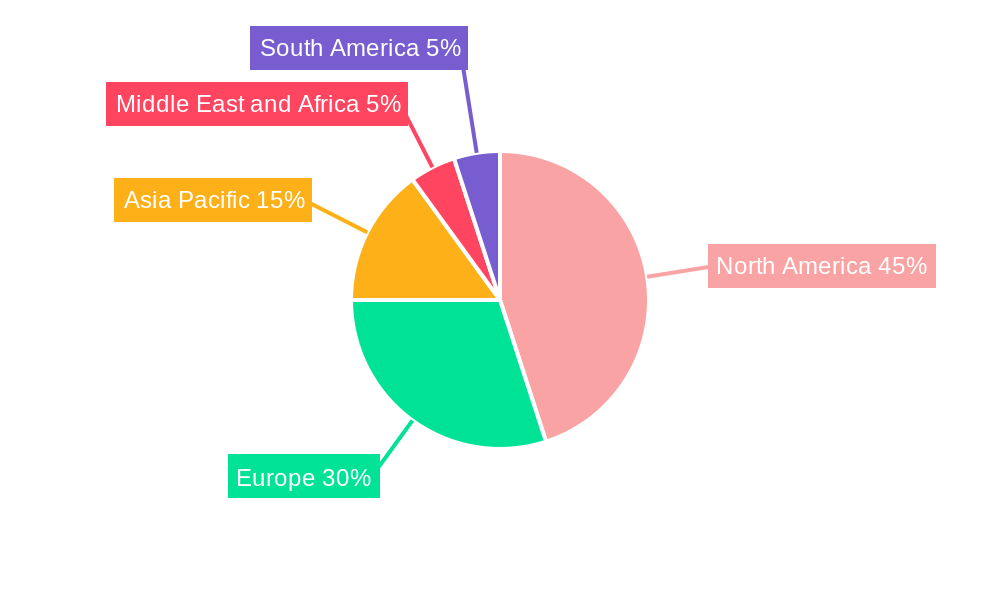
The global opioid-induced constipation (OIC) market, valued at approximately $2.5 billion in 2025, is projected to experience robust growth, exhibiting a Compound Annual Growth Rate (CAGR) exceeding 4.5% from 2025 to 2033. This expansion is fueled by several key drivers. The rising prevalence of chronic pain conditions necessitating opioid analgesics is a primary factor. Furthermore, an increasing awareness of OIC as a significant adverse effect of opioid use among both patients and healthcare professionals is driving demand for effective treatments. Technological advancements leading to the development of novel and more effective therapies, such as improved formulations and targeted drug delivery systems, also contribute to market growth. Segmentation reveals a significant share for prescription medications within hospital and retail pharmacies, although the over-the-counter segment shows potential for future growth with the development of user-friendly and effective formulations. Major pharmaceutical companies like Bausch Health, Merck & Co., and Takeda Pharmaceutical are key players in this market, continuously investing in research and development to improve existing treatments and bring new products to market. North America currently holds a significant market share, driven by high opioid prescription rates and robust healthcare infrastructure. However, growing awareness and increasing healthcare spending in regions like Asia Pacific are expected to fuel regional market expansion in the coming years.
The market, however, faces certain restraints. The high cost of OIC treatments can hinder accessibility, particularly in low- and middle-income countries. Furthermore, the potential for side effects associated with some OIC medications poses a challenge. The development of biosimilars and generic alternatives could impact the pricing dynamics and profitability of innovator drugs. Regulatory hurdles and stringent approval processes for new drugs also pose a challenge to market expansion. Competition amongst pharmaceutical companies is intense, driving the need for continuous innovation and effective marketing strategies. Despite these challenges, the overall market outlook remains positive, driven by the escalating prevalence of opioid use and the continuous efforts to develop safer and more effective OIC treatments.
Opioid Induced Constipation (OIC) Industry Market Report: 2019-2033
This comprehensive report provides a detailed analysis of the Opioid Induced Constipation (OIC) industry, offering invaluable insights for stakeholders, investors, and industry professionals. Covering the period 2019-2033, with a base year of 2025 and a forecast period of 2025-2033, this report meticulously examines market dynamics, competitive landscapes, and future growth prospects. The global OIC market is projected to reach xx Million by 2033, exhibiting a CAGR of xx% during the forecast period.
Opioid Induced Constipation Industry Market Structure & Competitive Dynamics
The OIC market exhibits a moderately concentrated structure, with several key players vying for market share. Market concentration is influenced by factors like FDA approvals, patent expirations, and the success of novel drug development programs. Innovation ecosystems are highly active, driven by the need for improved efficacy and safety profiles of OIC treatments. Stringent regulatory frameworks, primarily governed by the FDA in major markets, play a significant role in shaping market access and product approvals. The existence of substitute therapies for constipation, both prescription and over-the-counter, poses competitive pressure. End-user trends indicate a shift towards convenient and effective treatment options, influencing product development and marketing strategies. M&A activity in the OIC space has been moderate, with deal values ranging from xx Million to xx Million in recent years.
- Market Share: The top 5 companies hold approximately xx% of the market share.
- M&A Deal Values: The average deal value in the last 5 years has been approximately xx Million.
Opioid Induced Constipation Industry Industry Trends & Insights
The OIC market is experiencing substantial growth fueled by the increasing prevalence of opioid use for chronic pain management, a rising geriatric population (more susceptible to OIC), and growing awareness of the condition among healthcare professionals and patients. Technological advancements, particularly in drug delivery systems, are improving treatment efficacy and patient compliance. Consumer preferences are shifting towards less invasive, safer and more convenient OIC therapies. The competitive landscape is characterized by intense rivalry among established pharmaceutical companies and emerging biotech firms, leading to ongoing innovation and increased competition. Market penetration of newer drug classes, such as Chloride Channel-2 Activators, is expected to increase steadily over the forecast period.
- Market Growth Drivers: Increased opioid prescriptions, aging population, rising awareness
- Technological Disruptions: Novel drug delivery systems, improved formulations
- Consumer Preferences: Convenience, efficacy, safety
Dominant Markets & Segments in Opioid Induced Constipation Industry
The North American market dominates the OIC landscape, driven by high opioid prescription rates, well-established healthcare infrastructure, and high per capita healthcare expenditure. Within the drug classes, Mu-opioid Receptor Antagonists hold the largest market share, followed by Chloride Channel-2 Activators. The prescription segment dominates the OIC market, with a projected market size of xx Million by 2033. Hospital pharmacies account for a significant portion of OIC drug dispensing.
- Key Drivers (North America): High opioid prescription rates, advanced healthcare infrastructure, high healthcare expenditure
- Mu-opioid Receptor Antagonists: High market share due to established efficacy and wide availability.
- Prescription Segment: Dominant due to the nature of OIC treatment and physician-led care.
- Hospital Pharmacies: Significant share due to inpatient opioid use and hospital management of constipation.
Opioid Induced Constipation Industry Product Innovations
Recent product innovations focus on improving efficacy, reducing side effects, and enhancing patient convenience. This includes developing novel drug delivery systems, such as subcutaneous injections, and exploring new drug classes like Chloride Channel-2 activators to provide better alternatives for managing OIC. These innovations are designed to address unmet needs within the market and offer competitive advantages to the manufacturers.
Report Segmentation & Scope
This report segments the OIC market based on drug class (Mu-opioid Receptor Antagonists, Chloride Channel-2 Activators, Others), prescription type (Over-The-Counter, Prescription), and end-user (Hospital Pharmacies, Retail Pharmacies, Online Pharmacies). Each segment's growth projections, market size, and competitive dynamics are thoroughly analyzed. For example, the Mu-opioid Receptor Antagonist segment is expected to maintain its dominance due to established efficacy, while the Chloride Channel-2 Activator segment is poised for significant growth.
- Drug Class Segmentation: Analyzes market share and growth potential for each drug class.
- Prescription Type Segmentation: Compares OTC and prescription segments, including market size and regulatory factors.
- End-User Segmentation: Explores sales channels and distribution patterns across various end-users.
Key Drivers of Opioid Induced Constipation Industry Growth
The OIC market's growth is propelled by several factors, including the increasing prevalence of chronic pain conditions leading to higher opioid usage, advancements in drug development leading to improved treatment options, and the growing awareness among healthcare professionals and patients about OIC. Favorable regulatory environments in several key markets also contribute to market expansion.
Challenges in the Opioid Induced Constipation Industry Sector
The OIC industry faces challenges such as stringent regulatory approvals, potential side effects of existing treatments, and the need for new innovative therapies to address unmet needs. High R&D costs associated with developing new OIC drugs also pose a significant challenge, limiting market entry for smaller players. Furthermore, competition from generic drugs upon patent expiry creates price pressure.
Leading Players in the Opioid Induced Constipation Industry Market
- Bausch Health (Salix Pharmaceuticals)
- Merck & Co Inc
- Shionogi & Co Ltd
- Takeda Pharmaceutical
- Novartis AG (Sandoz)
- RedHill Biopharma
- AstraZeneca plc
- GlaxoSmithKline (Theravance Biopharma Inc)
- Mallinckrodt Pharmaceuticals
Key Developments in Opioid Induced Constipation Industry Sector
- March 2022: Bausch Health Companies Inc. (Salix Pharmaceuticals) reported positive findings on RELISTOR SC for reducing hospitalizations and length of stay in patients with OIC.
- January 2022: BioGaia Pharma reported the first patient enrollment in a Phase II clinical study evaluating BGP345A for OIC.
Strategic Opioid Induced Constipation Industry Market Outlook
The OIC market is poised for continued growth driven by factors like increasing opioid use, an aging population, and ongoing technological advancements in treatment options. Strategic opportunities exist for companies focused on developing novel therapies, improving drug delivery systems, and enhancing patient access to effective treatments. The market presents significant potential for companies that can effectively address the unmet needs in OIC management.
Opioid Induced Constipation Industry Segmentation
-
1. Drug Class
- 1.1. Mu-opioid Receptor Antagonists
- 1.2. Chloride Channel-2 Activators
- 1.3. Others
-
2. Prescription Type
- 2.1. Over The Counter
-
3. End-User
- 3.1. Hospital Pharmacies
- 3.2. Retail Pharmacies
- 3.3. Online Pharmacies
Opioid Induced Constipation Industry Segmentation By Geography
-
1. North America
- 1.1. United states
- 1.2. Canada
- 1.3. Mexico
-
2. Europe
- 2.1. Germany
- 2.2. United Kingdom
- 2.3. France
- 2.4. Italy
- 2.5. Spain
- 2.6. Rest of Europe
-
3. Asia Pacific
- 3.1. China
- 3.2. Japan
- 3.3. India
- 3.4. Australia
- 3.5. South Korea
- 3.6. Rest of Asia Pacific
-
4. Middle East and Africa
- 4.1. GCC
- 4.2. South Africa
- 4.3. Rest of Middle East and Africa
-
5. South America
- 5.1. Brazil
- 5.2. Argentina
- 5.3. Rest of South America
Opioid Induced Constipation Industry REPORT HIGHLIGHTS
| Aspects | Details |
|---|---|
| Study Period | 2019-2033 |
| Base Year | 2024 |
| Estimated Year | 2025 |
| Forecast Period | 2025-2033 |
| Historical Period | 2019-2024 |
| Growth Rate | CAGR of > 4.50% from 2019-2033 |
| Segmentation |
|
Table of Contents
- 1. Introduction
- 1.1. Research Scope
- 1.2. Market Segmentation
- 1.3. Research Methodology
- 1.4. Definitions and Assumptions
- 2. Executive Summary
- 2.1. Introduction
- 3. Market Dynamics
- 3.1. Introduction
- 3.2. Market Drivers
- 3.2.1. Rise in the Availability of Effective OIC Drugs Along with Growing Prevalence of Chronic Idiopathic Pains; Increasing Use of Opioid Analgesic Prescriptions Along with Growing Geriatric Population in Developed Nations
- 3.3. Market Restrains
- 3.3.1. Clinical Trials on Next Generation Analgesics as an Alternative to Opioid Analgesics; Lack of Awareness and Reluctance Among Patients due to Adverse Effects of OIC Drugs
- 3.4. Market Trends
- 3.4.1. The Mu-opioid Receptor Antagonists in Drug Class Segment are Expected to Hold the Large Market Share in the Opioid-Induced Constipation Market
- 4. Market Factor Analysis
- 4.1. Porters Five Forces
- 4.2. Supply/Value Chain
- 4.3. PESTEL analysis
- 4.4. Market Entropy
- 4.5. Patent/Trademark Analysis
- 5. Global Opioid Induced Constipation Industry Analysis, Insights and Forecast, 2019-2031
- 5.1. Market Analysis, Insights and Forecast - by Drug Class
- 5.1.1. Mu-opioid Receptor Antagonists
- 5.1.2. Chloride Channel-2 Activators
- 5.1.3. Others
- 5.2. Market Analysis, Insights and Forecast - by Prescription Type
- 5.2.1. Over The Counter
- 5.3. Market Analysis, Insights and Forecast - by End-User
- 5.3.1. Hospital Pharmacies
- 5.3.2. Retail Pharmacies
- 5.3.3. Online Pharmacies
- 5.4. Market Analysis, Insights and Forecast - by Region
- 5.4.1. North America
- 5.4.2. Europe
- 5.4.3. Asia Pacific
- 5.4.4. Middle East and Africa
- 5.4.5. South America
- 5.1. Market Analysis, Insights and Forecast - by Drug Class
- 6. North America Opioid Induced Constipation Industry Analysis, Insights and Forecast, 2019-2031
- 6.1. Market Analysis, Insights and Forecast - by Drug Class
- 6.1.1. Mu-opioid Receptor Antagonists
- 6.1.2. Chloride Channel-2 Activators
- 6.1.3. Others
- 6.2. Market Analysis, Insights and Forecast - by Prescription Type
- 6.2.1. Over The Counter
- 6.3. Market Analysis, Insights and Forecast - by End-User
- 6.3.1. Hospital Pharmacies
- 6.3.2. Retail Pharmacies
- 6.3.3. Online Pharmacies
- 6.1. Market Analysis, Insights and Forecast - by Drug Class
- 7. Europe Opioid Induced Constipation Industry Analysis, Insights and Forecast, 2019-2031
- 7.1. Market Analysis, Insights and Forecast - by Drug Class
- 7.1.1. Mu-opioid Receptor Antagonists
- 7.1.2. Chloride Channel-2 Activators
- 7.1.3. Others
- 7.2. Market Analysis, Insights and Forecast - by Prescription Type
- 7.2.1. Over The Counter
- 7.3. Market Analysis, Insights and Forecast - by End-User
- 7.3.1. Hospital Pharmacies
- 7.3.2. Retail Pharmacies
- 7.3.3. Online Pharmacies
- 7.1. Market Analysis, Insights and Forecast - by Drug Class
- 8. Asia Pacific Opioid Induced Constipation Industry Analysis, Insights and Forecast, 2019-2031
- 8.1. Market Analysis, Insights and Forecast - by Drug Class
- 8.1.1. Mu-opioid Receptor Antagonists
- 8.1.2. Chloride Channel-2 Activators
- 8.1.3. Others
- 8.2. Market Analysis, Insights and Forecast - by Prescription Type
- 8.2.1. Over The Counter
- 8.3. Market Analysis, Insights and Forecast - by End-User
- 8.3.1. Hospital Pharmacies
- 8.3.2. Retail Pharmacies
- 8.3.3. Online Pharmacies
- 8.1. Market Analysis, Insights and Forecast - by Drug Class
- 9. Middle East and Africa Opioid Induced Constipation Industry Analysis, Insights and Forecast, 2019-2031
- 9.1. Market Analysis, Insights and Forecast - by Drug Class
- 9.1.1. Mu-opioid Receptor Antagonists
- 9.1.2. Chloride Channel-2 Activators
- 9.1.3. Others
- 9.2. Market Analysis, Insights and Forecast - by Prescription Type
- 9.2.1. Over The Counter
- 9.3. Market Analysis, Insights and Forecast - by End-User
- 9.3.1. Hospital Pharmacies
- 9.3.2. Retail Pharmacies
- 9.3.3. Online Pharmacies
- 9.1. Market Analysis, Insights and Forecast - by Drug Class
- 10. South America Opioid Induced Constipation Industry Analysis, Insights and Forecast, 2019-2031
- 10.1. Market Analysis, Insights and Forecast - by Drug Class
- 10.1.1. Mu-opioid Receptor Antagonists
- 10.1.2. Chloride Channel-2 Activators
- 10.1.3. Others
- 10.2. Market Analysis, Insights and Forecast - by Prescription Type
- 10.2.1. Over The Counter
- 10.3. Market Analysis, Insights and Forecast - by End-User
- 10.3.1. Hospital Pharmacies
- 10.3.2. Retail Pharmacies
- 10.3.3. Online Pharmacies
- 10.1. Market Analysis, Insights and Forecast - by Drug Class
- 11. North America Opioid Induced Constipation Industry Analysis, Insights and Forecast, 2019-2031
- 11.1. Market Analysis, Insights and Forecast - By Country/Sub-region
- 11.1.1. undefined
- 12. Europe Opioid Induced Constipation Industry Analysis, Insights and Forecast, 2019-2031
- 12.1. Market Analysis, Insights and Forecast - By Country/Sub-region
- 12.1.1. undefined
- 13. Asia Pacific Opioid Induced Constipation Industry Analysis, Insights and Forecast, 2019-2031
- 13.1. Market Analysis, Insights and Forecast - By Country/Sub-region
- 13.1.1. undefined
- 14. Middle East and Africa Opioid Induced Constipation Industry Analysis, Insights and Forecast, 2019-2031
- 14.1. Market Analysis, Insights and Forecast - By Country/Sub-region
- 14.1.1. undefined
- 15. South America Opioid Induced Constipation Industry Analysis, Insights and Forecast, 2019-2031
- 15.1. Market Analysis, Insights and Forecast - By Country/Sub-region
- 15.1.1. undefined
- 16. Competitive Analysis
- 16.1. Global Market Share Analysis 2024
- 16.2. Company Profiles
- 16.2.1 Bausch Heath (Salix Pharmaceuticals )
- 16.2.1.1. Overview
- 16.2.1.2. Products
- 16.2.1.3. SWOT Analysis
- 16.2.1.4. Recent Developments
- 16.2.1.5. Financials (Based on Availability)
- 16.2.2 Merck & Co Inc
- 16.2.2.1. Overview
- 16.2.2.2. Products
- 16.2.2.3. SWOT Analysis
- 16.2.2.4. Recent Developments
- 16.2.2.5. Financials (Based on Availability)
- 16.2.3 Shionogi & Co Ltd
- 16.2.3.1. Overview
- 16.2.3.2. Products
- 16.2.3.3. SWOT Analysis
- 16.2.3.4. Recent Developments
- 16.2.3.5. Financials (Based on Availability)
- 16.2.4 Takeda Pharmaceutical
- 16.2.4.1. Overview
- 16.2.4.2. Products
- 16.2.4.3. SWOT Analysis
- 16.2.4.4. Recent Developments
- 16.2.4.5. Financials (Based on Availability)
- 16.2.5 Novartis AG (Sandoz)
- 16.2.5.1. Overview
- 16.2.5.2. Products
- 16.2.5.3. SWOT Analysis
- 16.2.5.4. Recent Developments
- 16.2.5.5. Financials (Based on Availability)
- 16.2.6 RedHill Biopharma
- 16.2.6.1. Overview
- 16.2.6.2. Products
- 16.2.6.3. SWOT Analysis
- 16.2.6.4. Recent Developments
- 16.2.6.5. Financials (Based on Availability)
- 16.2.7 AstraZeneca plc
- 16.2.7.1. Overview
- 16.2.7.2. Products
- 16.2.7.3. SWOT Analysis
- 16.2.7.4. Recent Developments
- 16.2.7.5. Financials (Based on Availability)
- 16.2.8 GlaxoSmithKline (Theravance Biopharma Inc)
- 16.2.8.1. Overview
- 16.2.8.2. Products
- 16.2.8.3. SWOT Analysis
- 16.2.8.4. Recent Developments
- 16.2.8.5. Financials (Based on Availability)
- 16.2.9 Mallinckrodt Pharmaceuticals
- 16.2.9.1. Overview
- 16.2.9.2. Products
- 16.2.9.3. SWOT Analysis
- 16.2.9.4. Recent Developments
- 16.2.9.5. Financials (Based on Availability)
- 16.2.1 Bausch Heath (Salix Pharmaceuticals )
List of Figures
- Figure 1: Global Opioid Induced Constipation Industry Revenue Breakdown (Million, %) by Region 2024 & 2032
- Figure 2: Global Opioid Induced Constipation Industry Volume Breakdown (K Unit, %) by Region 2024 & 2032
- Figure 3: North America Opioid Induced Constipation Industry Revenue (Million), by Country 2024 & 2032
- Figure 4: North America Opioid Induced Constipation Industry Volume (K Unit), by Country 2024 & 2032
- Figure 5: North America Opioid Induced Constipation Industry Revenue Share (%), by Country 2024 & 2032
- Figure 6: North America Opioid Induced Constipation Industry Volume Share (%), by Country 2024 & 2032
- Figure 7: Europe Opioid Induced Constipation Industry Revenue (Million), by Country 2024 & 2032
- Figure 8: Europe Opioid Induced Constipation Industry Volume (K Unit), by Country 2024 & 2032
- Figure 9: Europe Opioid Induced Constipation Industry Revenue Share (%), by Country 2024 & 2032
- Figure 10: Europe Opioid Induced Constipation Industry Volume Share (%), by Country 2024 & 2032
- Figure 11: Asia Pacific Opioid Induced Constipation Industry Revenue (Million), by Country 2024 & 2032
- Figure 12: Asia Pacific Opioid Induced Constipation Industry Volume (K Unit), by Country 2024 & 2032
- Figure 13: Asia Pacific Opioid Induced Constipation Industry Revenue Share (%), by Country 2024 & 2032
- Figure 14: Asia Pacific Opioid Induced Constipation Industry Volume Share (%), by Country 2024 & 2032
- Figure 15: Middle East and Africa Opioid Induced Constipation Industry Revenue (Million), by Country 2024 & 2032
- Figure 16: Middle East and Africa Opioid Induced Constipation Industry Volume (K Unit), by Country 2024 & 2032
- Figure 17: Middle East and Africa Opioid Induced Constipation Industry Revenue Share (%), by Country 2024 & 2032
- Figure 18: Middle East and Africa Opioid Induced Constipation Industry Volume Share (%), by Country 2024 & 2032
- Figure 19: South America Opioid Induced Constipation Industry Revenue (Million), by Country 2024 & 2032
- Figure 20: South America Opioid Induced Constipation Industry Volume (K Unit), by Country 2024 & 2032
- Figure 21: South America Opioid Induced Constipation Industry Revenue Share (%), by Country 2024 & 2032
- Figure 22: South America Opioid Induced Constipation Industry Volume Share (%), by Country 2024 & 2032
- Figure 23: North America Opioid Induced Constipation Industry Revenue (Million), by Drug Class 2024 & 2032
- Figure 24: North America Opioid Induced Constipation Industry Volume (K Unit), by Drug Class 2024 & 2032
- Figure 25: North America Opioid Induced Constipation Industry Revenue Share (%), by Drug Class 2024 & 2032
- Figure 26: North America Opioid Induced Constipation Industry Volume Share (%), by Drug Class 2024 & 2032
- Figure 27: North America Opioid Induced Constipation Industry Revenue (Million), by Prescription Type 2024 & 2032
- Figure 28: North America Opioid Induced Constipation Industry Volume (K Unit), by Prescription Type 2024 & 2032
- Figure 29: North America Opioid Induced Constipation Industry Revenue Share (%), by Prescription Type 2024 & 2032
- Figure 30: North America Opioid Induced Constipation Industry Volume Share (%), by Prescription Type 2024 & 2032
- Figure 31: North America Opioid Induced Constipation Industry Revenue (Million), by End-User 2024 & 2032
- Figure 32: North America Opioid Induced Constipation Industry Volume (K Unit), by End-User 2024 & 2032
- Figure 33: North America Opioid Induced Constipation Industry Revenue Share (%), by End-User 2024 & 2032
- Figure 34: North America Opioid Induced Constipation Industry Volume Share (%), by End-User 2024 & 2032
- Figure 35: North America Opioid Induced Constipation Industry Revenue (Million), by Country 2024 & 2032
- Figure 36: North America Opioid Induced Constipation Industry Volume (K Unit), by Country 2024 & 2032
- Figure 37: North America Opioid Induced Constipation Industry Revenue Share (%), by Country 2024 & 2032
- Figure 38: North America Opioid Induced Constipation Industry Volume Share (%), by Country 2024 & 2032
- Figure 39: Europe Opioid Induced Constipation Industry Revenue (Million), by Drug Class 2024 & 2032
- Figure 40: Europe Opioid Induced Constipation Industry Volume (K Unit), by Drug Class 2024 & 2032
- Figure 41: Europe Opioid Induced Constipation Industry Revenue Share (%), by Drug Class 2024 & 2032
- Figure 42: Europe Opioid Induced Constipation Industry Volume Share (%), by Drug Class 2024 & 2032
- Figure 43: Europe Opioid Induced Constipation Industry Revenue (Million), by Prescription Type 2024 & 2032
- Figure 44: Europe Opioid Induced Constipation Industry Volume (K Unit), by Prescription Type 2024 & 2032
- Figure 45: Europe Opioid Induced Constipation Industry Revenue Share (%), by Prescription Type 2024 & 2032
- Figure 46: Europe Opioid Induced Constipation Industry Volume Share (%), by Prescription Type 2024 & 2032
- Figure 47: Europe Opioid Induced Constipation Industry Revenue (Million), by End-User 2024 & 2032
- Figure 48: Europe Opioid Induced Constipation Industry Volume (K Unit), by End-User 2024 & 2032
- Figure 49: Europe Opioid Induced Constipation Industry Revenue Share (%), by End-User 2024 & 2032
- Figure 50: Europe Opioid Induced Constipation Industry Volume Share (%), by End-User 2024 & 2032
- Figure 51: Europe Opioid Induced Constipation Industry Revenue (Million), by Country 2024 & 2032
- Figure 52: Europe Opioid Induced Constipation Industry Volume (K Unit), by Country 2024 & 2032
- Figure 53: Europe Opioid Induced Constipation Industry Revenue Share (%), by Country 2024 & 2032
- Figure 54: Europe Opioid Induced Constipation Industry Volume Share (%), by Country 2024 & 2032
- Figure 55: Asia Pacific Opioid Induced Constipation Industry Revenue (Million), by Drug Class 2024 & 2032
- Figure 56: Asia Pacific Opioid Induced Constipation Industry Volume (K Unit), by Drug Class 2024 & 2032
- Figure 57: Asia Pacific Opioid Induced Constipation Industry Revenue Share (%), by Drug Class 2024 & 2032
- Figure 58: Asia Pacific Opioid Induced Constipation Industry Volume Share (%), by Drug Class 2024 & 2032
- Figure 59: Asia Pacific Opioid Induced Constipation Industry Revenue (Million), by Prescription Type 2024 & 2032
- Figure 60: Asia Pacific Opioid Induced Constipation Industry Volume (K Unit), by Prescription Type 2024 & 2032
- Figure 61: Asia Pacific Opioid Induced Constipation Industry Revenue Share (%), by Prescription Type 2024 & 2032
- Figure 62: Asia Pacific Opioid Induced Constipation Industry Volume Share (%), by Prescription Type 2024 & 2032
- Figure 63: Asia Pacific Opioid Induced Constipation Industry Revenue (Million), by End-User 2024 & 2032
- Figure 64: Asia Pacific Opioid Induced Constipation Industry Volume (K Unit), by End-User 2024 & 2032
- Figure 65: Asia Pacific Opioid Induced Constipation Industry Revenue Share (%), by End-User 2024 & 2032
- Figure 66: Asia Pacific Opioid Induced Constipation Industry Volume Share (%), by End-User 2024 & 2032
- Figure 67: Asia Pacific Opioid Induced Constipation Industry Revenue (Million), by Country 2024 & 2032
- Figure 68: Asia Pacific Opioid Induced Constipation Industry Volume (K Unit), by Country 2024 & 2032
- Figure 69: Asia Pacific Opioid Induced Constipation Industry Revenue Share (%), by Country 2024 & 2032
- Figure 70: Asia Pacific Opioid Induced Constipation Industry Volume Share (%), by Country 2024 & 2032
- Figure 71: Middle East and Africa Opioid Induced Constipation Industry Revenue (Million), by Drug Class 2024 & 2032
- Figure 72: Middle East and Africa Opioid Induced Constipation Industry Volume (K Unit), by Drug Class 2024 & 2032
- Figure 73: Middle East and Africa Opioid Induced Constipation Industry Revenue Share (%), by Drug Class 2024 & 2032
- Figure 74: Middle East and Africa Opioid Induced Constipation Industry Volume Share (%), by Drug Class 2024 & 2032
- Figure 75: Middle East and Africa Opioid Induced Constipation Industry Revenue (Million), by Prescription Type 2024 & 2032
- Figure 76: Middle East and Africa Opioid Induced Constipation Industry Volume (K Unit), by Prescription Type 2024 & 2032
- Figure 77: Middle East and Africa Opioid Induced Constipation Industry Revenue Share (%), by Prescription Type 2024 & 2032
- Figure 78: Middle East and Africa Opioid Induced Constipation Industry Volume Share (%), by Prescription Type 2024 & 2032
- Figure 79: Middle East and Africa Opioid Induced Constipation Industry Revenue (Million), by End-User 2024 & 2032
- Figure 80: Middle East and Africa Opioid Induced Constipation Industry Volume (K Unit), by End-User 2024 & 2032
- Figure 81: Middle East and Africa Opioid Induced Constipation Industry Revenue Share (%), by End-User 2024 & 2032
- Figure 82: Middle East and Africa Opioid Induced Constipation Industry Volume Share (%), by End-User 2024 & 2032
- Figure 83: Middle East and Africa Opioid Induced Constipation Industry Revenue (Million), by Country 2024 & 2032
- Figure 84: Middle East and Africa Opioid Induced Constipation Industry Volume (K Unit), by Country 2024 & 2032
- Figure 85: Middle East and Africa Opioid Induced Constipation Industry Revenue Share (%), by Country 2024 & 2032
- Figure 86: Middle East and Africa Opioid Induced Constipation Industry Volume Share (%), by Country 2024 & 2032
- Figure 87: South America Opioid Induced Constipation Industry Revenue (Million), by Drug Class 2024 & 2032
- Figure 88: South America Opioid Induced Constipation Industry Volume (K Unit), by Drug Class 2024 & 2032
- Figure 89: South America Opioid Induced Constipation Industry Revenue Share (%), by Drug Class 2024 & 2032
- Figure 90: South America Opioid Induced Constipation Industry Volume Share (%), by Drug Class 2024 & 2032
- Figure 91: South America Opioid Induced Constipation Industry Revenue (Million), by Prescription Type 2024 & 2032
- Figure 92: South America Opioid Induced Constipation Industry Volume (K Unit), by Prescription Type 2024 & 2032
- Figure 93: South America Opioid Induced Constipation Industry Revenue Share (%), by Prescription Type 2024 & 2032
- Figure 94: South America Opioid Induced Constipation Industry Volume Share (%), by Prescription Type 2024 & 2032
- Figure 95: South America Opioid Induced Constipation Industry Revenue (Million), by End-User 2024 & 2032
- Figure 96: South America Opioid Induced Constipation Industry Volume (K Unit), by End-User 2024 & 2032
- Figure 97: South America Opioid Induced Constipation Industry Revenue Share (%), by End-User 2024 & 2032
- Figure 98: South America Opioid Induced Constipation Industry Volume Share (%), by End-User 2024 & 2032
- Figure 99: South America Opioid Induced Constipation Industry Revenue (Million), by Country 2024 & 2032
- Figure 100: South America Opioid Induced Constipation Industry Volume (K Unit), by Country 2024 & 2032
- Figure 101: South America Opioid Induced Constipation Industry Revenue Share (%), by Country 2024 & 2032
- Figure 102: South America Opioid Induced Constipation Industry Volume Share (%), by Country 2024 & 2032
List of Tables
- Table 1: Global Opioid Induced Constipation Industry Revenue Million Forecast, by Region 2019 & 2032
- Table 2: Global Opioid Induced Constipation Industry Volume K Unit Forecast, by Region 2019 & 2032
- Table 3: Global Opioid Induced Constipation Industry Revenue Million Forecast, by Drug Class 2019 & 2032
- Table 4: Global Opioid Induced Constipation Industry Volume K Unit Forecast, by Drug Class 2019 & 2032
- Table 5: Global Opioid Induced Constipation Industry Revenue Million Forecast, by Prescription Type 2019 & 2032
- Table 6: Global Opioid Induced Constipation Industry Volume K Unit Forecast, by Prescription Type 2019 & 2032
- Table 7: Global Opioid Induced Constipation Industry Revenue Million Forecast, by End-User 2019 & 2032
- Table 8: Global Opioid Induced Constipation Industry Volume K Unit Forecast, by End-User 2019 & 2032
- Table 9: Global Opioid Induced Constipation Industry Revenue Million Forecast, by Region 2019 & 2032
- Table 10: Global Opioid Induced Constipation Industry Volume K Unit Forecast, by Region 2019 & 2032
- Table 11: Global Opioid Induced Constipation Industry Revenue Million Forecast, by Country 2019 & 2032
- Table 12: Global Opioid Induced Constipation Industry Volume K Unit Forecast, by Country 2019 & 2032
- Table 13: Global Opioid Induced Constipation Industry Revenue Million Forecast, by Country 2019 & 2032
- Table 14: Global Opioid Induced Constipation Industry Volume K Unit Forecast, by Country 2019 & 2032
- Table 15: Global Opioid Induced Constipation Industry Revenue Million Forecast, by Country 2019 & 2032
- Table 16: Global Opioid Induced Constipation Industry Volume K Unit Forecast, by Country 2019 & 2032
- Table 17: Global Opioid Induced Constipation Industry Revenue Million Forecast, by Country 2019 & 2032
- Table 18: Global Opioid Induced Constipation Industry Volume K Unit Forecast, by Country 2019 & 2032
- Table 19: Global Opioid Induced Constipation Industry Revenue Million Forecast, by Country 2019 & 2032
- Table 20: Global Opioid Induced Constipation Industry Volume K Unit Forecast, by Country 2019 & 2032
- Table 21: Global Opioid Induced Constipation Industry Revenue Million Forecast, by Drug Class 2019 & 2032
- Table 22: Global Opioid Induced Constipation Industry Volume K Unit Forecast, by Drug Class 2019 & 2032
- Table 23: Global Opioid Induced Constipation Industry Revenue Million Forecast, by Prescription Type 2019 & 2032
- Table 24: Global Opioid Induced Constipation Industry Volume K Unit Forecast, by Prescription Type 2019 & 2032
- Table 25: Global Opioid Induced Constipation Industry Revenue Million Forecast, by End-User 2019 & 2032
- Table 26: Global Opioid Induced Constipation Industry Volume K Unit Forecast, by End-User 2019 & 2032
- Table 27: Global Opioid Induced Constipation Industry Revenue Million Forecast, by Country 2019 & 2032
- Table 28: Global Opioid Induced Constipation Industry Volume K Unit Forecast, by Country 2019 & 2032
- Table 29: United states Opioid Induced Constipation Industry Revenue (Million) Forecast, by Application 2019 & 2032
- Table 30: United states Opioid Induced Constipation Industry Volume (K Unit) Forecast, by Application 2019 & 2032
- Table 31: Canada Opioid Induced Constipation Industry Revenue (Million) Forecast, by Application 2019 & 2032
- Table 32: Canada Opioid Induced Constipation Industry Volume (K Unit) Forecast, by Application 2019 & 2032
- Table 33: Mexico Opioid Induced Constipation Industry Revenue (Million) Forecast, by Application 2019 & 2032
- Table 34: Mexico Opioid Induced Constipation Industry Volume (K Unit) Forecast, by Application 2019 & 2032
- Table 35: Global Opioid Induced Constipation Industry Revenue Million Forecast, by Drug Class 2019 & 2032
- Table 36: Global Opioid Induced Constipation Industry Volume K Unit Forecast, by Drug Class 2019 & 2032
- Table 37: Global Opioid Induced Constipation Industry Revenue Million Forecast, by Prescription Type 2019 & 2032
- Table 38: Global Opioid Induced Constipation Industry Volume K Unit Forecast, by Prescription Type 2019 & 2032
- Table 39: Global Opioid Induced Constipation Industry Revenue Million Forecast, by End-User 2019 & 2032
- Table 40: Global Opioid Induced Constipation Industry Volume K Unit Forecast, by End-User 2019 & 2032
- Table 41: Global Opioid Induced Constipation Industry Revenue Million Forecast, by Country 2019 & 2032
- Table 42: Global Opioid Induced Constipation Industry Volume K Unit Forecast, by Country 2019 & 2032
- Table 43: Germany Opioid Induced Constipation Industry Revenue (Million) Forecast, by Application 2019 & 2032
- Table 44: Germany Opioid Induced Constipation Industry Volume (K Unit) Forecast, by Application 2019 & 2032
- Table 45: United Kingdom Opioid Induced Constipation Industry Revenue (Million) Forecast, by Application 2019 & 2032
- Table 46: United Kingdom Opioid Induced Constipation Industry Volume (K Unit) Forecast, by Application 2019 & 2032
- Table 47: France Opioid Induced Constipation Industry Revenue (Million) Forecast, by Application 2019 & 2032
- Table 48: France Opioid Induced Constipation Industry Volume (K Unit) Forecast, by Application 2019 & 2032
- Table 49: Italy Opioid Induced Constipation Industry Revenue (Million) Forecast, by Application 2019 & 2032
- Table 50: Italy Opioid Induced Constipation Industry Volume (K Unit) Forecast, by Application 2019 & 2032
- Table 51: Spain Opioid Induced Constipation Industry Revenue (Million) Forecast, by Application 2019 & 2032
- Table 52: Spain Opioid Induced Constipation Industry Volume (K Unit) Forecast, by Application 2019 & 2032
- Table 53: Rest of Europe Opioid Induced Constipation Industry Revenue (Million) Forecast, by Application 2019 & 2032
- Table 54: Rest of Europe Opioid Induced Constipation Industry Volume (K Unit) Forecast, by Application 2019 & 2032
- Table 55: Global Opioid Induced Constipation Industry Revenue Million Forecast, by Drug Class 2019 & 2032
- Table 56: Global Opioid Induced Constipation Industry Volume K Unit Forecast, by Drug Class 2019 & 2032
- Table 57: Global Opioid Induced Constipation Industry Revenue Million Forecast, by Prescription Type 2019 & 2032
- Table 58: Global Opioid Induced Constipation Industry Volume K Unit Forecast, by Prescription Type 2019 & 2032
- Table 59: Global Opioid Induced Constipation Industry Revenue Million Forecast, by End-User 2019 & 2032
- Table 60: Global Opioid Induced Constipation Industry Volume K Unit Forecast, by End-User 2019 & 2032
- Table 61: Global Opioid Induced Constipation Industry Revenue Million Forecast, by Country 2019 & 2032
- Table 62: Global Opioid Induced Constipation Industry Volume K Unit Forecast, by Country 2019 & 2032
- Table 63: China Opioid Induced Constipation Industry Revenue (Million) Forecast, by Application 2019 & 2032
- Table 64: China Opioid Induced Constipation Industry Volume (K Unit) Forecast, by Application 2019 & 2032
- Table 65: Japan Opioid Induced Constipation Industry Revenue (Million) Forecast, by Application 2019 & 2032
- Table 66: Japan Opioid Induced Constipation Industry Volume (K Unit) Forecast, by Application 2019 & 2032
- Table 67: India Opioid Induced Constipation Industry Revenue (Million) Forecast, by Application 2019 & 2032
- Table 68: India Opioid Induced Constipation Industry Volume (K Unit) Forecast, by Application 2019 & 2032
- Table 69: Australia Opioid Induced Constipation Industry Revenue (Million) Forecast, by Application 2019 & 2032
- Table 70: Australia Opioid Induced Constipation Industry Volume (K Unit) Forecast, by Application 2019 & 2032
- Table 71: South Korea Opioid Induced Constipation Industry Revenue (Million) Forecast, by Application 2019 & 2032
- Table 72: South Korea Opioid Induced Constipation Industry Volume (K Unit) Forecast, by Application 2019 & 2032
- Table 73: Rest of Asia Pacific Opioid Induced Constipation Industry Revenue (Million) Forecast, by Application 2019 & 2032
- Table 74: Rest of Asia Pacific Opioid Induced Constipation Industry Volume (K Unit) Forecast, by Application 2019 & 2032
- Table 75: Global Opioid Induced Constipation Industry Revenue Million Forecast, by Drug Class 2019 & 2032
- Table 76: Global Opioid Induced Constipation Industry Volume K Unit Forecast, by Drug Class 2019 & 2032
- Table 77: Global Opioid Induced Constipation Industry Revenue Million Forecast, by Prescription Type 2019 & 2032
- Table 78: Global Opioid Induced Constipation Industry Volume K Unit Forecast, by Prescription Type 2019 & 2032
- Table 79: Global Opioid Induced Constipation Industry Revenue Million Forecast, by End-User 2019 & 2032
- Table 80: Global Opioid Induced Constipation Industry Volume K Unit Forecast, by End-User 2019 & 2032
- Table 81: Global Opioid Induced Constipation Industry Revenue Million Forecast, by Country 2019 & 2032
- Table 82: Global Opioid Induced Constipation Industry Volume K Unit Forecast, by Country 2019 & 2032
- Table 83: GCC Opioid Induced Constipation Industry Revenue (Million) Forecast, by Application 2019 & 2032
- Table 84: GCC Opioid Induced Constipation Industry Volume (K Unit) Forecast, by Application 2019 & 2032
- Table 85: South Africa Opioid Induced Constipation Industry Revenue (Million) Forecast, by Application 2019 & 2032
- Table 86: South Africa Opioid Induced Constipation Industry Volume (K Unit) Forecast, by Application 2019 & 2032
- Table 87: Rest of Middle East and Africa Opioid Induced Constipation Industry Revenue (Million) Forecast, by Application 2019 & 2032
- Table 88: Rest of Middle East and Africa Opioid Induced Constipation Industry Volume (K Unit) Forecast, by Application 2019 & 2032
- Table 89: Global Opioid Induced Constipation Industry Revenue Million Forecast, by Drug Class 2019 & 2032
- Table 90: Global Opioid Induced Constipation Industry Volume K Unit Forecast, by Drug Class 2019 & 2032
- Table 91: Global Opioid Induced Constipation Industry Revenue Million Forecast, by Prescription Type 2019 & 2032
- Table 92: Global Opioid Induced Constipation Industry Volume K Unit Forecast, by Prescription Type 2019 & 2032
- Table 93: Global Opioid Induced Constipation Industry Revenue Million Forecast, by End-User 2019 & 2032
- Table 94: Global Opioid Induced Constipation Industry Volume K Unit Forecast, by End-User 2019 & 2032
- Table 95: Global Opioid Induced Constipation Industry Revenue Million Forecast, by Country 2019 & 2032
- Table 96: Global Opioid Induced Constipation Industry Volume K Unit Forecast, by Country 2019 & 2032
- Table 97: Brazil Opioid Induced Constipation Industry Revenue (Million) Forecast, by Application 2019 & 2032
- Table 98: Brazil Opioid Induced Constipation Industry Volume (K Unit) Forecast, by Application 2019 & 2032
- Table 99: Argentina Opioid Induced Constipation Industry Revenue (Million) Forecast, by Application 2019 & 2032
- Table 100: Argentina Opioid Induced Constipation Industry Volume (K Unit) Forecast, by Application 2019 & 2032
- Table 101: Rest of South America Opioid Induced Constipation Industry Revenue (Million) Forecast, by Application 2019 & 2032
- Table 102: Rest of South America Opioid Induced Constipation Industry Volume (K Unit) Forecast, by Application 2019 & 2032
Frequently Asked Questions
1. What is the projected Compound Annual Growth Rate (CAGR) of the Opioid Induced Constipation Industry?
The projected CAGR is approximately > 4.50%.
2. Which companies are prominent players in the Opioid Induced Constipation Industry?
Key companies in the market include Bausch Heath (Salix Pharmaceuticals ), Merck & Co Inc, Shionogi & Co Ltd, Takeda Pharmaceutical, Novartis AG (Sandoz), RedHill Biopharma, AstraZeneca plc, GlaxoSmithKline (Theravance Biopharma Inc), Mallinckrodt Pharmaceuticals.
3. What are the main segments of the Opioid Induced Constipation Industry?
The market segments include Drug Class, Prescription Type, End-User.
4. Can you provide details about the market size?
The market size is estimated to be USD XX Million as of 2022.
5. What are some drivers contributing to market growth?
Rise in the Availability of Effective OIC Drugs Along with Growing Prevalence of Chronic Idiopathic Pains; Increasing Use of Opioid Analgesic Prescriptions Along with Growing Geriatric Population in Developed Nations.
6. What are the notable trends driving market growth?
The Mu-opioid Receptor Antagonists in Drug Class Segment are Expected to Hold the Large Market Share in the Opioid-Induced Constipation Market.
7. Are there any restraints impacting market growth?
Clinical Trials on Next Generation Analgesics as an Alternative to Opioid Analgesics; Lack of Awareness and Reluctance Among Patients due to Adverse Effects of OIC Drugs.
8. Can you provide examples of recent developments in the market?
In March 2022, Bausch Health Companies Inc. and its gastroenterology business, Salix Pharmaceuticals reported that research revealed that patients who received prescription medications approved by the United States Food and Drug Administration (FDA) for opioid-induced constipation (OIC-Rx), including RELISTOR subcutaneous injection (SC) (methylnaltrexone bromide), in the emergency department (ED) were less likely to be hospitalized, and when hospitalized, had a shorter length of stay than patients who did not receive an OIC-Rx in the ED. These findings highlight the potential for RELISTOR SC to provide relief for patients with OIC.
9. What pricing options are available for accessing the report?
Pricing options include single-user, multi-user, and enterprise licenses priced at USD 4750, USD 5250, and USD 8750 respectively.
10. Is the market size provided in terms of value or volume?
The market size is provided in terms of value, measured in Million and volume, measured in K Unit.
11. Are there any specific market keywords associated with the report?
Yes, the market keyword associated with the report is "Opioid Induced Constipation Industry," which aids in identifying and referencing the specific market segment covered.
12. How do I determine which pricing option suits my needs best?
The pricing options vary based on user requirements and access needs. Individual users may opt for single-user licenses, while businesses requiring broader access may choose multi-user or enterprise licenses for cost-effective access to the report.
13. Are there any additional resources or data provided in the Opioid Induced Constipation Industry report?
While the report offers comprehensive insights, it's advisable to review the specific contents or supplementary materials provided to ascertain if additional resources or data are available.
14. How can I stay updated on further developments or reports in the Opioid Induced Constipation Industry?
To stay informed about further developments, trends, and reports in the Opioid Induced Constipation Industry, consider subscribing to industry newsletters, following relevant companies and organizations, or regularly checking reputable industry news sources and publications.
Methodology
Step 1 - Identification of Relevant Samples Size from Population Database


Step 2 - Approaches for Defining Global Market Size (Value, Volume* & Price*)

Note*: In applicable scenarios
Step 3 - Data Sources
Primary Research
- Web Analytics
- Survey Reports
- Research Institute
- Latest Research Reports
- Opinion Leaders
Secondary Research
- Annual Reports
- White Paper
- Latest Press Release
- Industry Association
- Paid Database
- Investor Presentations

Step 4 - Data Triangulation
Involves using different sources of information in order to increase the validity of a study
These sources are likely to be stakeholders in a program - participants, other researchers, program staff, other community members, and so on.
Then we put all data in single framework & apply various statistical tools to find out the dynamic on the market.
During the analysis stage, feedback from the stakeholder groups would be compared to determine areas of agreement as well as areas of divergence


