
Key Insights
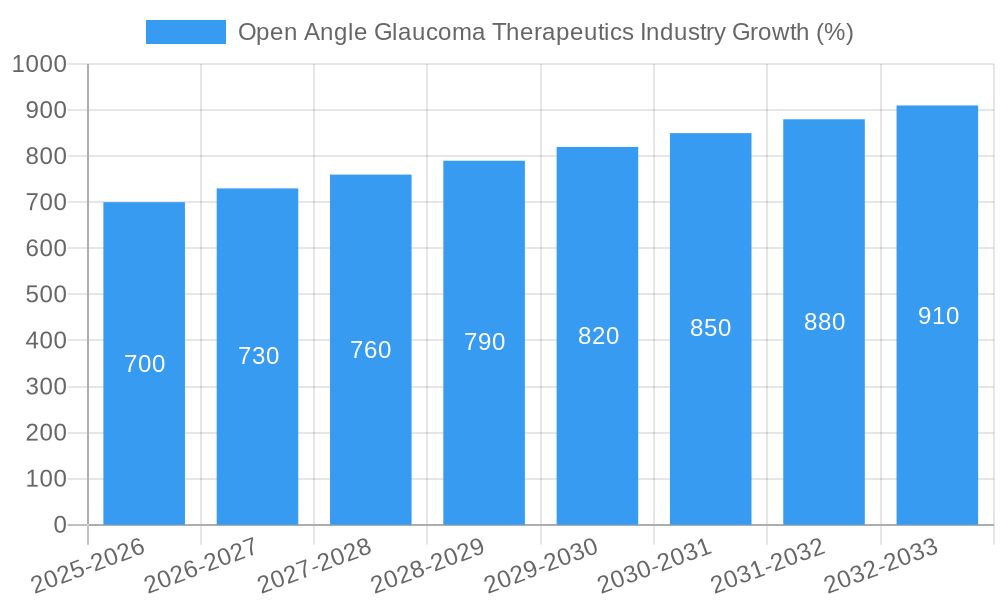
The Open Angle Glaucoma (OAG) therapeutics market, a significant segment of the broader glaucoma treatment landscape, is experiencing steady growth driven by a rising prevalence of OAG globally, particularly among aging populations. The market's Compound Annual Growth Rate (CAGR) of 4.60% from 2019-2024 suggests a robust trajectory, projected to continue into the forecast period (2025-2033). This growth is fueled by several key factors, including increased awareness and early diagnosis of glaucoma, advancements in therapeutic options, and the development of more effective and convenient drug delivery systems. The market is segmented by drug class, with Prostaglandin Analogs, Beta Blockers, and Alpha Agonists currently dominating, due to their established efficacy and widespread use. However, the market is also witnessing the emergence of newer drug classes and innovative treatment modalities, presenting significant opportunities for growth in the coming years. While increased healthcare costs and the potential for adverse effects associated with certain treatments pose challenges, the overall market outlook remains positive, driven by the unmet medical need and ongoing research efforts focused on improving treatment outcomes.
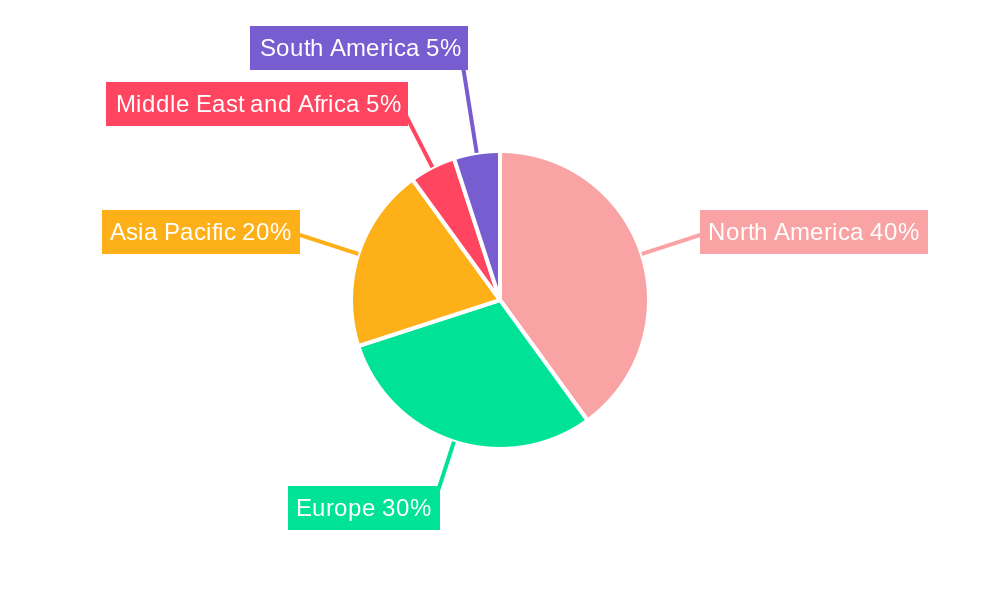
The competitive landscape is shaped by both established pharmaceutical giants and emerging biotech companies. Key players like Novartis, Merck, Bausch Health, and Allergan are leveraging their existing infrastructure and expertise to strengthen their market positions. Smaller players, on the other hand, are focusing on developing novel therapies and leveraging niche market segments. Geographical expansion is another significant factor influencing market dynamics, with North America and Europe currently representing substantial market shares. However, the Asia Pacific region is anticipated to experience considerable growth driven by increasing healthcare expenditure and rising glaucoma prevalence in countries such as China and India. Successful market penetration strategies will likely involve addressing affordability concerns, improving healthcare infrastructure, and focusing on patient education and outreach programs. The long-term success of OAG therapeutics will hinge on continuing innovation, improved patient compliance, and a concerted effort to address the growing global health burden of glaucoma.
Open Angle Glaucoma Therapeutics Market: A Comprehensive Report (2019-2033)
This comprehensive report provides an in-depth analysis of the Open Angle Glaucoma Therapeutics industry, offering valuable insights for stakeholders, investors, and industry professionals. Covering the period from 2019 to 2033, with a base year of 2025 and a forecast period of 2025-2033, this report meticulously examines market dynamics, competitive landscapes, and future growth projections. The study includes detailed segmentation by indication (Open Angle Glaucoma, Closed Angle Glaucoma, Secondary Glaucoma, Congenital Glaucoma, Others) and drug class (Prostaglandin Analogs, Beta Blockers, Alpha Agonist, Carbonic Anhydrase Inhibitors, Others). The total market size is projected to reach xx Million by 2033.
Open Angle Glaucoma Therapeutics Industry Market Structure & Competitive Dynamics
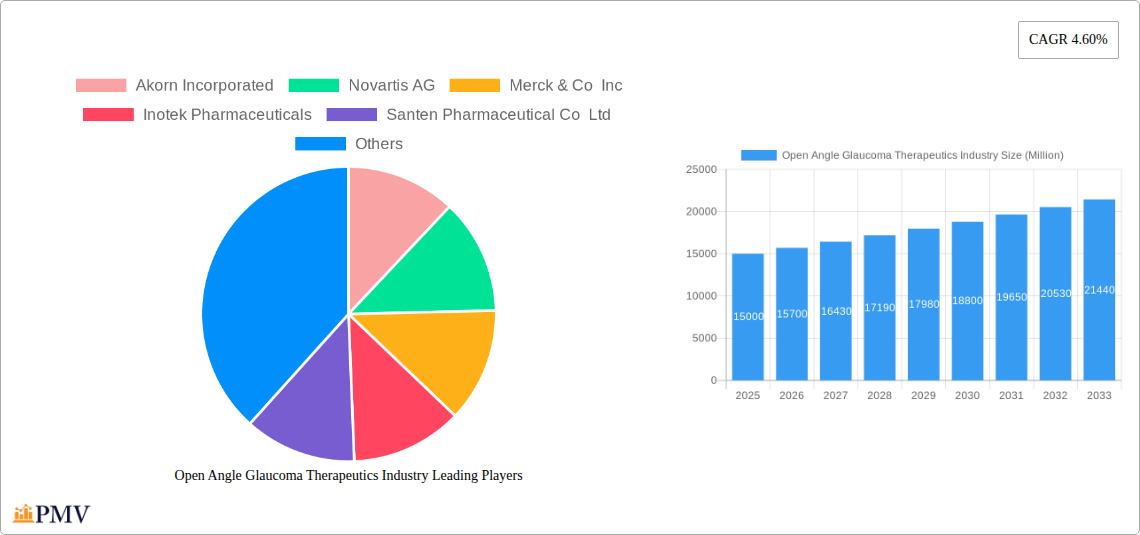
This section analyzes the competitive landscape of the Open Angle Glaucoma Therapeutics market, examining market concentration, innovation ecosystems, regulatory frameworks, and market dynamics. The report details the market share of key players including Akorn Incorporated, Novartis AG, Merck & Co Inc, Inotek Pharmaceuticals, Santen Pharmaceutical Co Ltd, Bausch Health (Bausch & Lomb Incorporated), Aerie Pharmaceuticals Inc, Pfizer Inc, and Abbvie Inc (Allergan Plc). The analysis includes an assessment of the impact of mergers and acquisitions (M&A) activities, with an estimated total M&A deal value of xx Million during the historical period (2019-2024). Furthermore, the report identifies key trends impacting market structure, such as increasing adoption of innovative therapies, stringent regulatory approvals, and the emergence of biosimilars. The report also details the competitive strategies adopted by major players, including product launches, partnerships, and geographic expansion, impacting the overall market dynamics and future growth trajectories. The level of market concentration will be evaluated using metrics like the Herfindahl-Hirschman Index (HHI), providing a clear understanding of the competitive intensity. The report considers the influence of evolving regulatory landscapes, including FDA approvals and pricing policies, on market access and competitiveness.
Open Angle Glaucoma Therapeutics Industry Industry Trends & Insights
This section delves into the key trends shaping the Open Angle Glaucoma Therapeutics market. The compound annual growth rate (CAGR) for the forecast period (2025-2033) is projected to be xx%, driven by factors such as the increasing prevalence of glaucoma, advancements in treatment modalities, and rising healthcare expenditure. The report examines the market penetration of various drug classes, highlighting the dominance of Prostaglandin Analogs and the growing adoption of newer therapies. Technological disruptions, such as the development of novel drug delivery systems and personalized medicine approaches, are analyzed for their potential impact on market growth. The report also explores evolving consumer preferences, including demand for minimally invasive treatments and improved patient outcomes, shaping the market trajectory. Competitive dynamics, including the emergence of new players and strategic alliances, are evaluated for their impact on market share and pricing strategies. The report further explores the influence of healthcare policies and reimbursement schemes on market access and affordability of glaucoma therapeutics.
Dominant Markets & Segments in Open Angle Glaucoma Therapeutics Industry
This section identifies the leading markets and segments within the Open Angle Glaucoma Therapeutics industry. The North American market is expected to dominate the global market, followed by Europe and Asia Pacific.
Key Drivers for Dominant Regions:
- North America: High prevalence of glaucoma, robust healthcare infrastructure, and high healthcare expenditure.
- Europe: Growing geriatric population, increasing awareness about glaucoma, and supportive government initiatives.
- Asia Pacific: Rising prevalence of glaucoma, increasing disposable incomes, and expanding healthcare access.
Dominant Segments by Indication:
- Open Angle Glaucoma: This segment holds the largest market share due to the high prevalence of this condition globally.
- Closed Angle Glaucoma: While smaller than open-angle glaucoma, this segment is experiencing growth driven by advancements in surgical and pharmacological treatments.
- Secondary Glaucoma: Growth in this segment is linked to an increase in the prevalence of associated conditions.
- Congenital Glaucoma: This niche segment shows moderate growth driven by advancements in early diagnosis and treatment.
Dominant Segments by Drug Class:
- Prostaglandin Analogs: This segment currently dominates due to its efficacy and safety profile.
- Beta Blockers: This segment maintains a significant market share, though facing competition from newer drug classes.
- Alpha Agonists: A smaller segment with a stable market share.
- Carbonic Anhydrase Inhibitors: This segment continues to maintain a presence, although growth may be limited by side-effect profiles.
Open Angle Glaucoma Therapeutics Industry Product Innovations
Recent product innovations include the development of novel drug delivery systems (e.g., sustained-release formulations) aiming to improve patient compliance and efficacy. There's a focus on combination therapies to reduce polypharmacy and improve treatment outcomes. The market also witnesses a rise in biosimilars, offering cost-effective alternatives to established brands. These innovations directly address unmet clinical needs and improve the overall treatment experience for patients.
Report Segmentation & Scope
This report segments the Open Angle Glaucoma Therapeutics market by indication (Open Angle Glaucoma, Closed Angle Glaucoma, Secondary Glaucoma, Congenital Glaucoma, Others) and by drug class (Prostaglandin Analogs, Beta Blockers, Alpha Agonist, Carbonic Anhydrase Inhibitors, Others). Each segment's growth projections, market sizes, and competitive dynamics are thoroughly analyzed. The market size for each segment is projected to reach xx Million by 2033, with varying growth rates depending on the specific indication and drug class. Competitive intensity varies across segments, with some experiencing higher competition than others.
Key Drivers of Open Angle Glaucoma Therapeutics Industry Growth
The market's growth is propelled by several factors: the rising prevalence of glaucoma globally, particularly among aging populations; technological advancements leading to the development of more effective and safer therapies; increased healthcare expenditure and improved access to healthcare services; and growing awareness and early diagnosis initiatives. Governmental support for glaucoma research and treatment further fuels market expansion.
Challenges in the Open Angle Glaucoma Therapeutics Industry Sector
Challenges include stringent regulatory approvals that can delay market entry of new products; potential supply chain disruptions affecting drug availability; intense competition among established players and emerging companies; and pricing pressures impacting profitability. The high cost of treatment also poses a challenge, particularly in low- and middle-income countries, affecting overall market penetration.
Leading Players in the Open Angle Glaucoma Therapeutics Industry Market
- Akorn Incorporated
- Novartis AG
- Merck & Co Inc
- Inotek Pharmaceuticals
- Santen Pharmaceutical Co Ltd
- Bausch Health (Bausch & Lomb Incorporated)
- Aerie Pharmaceuticals Inc
- Pfizer Inc
- Abbvie Inc (Allergan Plc)
Key Developments in Open Angle Glaucoma Therapeutics Industry Sector
- 2022 Q4: Aerie Pharmaceuticals announced positive results from a clinical trial for its new glaucoma treatment.
- 2023 Q1: Novartis launched a new sustained-release formulation of a glaucoma drug.
- 2023 Q2: Merck & Co. Inc. secured FDA approval for a novel glaucoma therapy. (Further developments need to be added here as they occur)
Strategic Open Angle Glaucoma Therapeutics Industry Market Outlook
The Open Angle Glaucoma Therapeutics market presents significant growth opportunities driven by technological advancements, increasing prevalence of glaucoma, and favorable regulatory environments. Strategic partnerships, focusing on innovative therapies and improved drug delivery systems, will play a vital role in shaping future market dynamics. Expansion into emerging markets with high unmet needs will be crucial for sustained growth. The market anticipates continued innovation in combination therapies and personalized medicine approaches, leading to improved patient outcomes and stronger market positions for leading players.
Open Angle Glaucoma Therapeutics Industry Segmentation
-
1. Indication
- 1.1. Open Angle Glaucoma
- 1.2. Closed Angle Glaucoma
- 1.3. Secondary Glaucoma
- 1.4. Congenital Glaucoma
- 1.5. Others
-
2. Drug Class
- 2.1. Prostaglandin Analogs
- 2.2. Beta Blockers
- 2.3. Alpha Agonist
- 2.4. Carbonic Anhydrase Inhibitors
- 2.5. Others
Open Angle Glaucoma Therapeutics Industry Segmentation By Geography
-
1. North America
- 1.1. United States
- 1.2. Canada
- 1.3. Mexico
-
2. Europe
- 2.1. Germany
- 2.2. United Kingdom
- 2.3. France
- 2.4. Italy
- 2.5. Spain
- 2.6. Rest of Europe
-
3. Asia Pacific
- 3.1. China
- 3.2. Japan
- 3.3. India
- 3.4. Australia
- 3.5. South Korea
- 3.6. Rest of Asia Pacific
-
4. Middle East and Africa
- 4.1. GCC
- 4.2. South Africa
- 4.3. Rest of Middle East and Africa
-
5. South America
- 5.1. Brazil
- 5.2. Argentina
- 5.3. Rest of South America
Open Angle Glaucoma Therapeutics Industry REPORT HIGHLIGHTS
| Aspects | Details |
|---|---|
| Study Period | 2019-2033 |
| Base Year | 2024 |
| Estimated Year | 2025 |
| Forecast Period | 2025-2033 |
| Historical Period | 2019-2024 |
| Growth Rate | CAGR of 4.60% from 2019-2033 |
| Segmentation |
|
Table of Contents
- 1. Introduction
- 1.1. Research Scope
- 1.2. Market Segmentation
- 1.3. Research Methodology
- 1.4. Definitions and Assumptions
- 2. Executive Summary
- 2.1. Introduction
- 3. Market Dynamics
- 3.1. Introduction
- 3.2. Market Drivers
- 3.2.1. ; Increasing Prevalence of Glaucoma; Rising Initiatives to Increase Awareness about the Glaucoma; Technological Advancements in the Field of Ophthalmology
- 3.3. Market Restrains
- 3.3.1. ; Side Effects associated with the Products; Stringent Approval Process
- 3.4. Market Trends
- 3.4.1. Prostaglandin Analogs is the Segment by Drug Class that is Expected to Witness Fastest Growth Over the Forecast Period
- 4. Market Factor Analysis
- 4.1. Porters Five Forces
- 4.2. Supply/Value Chain
- 4.3. PESTEL analysis
- 4.4. Market Entropy
- 4.5. Patent/Trademark Analysis
- 5. Global Open Angle Glaucoma Therapeutics Industry Analysis, Insights and Forecast, 2019-2031
- 5.1. Market Analysis, Insights and Forecast - by Indication
- 5.1.1. Open Angle Glaucoma
- 5.1.2. Closed Angle Glaucoma
- 5.1.3. Secondary Glaucoma
- 5.1.4. Congenital Glaucoma
- 5.1.5. Others
- 5.2. Market Analysis, Insights and Forecast - by Drug Class
- 5.2.1. Prostaglandin Analogs
- 5.2.2. Beta Blockers
- 5.2.3. Alpha Agonist
- 5.2.4. Carbonic Anhydrase Inhibitors
- 5.2.5. Others
- 5.3. Market Analysis, Insights and Forecast - by Region
- 5.3.1. North America
- 5.3.2. Europe
- 5.3.3. Asia Pacific
- 5.3.4. Middle East and Africa
- 5.3.5. South America
- 5.1. Market Analysis, Insights and Forecast - by Indication
- 6. North America Open Angle Glaucoma Therapeutics Industry Analysis, Insights and Forecast, 2019-2031
- 6.1. Market Analysis, Insights and Forecast - by Indication
- 6.1.1. Open Angle Glaucoma
- 6.1.2. Closed Angle Glaucoma
- 6.1.3. Secondary Glaucoma
- 6.1.4. Congenital Glaucoma
- 6.1.5. Others
- 6.2. Market Analysis, Insights and Forecast - by Drug Class
- 6.2.1. Prostaglandin Analogs
- 6.2.2. Beta Blockers
- 6.2.3. Alpha Agonist
- 6.2.4. Carbonic Anhydrase Inhibitors
- 6.2.5. Others
- 6.1. Market Analysis, Insights and Forecast - by Indication
- 7. Europe Open Angle Glaucoma Therapeutics Industry Analysis, Insights and Forecast, 2019-2031
- 7.1. Market Analysis, Insights and Forecast - by Indication
- 7.1.1. Open Angle Glaucoma
- 7.1.2. Closed Angle Glaucoma
- 7.1.3. Secondary Glaucoma
- 7.1.4. Congenital Glaucoma
- 7.1.5. Others
- 7.2. Market Analysis, Insights and Forecast - by Drug Class
- 7.2.1. Prostaglandin Analogs
- 7.2.2. Beta Blockers
- 7.2.3. Alpha Agonist
- 7.2.4. Carbonic Anhydrase Inhibitors
- 7.2.5. Others
- 7.1. Market Analysis, Insights and Forecast - by Indication
- 8. Asia Pacific Open Angle Glaucoma Therapeutics Industry Analysis, Insights and Forecast, 2019-2031
- 8.1. Market Analysis, Insights and Forecast - by Indication
- 8.1.1. Open Angle Glaucoma
- 8.1.2. Closed Angle Glaucoma
- 8.1.3. Secondary Glaucoma
- 8.1.4. Congenital Glaucoma
- 8.1.5. Others
- 8.2. Market Analysis, Insights and Forecast - by Drug Class
- 8.2.1. Prostaglandin Analogs
- 8.2.2. Beta Blockers
- 8.2.3. Alpha Agonist
- 8.2.4. Carbonic Anhydrase Inhibitors
- 8.2.5. Others
- 8.1. Market Analysis, Insights and Forecast - by Indication
- 9. Middle East and Africa Open Angle Glaucoma Therapeutics Industry Analysis, Insights and Forecast, 2019-2031
- 9.1. Market Analysis, Insights and Forecast - by Indication
- 9.1.1. Open Angle Glaucoma
- 9.1.2. Closed Angle Glaucoma
- 9.1.3. Secondary Glaucoma
- 9.1.4. Congenital Glaucoma
- 9.1.5. Others
- 9.2. Market Analysis, Insights and Forecast - by Drug Class
- 9.2.1. Prostaglandin Analogs
- 9.2.2. Beta Blockers
- 9.2.3. Alpha Agonist
- 9.2.4. Carbonic Anhydrase Inhibitors
- 9.2.5. Others
- 9.1. Market Analysis, Insights and Forecast - by Indication
- 10. South America Open Angle Glaucoma Therapeutics Industry Analysis, Insights and Forecast, 2019-2031
- 10.1. Market Analysis, Insights and Forecast - by Indication
- 10.1.1. Open Angle Glaucoma
- 10.1.2. Closed Angle Glaucoma
- 10.1.3. Secondary Glaucoma
- 10.1.4. Congenital Glaucoma
- 10.1.5. Others
- 10.2. Market Analysis, Insights and Forecast - by Drug Class
- 10.2.1. Prostaglandin Analogs
- 10.2.2. Beta Blockers
- 10.2.3. Alpha Agonist
- 10.2.4. Carbonic Anhydrase Inhibitors
- 10.2.5. Others
- 10.1. Market Analysis, Insights and Forecast - by Indication
- 11. North America Open Angle Glaucoma Therapeutics Industry Analysis, Insights and Forecast, 2019-2031
- 11.1. Market Analysis, Insights and Forecast - By Country/Sub-region
- 11.1.1 United States
- 11.1.2 Canada
- 11.1.3 Mexico
- 12. Europe Open Angle Glaucoma Therapeutics Industry Analysis, Insights and Forecast, 2019-2031
- 12.1. Market Analysis, Insights and Forecast - By Country/Sub-region
- 12.1.1 Germany
- 12.1.2 United Kingdom
- 12.1.3 France
- 12.1.4 Italy
- 12.1.5 Spain
- 12.1.6 Rest of Europe
- 13. Asia Pacific Open Angle Glaucoma Therapeutics Industry Analysis, Insights and Forecast, 2019-2031
- 13.1. Market Analysis, Insights and Forecast - By Country/Sub-region
- 13.1.1 China
- 13.1.2 Japan
- 13.1.3 India
- 13.1.4 Australia
- 13.1.5 South Korea
- 13.1.6 Rest of Asia Pacific
- 14. Middle East and Africa Open Angle Glaucoma Therapeutics Industry Analysis, Insights and Forecast, 2019-2031
- 14.1. Market Analysis, Insights and Forecast - By Country/Sub-region
- 14.1.1 GCC
- 14.1.2 South Africa
- 14.1.3 Rest of Middle East and Africa
- 15. South America Open Angle Glaucoma Therapeutics Industry Analysis, Insights and Forecast, 2019-2031
- 15.1. Market Analysis, Insights and Forecast - By Country/Sub-region
- 15.1.1 Brazil
- 15.1.2 Argentina
- 15.1.3 Rest of South America
- 16. Competitive Analysis
- 16.1. Global Market Share Analysis 2024
- 16.2. Company Profiles
- 16.2.1 Akorn Incorporated
- 16.2.1.1. Overview
- 16.2.1.2. Products
- 16.2.1.3. SWOT Analysis
- 16.2.1.4. Recent Developments
- 16.2.1.5. Financials (Based on Availability)
- 16.2.2 Novartis AG
- 16.2.2.1. Overview
- 16.2.2.2. Products
- 16.2.2.3. SWOT Analysis
- 16.2.2.4. Recent Developments
- 16.2.2.5. Financials (Based on Availability)
- 16.2.3 Merck & Co Inc
- 16.2.3.1. Overview
- 16.2.3.2. Products
- 16.2.3.3. SWOT Analysis
- 16.2.3.4. Recent Developments
- 16.2.3.5. Financials (Based on Availability)
- 16.2.4 Inotek Pharmaceuticals
- 16.2.4.1. Overview
- 16.2.4.2. Products
- 16.2.4.3. SWOT Analysis
- 16.2.4.4. Recent Developments
- 16.2.4.5. Financials (Based on Availability)
- 16.2.5 Santen Pharmaceutical Co Ltd
- 16.2.5.1. Overview
- 16.2.5.2. Products
- 16.2.5.3. SWOT Analysis
- 16.2.5.4. Recent Developments
- 16.2.5.5. Financials (Based on Availability)
- 16.2.6 Bausch Health (Bausch & Lomb Incorporated)
- 16.2.6.1. Overview
- 16.2.6.2. Products
- 16.2.6.3. SWOT Analysis
- 16.2.6.4. Recent Developments
- 16.2.6.5. Financials (Based on Availability)
- 16.2.7 Aerie Pharmaceuticals Inc
- 16.2.7.1. Overview
- 16.2.7.2. Products
- 16.2.7.3. SWOT Analysis
- 16.2.7.4. Recent Developments
- 16.2.7.5. Financials (Based on Availability)
- 16.2.8 Pfizer Inc
- 16.2.8.1. Overview
- 16.2.8.2. Products
- 16.2.8.3. SWOT Analysis
- 16.2.8.4. Recent Developments
- 16.2.8.5. Financials (Based on Availability)
- 16.2.9 Abbvie Inc (Allergan Plc)
- 16.2.9.1. Overview
- 16.2.9.2. Products
- 16.2.9.3. SWOT Analysis
- 16.2.9.4. Recent Developments
- 16.2.9.5. Financials (Based on Availability)
- 16.2.1 Akorn Incorporated
List of Figures
- Figure 1: Global Open Angle Glaucoma Therapeutics Industry Revenue Breakdown (Million, %) by Region 2024 & 2032
- Figure 2: Global Open Angle Glaucoma Therapeutics Industry Volume Breakdown (K Unit, %) by Region 2024 & 2032
- Figure 3: North America Open Angle Glaucoma Therapeutics Industry Revenue (Million), by Country 2024 & 2032
- Figure 4: North America Open Angle Glaucoma Therapeutics Industry Volume (K Unit), by Country 2024 & 2032
- Figure 5: North America Open Angle Glaucoma Therapeutics Industry Revenue Share (%), by Country 2024 & 2032
- Figure 6: North America Open Angle Glaucoma Therapeutics Industry Volume Share (%), by Country 2024 & 2032
- Figure 7: Europe Open Angle Glaucoma Therapeutics Industry Revenue (Million), by Country 2024 & 2032
- Figure 8: Europe Open Angle Glaucoma Therapeutics Industry Volume (K Unit), by Country 2024 & 2032
- Figure 9: Europe Open Angle Glaucoma Therapeutics Industry Revenue Share (%), by Country 2024 & 2032
- Figure 10: Europe Open Angle Glaucoma Therapeutics Industry Volume Share (%), by Country 2024 & 2032
- Figure 11: Asia Pacific Open Angle Glaucoma Therapeutics Industry Revenue (Million), by Country 2024 & 2032
- Figure 12: Asia Pacific Open Angle Glaucoma Therapeutics Industry Volume (K Unit), by Country 2024 & 2032
- Figure 13: Asia Pacific Open Angle Glaucoma Therapeutics Industry Revenue Share (%), by Country 2024 & 2032
- Figure 14: Asia Pacific Open Angle Glaucoma Therapeutics Industry Volume Share (%), by Country 2024 & 2032
- Figure 15: Middle East and Africa Open Angle Glaucoma Therapeutics Industry Revenue (Million), by Country 2024 & 2032
- Figure 16: Middle East and Africa Open Angle Glaucoma Therapeutics Industry Volume (K Unit), by Country 2024 & 2032
- Figure 17: Middle East and Africa Open Angle Glaucoma Therapeutics Industry Revenue Share (%), by Country 2024 & 2032
- Figure 18: Middle East and Africa Open Angle Glaucoma Therapeutics Industry Volume Share (%), by Country 2024 & 2032
- Figure 19: South America Open Angle Glaucoma Therapeutics Industry Revenue (Million), by Country 2024 & 2032
- Figure 20: South America Open Angle Glaucoma Therapeutics Industry Volume (K Unit), by Country 2024 & 2032
- Figure 21: South America Open Angle Glaucoma Therapeutics Industry Revenue Share (%), by Country 2024 & 2032
- Figure 22: South America Open Angle Glaucoma Therapeutics Industry Volume Share (%), by Country 2024 & 2032
- Figure 23: North America Open Angle Glaucoma Therapeutics Industry Revenue (Million), by Indication 2024 & 2032
- Figure 24: North America Open Angle Glaucoma Therapeutics Industry Volume (K Unit), by Indication 2024 & 2032
- Figure 25: North America Open Angle Glaucoma Therapeutics Industry Revenue Share (%), by Indication 2024 & 2032
- Figure 26: North America Open Angle Glaucoma Therapeutics Industry Volume Share (%), by Indication 2024 & 2032
- Figure 27: North America Open Angle Glaucoma Therapeutics Industry Revenue (Million), by Drug Class 2024 & 2032
- Figure 28: North America Open Angle Glaucoma Therapeutics Industry Volume (K Unit), by Drug Class 2024 & 2032
- Figure 29: North America Open Angle Glaucoma Therapeutics Industry Revenue Share (%), by Drug Class 2024 & 2032
- Figure 30: North America Open Angle Glaucoma Therapeutics Industry Volume Share (%), by Drug Class 2024 & 2032
- Figure 31: North America Open Angle Glaucoma Therapeutics Industry Revenue (Million), by Country 2024 & 2032
- Figure 32: North America Open Angle Glaucoma Therapeutics Industry Volume (K Unit), by Country 2024 & 2032
- Figure 33: North America Open Angle Glaucoma Therapeutics Industry Revenue Share (%), by Country 2024 & 2032
- Figure 34: North America Open Angle Glaucoma Therapeutics Industry Volume Share (%), by Country 2024 & 2032
- Figure 35: Europe Open Angle Glaucoma Therapeutics Industry Revenue (Million), by Indication 2024 & 2032
- Figure 36: Europe Open Angle Glaucoma Therapeutics Industry Volume (K Unit), by Indication 2024 & 2032
- Figure 37: Europe Open Angle Glaucoma Therapeutics Industry Revenue Share (%), by Indication 2024 & 2032
- Figure 38: Europe Open Angle Glaucoma Therapeutics Industry Volume Share (%), by Indication 2024 & 2032
- Figure 39: Europe Open Angle Glaucoma Therapeutics Industry Revenue (Million), by Drug Class 2024 & 2032
- Figure 40: Europe Open Angle Glaucoma Therapeutics Industry Volume (K Unit), by Drug Class 2024 & 2032
- Figure 41: Europe Open Angle Glaucoma Therapeutics Industry Revenue Share (%), by Drug Class 2024 & 2032
- Figure 42: Europe Open Angle Glaucoma Therapeutics Industry Volume Share (%), by Drug Class 2024 & 2032
- Figure 43: Europe Open Angle Glaucoma Therapeutics Industry Revenue (Million), by Country 2024 & 2032
- Figure 44: Europe Open Angle Glaucoma Therapeutics Industry Volume (K Unit), by Country 2024 & 2032
- Figure 45: Europe Open Angle Glaucoma Therapeutics Industry Revenue Share (%), by Country 2024 & 2032
- Figure 46: Europe Open Angle Glaucoma Therapeutics Industry Volume Share (%), by Country 2024 & 2032
- Figure 47: Asia Pacific Open Angle Glaucoma Therapeutics Industry Revenue (Million), by Indication 2024 & 2032
- Figure 48: Asia Pacific Open Angle Glaucoma Therapeutics Industry Volume (K Unit), by Indication 2024 & 2032
- Figure 49: Asia Pacific Open Angle Glaucoma Therapeutics Industry Revenue Share (%), by Indication 2024 & 2032
- Figure 50: Asia Pacific Open Angle Glaucoma Therapeutics Industry Volume Share (%), by Indication 2024 & 2032
- Figure 51: Asia Pacific Open Angle Glaucoma Therapeutics Industry Revenue (Million), by Drug Class 2024 & 2032
- Figure 52: Asia Pacific Open Angle Glaucoma Therapeutics Industry Volume (K Unit), by Drug Class 2024 & 2032
- Figure 53: Asia Pacific Open Angle Glaucoma Therapeutics Industry Revenue Share (%), by Drug Class 2024 & 2032
- Figure 54: Asia Pacific Open Angle Glaucoma Therapeutics Industry Volume Share (%), by Drug Class 2024 & 2032
- Figure 55: Asia Pacific Open Angle Glaucoma Therapeutics Industry Revenue (Million), by Country 2024 & 2032
- Figure 56: Asia Pacific Open Angle Glaucoma Therapeutics Industry Volume (K Unit), by Country 2024 & 2032
- Figure 57: Asia Pacific Open Angle Glaucoma Therapeutics Industry Revenue Share (%), by Country 2024 & 2032
- Figure 58: Asia Pacific Open Angle Glaucoma Therapeutics Industry Volume Share (%), by Country 2024 & 2032
- Figure 59: Middle East and Africa Open Angle Glaucoma Therapeutics Industry Revenue (Million), by Indication 2024 & 2032
- Figure 60: Middle East and Africa Open Angle Glaucoma Therapeutics Industry Volume (K Unit), by Indication 2024 & 2032
- Figure 61: Middle East and Africa Open Angle Glaucoma Therapeutics Industry Revenue Share (%), by Indication 2024 & 2032
- Figure 62: Middle East and Africa Open Angle Glaucoma Therapeutics Industry Volume Share (%), by Indication 2024 & 2032
- Figure 63: Middle East and Africa Open Angle Glaucoma Therapeutics Industry Revenue (Million), by Drug Class 2024 & 2032
- Figure 64: Middle East and Africa Open Angle Glaucoma Therapeutics Industry Volume (K Unit), by Drug Class 2024 & 2032
- Figure 65: Middle East and Africa Open Angle Glaucoma Therapeutics Industry Revenue Share (%), by Drug Class 2024 & 2032
- Figure 66: Middle East and Africa Open Angle Glaucoma Therapeutics Industry Volume Share (%), by Drug Class 2024 & 2032
- Figure 67: Middle East and Africa Open Angle Glaucoma Therapeutics Industry Revenue (Million), by Country 2024 & 2032
- Figure 68: Middle East and Africa Open Angle Glaucoma Therapeutics Industry Volume (K Unit), by Country 2024 & 2032
- Figure 69: Middle East and Africa Open Angle Glaucoma Therapeutics Industry Revenue Share (%), by Country 2024 & 2032
- Figure 70: Middle East and Africa Open Angle Glaucoma Therapeutics Industry Volume Share (%), by Country 2024 & 2032
- Figure 71: South America Open Angle Glaucoma Therapeutics Industry Revenue (Million), by Indication 2024 & 2032
- Figure 72: South America Open Angle Glaucoma Therapeutics Industry Volume (K Unit), by Indication 2024 & 2032
- Figure 73: South America Open Angle Glaucoma Therapeutics Industry Revenue Share (%), by Indication 2024 & 2032
- Figure 74: South America Open Angle Glaucoma Therapeutics Industry Volume Share (%), by Indication 2024 & 2032
- Figure 75: South America Open Angle Glaucoma Therapeutics Industry Revenue (Million), by Drug Class 2024 & 2032
- Figure 76: South America Open Angle Glaucoma Therapeutics Industry Volume (K Unit), by Drug Class 2024 & 2032
- Figure 77: South America Open Angle Glaucoma Therapeutics Industry Revenue Share (%), by Drug Class 2024 & 2032
- Figure 78: South America Open Angle Glaucoma Therapeutics Industry Volume Share (%), by Drug Class 2024 & 2032
- Figure 79: South America Open Angle Glaucoma Therapeutics Industry Revenue (Million), by Country 2024 & 2032
- Figure 80: South America Open Angle Glaucoma Therapeutics Industry Volume (K Unit), by Country 2024 & 2032
- Figure 81: South America Open Angle Glaucoma Therapeutics Industry Revenue Share (%), by Country 2024 & 2032
- Figure 82: South America Open Angle Glaucoma Therapeutics Industry Volume Share (%), by Country 2024 & 2032
List of Tables
- Table 1: Global Open Angle Glaucoma Therapeutics Industry Revenue Million Forecast, by Region 2019 & 2032
- Table 2: Global Open Angle Glaucoma Therapeutics Industry Volume K Unit Forecast, by Region 2019 & 2032
- Table 3: Global Open Angle Glaucoma Therapeutics Industry Revenue Million Forecast, by Indication 2019 & 2032
- Table 4: Global Open Angle Glaucoma Therapeutics Industry Volume K Unit Forecast, by Indication 2019 & 2032
- Table 5: Global Open Angle Glaucoma Therapeutics Industry Revenue Million Forecast, by Drug Class 2019 & 2032
- Table 6: Global Open Angle Glaucoma Therapeutics Industry Volume K Unit Forecast, by Drug Class 2019 & 2032
- Table 7: Global Open Angle Glaucoma Therapeutics Industry Revenue Million Forecast, by Region 2019 & 2032
- Table 8: Global Open Angle Glaucoma Therapeutics Industry Volume K Unit Forecast, by Region 2019 & 2032
- Table 9: Global Open Angle Glaucoma Therapeutics Industry Revenue Million Forecast, by Country 2019 & 2032
- Table 10: Global Open Angle Glaucoma Therapeutics Industry Volume K Unit Forecast, by Country 2019 & 2032
- Table 11: United States Open Angle Glaucoma Therapeutics Industry Revenue (Million) Forecast, by Application 2019 & 2032
- Table 12: United States Open Angle Glaucoma Therapeutics Industry Volume (K Unit) Forecast, by Application 2019 & 2032
- Table 13: Canada Open Angle Glaucoma Therapeutics Industry Revenue (Million) Forecast, by Application 2019 & 2032
- Table 14: Canada Open Angle Glaucoma Therapeutics Industry Volume (K Unit) Forecast, by Application 2019 & 2032
- Table 15: Mexico Open Angle Glaucoma Therapeutics Industry Revenue (Million) Forecast, by Application 2019 & 2032
- Table 16: Mexico Open Angle Glaucoma Therapeutics Industry Volume (K Unit) Forecast, by Application 2019 & 2032
- Table 17: Global Open Angle Glaucoma Therapeutics Industry Revenue Million Forecast, by Country 2019 & 2032
- Table 18: Global Open Angle Glaucoma Therapeutics Industry Volume K Unit Forecast, by Country 2019 & 2032
- Table 19: Germany Open Angle Glaucoma Therapeutics Industry Revenue (Million) Forecast, by Application 2019 & 2032
- Table 20: Germany Open Angle Glaucoma Therapeutics Industry Volume (K Unit) Forecast, by Application 2019 & 2032
- Table 21: United Kingdom Open Angle Glaucoma Therapeutics Industry Revenue (Million) Forecast, by Application 2019 & 2032
- Table 22: United Kingdom Open Angle Glaucoma Therapeutics Industry Volume (K Unit) Forecast, by Application 2019 & 2032
- Table 23: France Open Angle Glaucoma Therapeutics Industry Revenue (Million) Forecast, by Application 2019 & 2032
- Table 24: France Open Angle Glaucoma Therapeutics Industry Volume (K Unit) Forecast, by Application 2019 & 2032
- Table 25: Italy Open Angle Glaucoma Therapeutics Industry Revenue (Million) Forecast, by Application 2019 & 2032
- Table 26: Italy Open Angle Glaucoma Therapeutics Industry Volume (K Unit) Forecast, by Application 2019 & 2032
- Table 27: Spain Open Angle Glaucoma Therapeutics Industry Revenue (Million) Forecast, by Application 2019 & 2032
- Table 28: Spain Open Angle Glaucoma Therapeutics Industry Volume (K Unit) Forecast, by Application 2019 & 2032
- Table 29: Rest of Europe Open Angle Glaucoma Therapeutics Industry Revenue (Million) Forecast, by Application 2019 & 2032
- Table 30: Rest of Europe Open Angle Glaucoma Therapeutics Industry Volume (K Unit) Forecast, by Application 2019 & 2032
- Table 31: Global Open Angle Glaucoma Therapeutics Industry Revenue Million Forecast, by Country 2019 & 2032
- Table 32: Global Open Angle Glaucoma Therapeutics Industry Volume K Unit Forecast, by Country 2019 & 2032
- Table 33: China Open Angle Glaucoma Therapeutics Industry Revenue (Million) Forecast, by Application 2019 & 2032
- Table 34: China Open Angle Glaucoma Therapeutics Industry Volume (K Unit) Forecast, by Application 2019 & 2032
- Table 35: Japan Open Angle Glaucoma Therapeutics Industry Revenue (Million) Forecast, by Application 2019 & 2032
- Table 36: Japan Open Angle Glaucoma Therapeutics Industry Volume (K Unit) Forecast, by Application 2019 & 2032
- Table 37: India Open Angle Glaucoma Therapeutics Industry Revenue (Million) Forecast, by Application 2019 & 2032
- Table 38: India Open Angle Glaucoma Therapeutics Industry Volume (K Unit) Forecast, by Application 2019 & 2032
- Table 39: Australia Open Angle Glaucoma Therapeutics Industry Revenue (Million) Forecast, by Application 2019 & 2032
- Table 40: Australia Open Angle Glaucoma Therapeutics Industry Volume (K Unit) Forecast, by Application 2019 & 2032
- Table 41: South Korea Open Angle Glaucoma Therapeutics Industry Revenue (Million) Forecast, by Application 2019 & 2032
- Table 42: South Korea Open Angle Glaucoma Therapeutics Industry Volume (K Unit) Forecast, by Application 2019 & 2032
- Table 43: Rest of Asia Pacific Open Angle Glaucoma Therapeutics Industry Revenue (Million) Forecast, by Application 2019 & 2032
- Table 44: Rest of Asia Pacific Open Angle Glaucoma Therapeutics Industry Volume (K Unit) Forecast, by Application 2019 & 2032
- Table 45: Global Open Angle Glaucoma Therapeutics Industry Revenue Million Forecast, by Country 2019 & 2032
- Table 46: Global Open Angle Glaucoma Therapeutics Industry Volume K Unit Forecast, by Country 2019 & 2032
- Table 47: GCC Open Angle Glaucoma Therapeutics Industry Revenue (Million) Forecast, by Application 2019 & 2032
- Table 48: GCC Open Angle Glaucoma Therapeutics Industry Volume (K Unit) Forecast, by Application 2019 & 2032
- Table 49: South Africa Open Angle Glaucoma Therapeutics Industry Revenue (Million) Forecast, by Application 2019 & 2032
- Table 50: South Africa Open Angle Glaucoma Therapeutics Industry Volume (K Unit) Forecast, by Application 2019 & 2032
- Table 51: Rest of Middle East and Africa Open Angle Glaucoma Therapeutics Industry Revenue (Million) Forecast, by Application 2019 & 2032
- Table 52: Rest of Middle East and Africa Open Angle Glaucoma Therapeutics Industry Volume (K Unit) Forecast, by Application 2019 & 2032
- Table 53: Global Open Angle Glaucoma Therapeutics Industry Revenue Million Forecast, by Country 2019 & 2032
- Table 54: Global Open Angle Glaucoma Therapeutics Industry Volume K Unit Forecast, by Country 2019 & 2032
- Table 55: Brazil Open Angle Glaucoma Therapeutics Industry Revenue (Million) Forecast, by Application 2019 & 2032
- Table 56: Brazil Open Angle Glaucoma Therapeutics Industry Volume (K Unit) Forecast, by Application 2019 & 2032
- Table 57: Argentina Open Angle Glaucoma Therapeutics Industry Revenue (Million) Forecast, by Application 2019 & 2032
- Table 58: Argentina Open Angle Glaucoma Therapeutics Industry Volume (K Unit) Forecast, by Application 2019 & 2032
- Table 59: Rest of South America Open Angle Glaucoma Therapeutics Industry Revenue (Million) Forecast, by Application 2019 & 2032
- Table 60: Rest of South America Open Angle Glaucoma Therapeutics Industry Volume (K Unit) Forecast, by Application 2019 & 2032
- Table 61: Global Open Angle Glaucoma Therapeutics Industry Revenue Million Forecast, by Indication 2019 & 2032
- Table 62: Global Open Angle Glaucoma Therapeutics Industry Volume K Unit Forecast, by Indication 2019 & 2032
- Table 63: Global Open Angle Glaucoma Therapeutics Industry Revenue Million Forecast, by Drug Class 2019 & 2032
- Table 64: Global Open Angle Glaucoma Therapeutics Industry Volume K Unit Forecast, by Drug Class 2019 & 2032
- Table 65: Global Open Angle Glaucoma Therapeutics Industry Revenue Million Forecast, by Country 2019 & 2032
- Table 66: Global Open Angle Glaucoma Therapeutics Industry Volume K Unit Forecast, by Country 2019 & 2032
- Table 67: United States Open Angle Glaucoma Therapeutics Industry Revenue (Million) Forecast, by Application 2019 & 2032
- Table 68: United States Open Angle Glaucoma Therapeutics Industry Volume (K Unit) Forecast, by Application 2019 & 2032
- Table 69: Canada Open Angle Glaucoma Therapeutics Industry Revenue (Million) Forecast, by Application 2019 & 2032
- Table 70: Canada Open Angle Glaucoma Therapeutics Industry Volume (K Unit) Forecast, by Application 2019 & 2032
- Table 71: Mexico Open Angle Glaucoma Therapeutics Industry Revenue (Million) Forecast, by Application 2019 & 2032
- Table 72: Mexico Open Angle Glaucoma Therapeutics Industry Volume (K Unit) Forecast, by Application 2019 & 2032
- Table 73: Global Open Angle Glaucoma Therapeutics Industry Revenue Million Forecast, by Indication 2019 & 2032
- Table 74: Global Open Angle Glaucoma Therapeutics Industry Volume K Unit Forecast, by Indication 2019 & 2032
- Table 75: Global Open Angle Glaucoma Therapeutics Industry Revenue Million Forecast, by Drug Class 2019 & 2032
- Table 76: Global Open Angle Glaucoma Therapeutics Industry Volume K Unit Forecast, by Drug Class 2019 & 2032
- Table 77: Global Open Angle Glaucoma Therapeutics Industry Revenue Million Forecast, by Country 2019 & 2032
- Table 78: Global Open Angle Glaucoma Therapeutics Industry Volume K Unit Forecast, by Country 2019 & 2032
- Table 79: Germany Open Angle Glaucoma Therapeutics Industry Revenue (Million) Forecast, by Application 2019 & 2032
- Table 80: Germany Open Angle Glaucoma Therapeutics Industry Volume (K Unit) Forecast, by Application 2019 & 2032
- Table 81: United Kingdom Open Angle Glaucoma Therapeutics Industry Revenue (Million) Forecast, by Application 2019 & 2032
- Table 82: United Kingdom Open Angle Glaucoma Therapeutics Industry Volume (K Unit) Forecast, by Application 2019 & 2032
- Table 83: France Open Angle Glaucoma Therapeutics Industry Revenue (Million) Forecast, by Application 2019 & 2032
- Table 84: France Open Angle Glaucoma Therapeutics Industry Volume (K Unit) Forecast, by Application 2019 & 2032
- Table 85: Italy Open Angle Glaucoma Therapeutics Industry Revenue (Million) Forecast, by Application 2019 & 2032
- Table 86: Italy Open Angle Glaucoma Therapeutics Industry Volume (K Unit) Forecast, by Application 2019 & 2032
- Table 87: Spain Open Angle Glaucoma Therapeutics Industry Revenue (Million) Forecast, by Application 2019 & 2032
- Table 88: Spain Open Angle Glaucoma Therapeutics Industry Volume (K Unit) Forecast, by Application 2019 & 2032
- Table 89: Rest of Europe Open Angle Glaucoma Therapeutics Industry Revenue (Million) Forecast, by Application 2019 & 2032
- Table 90: Rest of Europe Open Angle Glaucoma Therapeutics Industry Volume (K Unit) Forecast, by Application 2019 & 2032
- Table 91: Global Open Angle Glaucoma Therapeutics Industry Revenue Million Forecast, by Indication 2019 & 2032
- Table 92: Global Open Angle Glaucoma Therapeutics Industry Volume K Unit Forecast, by Indication 2019 & 2032
- Table 93: Global Open Angle Glaucoma Therapeutics Industry Revenue Million Forecast, by Drug Class 2019 & 2032
- Table 94: Global Open Angle Glaucoma Therapeutics Industry Volume K Unit Forecast, by Drug Class 2019 & 2032
- Table 95: Global Open Angle Glaucoma Therapeutics Industry Revenue Million Forecast, by Country 2019 & 2032
- Table 96: Global Open Angle Glaucoma Therapeutics Industry Volume K Unit Forecast, by Country 2019 & 2032
- Table 97: China Open Angle Glaucoma Therapeutics Industry Revenue (Million) Forecast, by Application 2019 & 2032
- Table 98: China Open Angle Glaucoma Therapeutics Industry Volume (K Unit) Forecast, by Application 2019 & 2032
- Table 99: Japan Open Angle Glaucoma Therapeutics Industry Revenue (Million) Forecast, by Application 2019 & 2032
- Table 100: Japan Open Angle Glaucoma Therapeutics Industry Volume (K Unit) Forecast, by Application 2019 & 2032
- Table 101: India Open Angle Glaucoma Therapeutics Industry Revenue (Million) Forecast, by Application 2019 & 2032
- Table 102: India Open Angle Glaucoma Therapeutics Industry Volume (K Unit) Forecast, by Application 2019 & 2032
- Table 103: Australia Open Angle Glaucoma Therapeutics Industry Revenue (Million) Forecast, by Application 2019 & 2032
- Table 104: Australia Open Angle Glaucoma Therapeutics Industry Volume (K Unit) Forecast, by Application 2019 & 2032
- Table 105: South Korea Open Angle Glaucoma Therapeutics Industry Revenue (Million) Forecast, by Application 2019 & 2032
- Table 106: South Korea Open Angle Glaucoma Therapeutics Industry Volume (K Unit) Forecast, by Application 2019 & 2032
- Table 107: Rest of Asia Pacific Open Angle Glaucoma Therapeutics Industry Revenue (Million) Forecast, by Application 2019 & 2032
- Table 108: Rest of Asia Pacific Open Angle Glaucoma Therapeutics Industry Volume (K Unit) Forecast, by Application 2019 & 2032
- Table 109: Global Open Angle Glaucoma Therapeutics Industry Revenue Million Forecast, by Indication 2019 & 2032
- Table 110: Global Open Angle Glaucoma Therapeutics Industry Volume K Unit Forecast, by Indication 2019 & 2032
- Table 111: Global Open Angle Glaucoma Therapeutics Industry Revenue Million Forecast, by Drug Class 2019 & 2032
- Table 112: Global Open Angle Glaucoma Therapeutics Industry Volume K Unit Forecast, by Drug Class 2019 & 2032
- Table 113: Global Open Angle Glaucoma Therapeutics Industry Revenue Million Forecast, by Country 2019 & 2032
- Table 114: Global Open Angle Glaucoma Therapeutics Industry Volume K Unit Forecast, by Country 2019 & 2032
- Table 115: GCC Open Angle Glaucoma Therapeutics Industry Revenue (Million) Forecast, by Application 2019 & 2032
- Table 116: GCC Open Angle Glaucoma Therapeutics Industry Volume (K Unit) Forecast, by Application 2019 & 2032
- Table 117: South Africa Open Angle Glaucoma Therapeutics Industry Revenue (Million) Forecast, by Application 2019 & 2032
- Table 118: South Africa Open Angle Glaucoma Therapeutics Industry Volume (K Unit) Forecast, by Application 2019 & 2032
- Table 119: Rest of Middle East and Africa Open Angle Glaucoma Therapeutics Industry Revenue (Million) Forecast, by Application 2019 & 2032
- Table 120: Rest of Middle East and Africa Open Angle Glaucoma Therapeutics Industry Volume (K Unit) Forecast, by Application 2019 & 2032
- Table 121: Global Open Angle Glaucoma Therapeutics Industry Revenue Million Forecast, by Indication 2019 & 2032
- Table 122: Global Open Angle Glaucoma Therapeutics Industry Volume K Unit Forecast, by Indication 2019 & 2032
- Table 123: Global Open Angle Glaucoma Therapeutics Industry Revenue Million Forecast, by Drug Class 2019 & 2032
- Table 124: Global Open Angle Glaucoma Therapeutics Industry Volume K Unit Forecast, by Drug Class 2019 & 2032
- Table 125: Global Open Angle Glaucoma Therapeutics Industry Revenue Million Forecast, by Country 2019 & 2032
- Table 126: Global Open Angle Glaucoma Therapeutics Industry Volume K Unit Forecast, by Country 2019 & 2032
- Table 127: Brazil Open Angle Glaucoma Therapeutics Industry Revenue (Million) Forecast, by Application 2019 & 2032
- Table 128: Brazil Open Angle Glaucoma Therapeutics Industry Volume (K Unit) Forecast, by Application 2019 & 2032
- Table 129: Argentina Open Angle Glaucoma Therapeutics Industry Revenue (Million) Forecast, by Application 2019 & 2032
- Table 130: Argentina Open Angle Glaucoma Therapeutics Industry Volume (K Unit) Forecast, by Application 2019 & 2032
- Table 131: Rest of South America Open Angle Glaucoma Therapeutics Industry Revenue (Million) Forecast, by Application 2019 & 2032
- Table 132: Rest of South America Open Angle Glaucoma Therapeutics Industry Volume (K Unit) Forecast, by Application 2019 & 2032
Frequently Asked Questions
1. What is the projected Compound Annual Growth Rate (CAGR) of the Open Angle Glaucoma Therapeutics Industry?
The projected CAGR is approximately 4.60%.
2. Which companies are prominent players in the Open Angle Glaucoma Therapeutics Industry?
Key companies in the market include Akorn Incorporated, Novartis AG, Merck & Co Inc, Inotek Pharmaceuticals, Santen Pharmaceutical Co Ltd , Bausch Health (Bausch & Lomb Incorporated), Aerie Pharmaceuticals Inc, Pfizer Inc, Abbvie Inc (Allergan Plc).
3. What are the main segments of the Open Angle Glaucoma Therapeutics Industry?
The market segments include Indication, Drug Class.
4. Can you provide details about the market size?
The market size is estimated to be USD XX Million as of 2022.
5. What are some drivers contributing to market growth?
; Increasing Prevalence of Glaucoma; Rising Initiatives to Increase Awareness about the Glaucoma; Technological Advancements in the Field of Ophthalmology.
6. What are the notable trends driving market growth?
Prostaglandin Analogs is the Segment by Drug Class that is Expected to Witness Fastest Growth Over the Forecast Period.
7. Are there any restraints impacting market growth?
; Side Effects associated with the Products; Stringent Approval Process.
8. Can you provide examples of recent developments in the market?
N/A
9. What pricing options are available for accessing the report?
Pricing options include single-user, multi-user, and enterprise licenses priced at USD 4750, USD 5250, and USD 8750 respectively.
10. Is the market size provided in terms of value or volume?
The market size is provided in terms of value, measured in Million and volume, measured in K Unit.
11. Are there any specific market keywords associated with the report?
Yes, the market keyword associated with the report is "Open Angle Glaucoma Therapeutics Industry," which aids in identifying and referencing the specific market segment covered.
12. How do I determine which pricing option suits my needs best?
The pricing options vary based on user requirements and access needs. Individual users may opt for single-user licenses, while businesses requiring broader access may choose multi-user or enterprise licenses for cost-effective access to the report.
13. Are there any additional resources or data provided in the Open Angle Glaucoma Therapeutics Industry report?
While the report offers comprehensive insights, it's advisable to review the specific contents or supplementary materials provided to ascertain if additional resources or data are available.
14. How can I stay updated on further developments or reports in the Open Angle Glaucoma Therapeutics Industry?
To stay informed about further developments, trends, and reports in the Open Angle Glaucoma Therapeutics Industry, consider subscribing to industry newsletters, following relevant companies and organizations, or regularly checking reputable industry news sources and publications.
Methodology
Step 1 - Identification of Relevant Samples Size from Population Database


Step 2 - Approaches for Defining Global Market Size (Value, Volume* & Price*)

Note*: In applicable scenarios
Step 3 - Data Sources
Primary Research
- Web Analytics
- Survey Reports
- Research Institute
- Latest Research Reports
- Opinion Leaders
Secondary Research
- Annual Reports
- White Paper
- Latest Press Release
- Industry Association
- Paid Database
- Investor Presentations

Step 4 - Data Triangulation
Involves using different sources of information in order to increase the validity of a study
These sources are likely to be stakeholders in a program - participants, other researchers, program staff, other community members, and so on.
Then we put all data in single framework & apply various statistical tools to find out the dynamic on the market.
During the analysis stage, feedback from the stakeholder groups would be compared to determine areas of agreement as well as areas of divergence


