
Key Insights
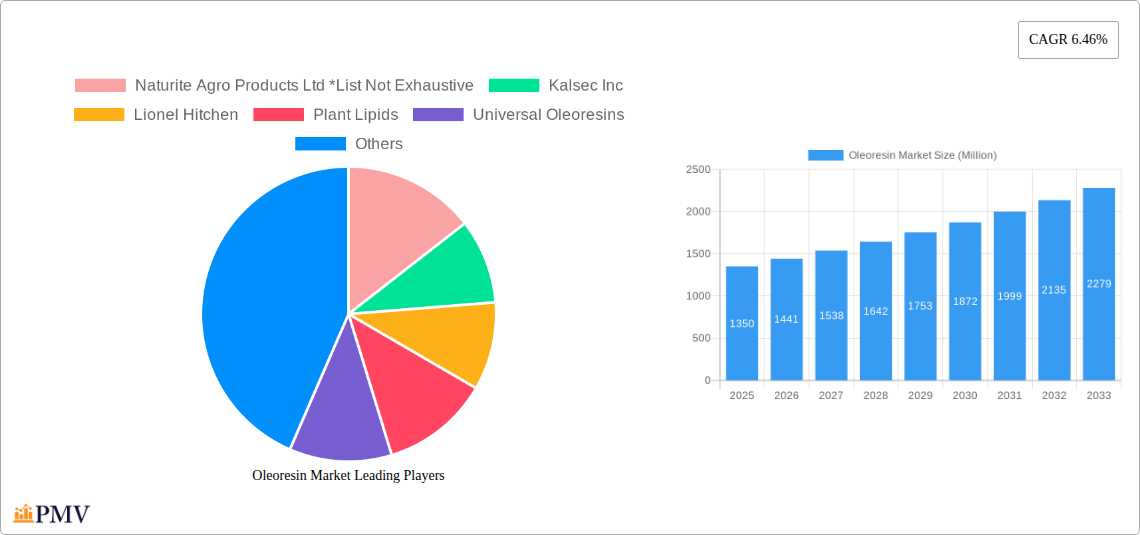
The global oleoresin market, valued at $1,350 million in 2025, is projected to experience robust growth, driven by increasing demand from the food and beverage industry, particularly in processed foods and flavor enhancements. The rising popularity of natural and clean-label ingredients is further fueling market expansion. Paprika, black pepper, and turmeric oleoresins dominate the product type segment, reflecting their widespread culinary and industrial applications. Growth is also expected from the cosmetics and personal care sectors, leveraging the natural color and antioxidant properties of oleoresins. Geographical expansion is another key driver, with Asia Pacific showing significant potential due to increasing consumer spending and the burgeoning food processing industry in countries like India and China. While fluctuating raw material prices and potential supply chain disruptions present challenges, the market’s overall growth trajectory remains positive, supported by continuous innovation in extraction techniques and the development of novel applications in pharmaceuticals and other specialized sectors.
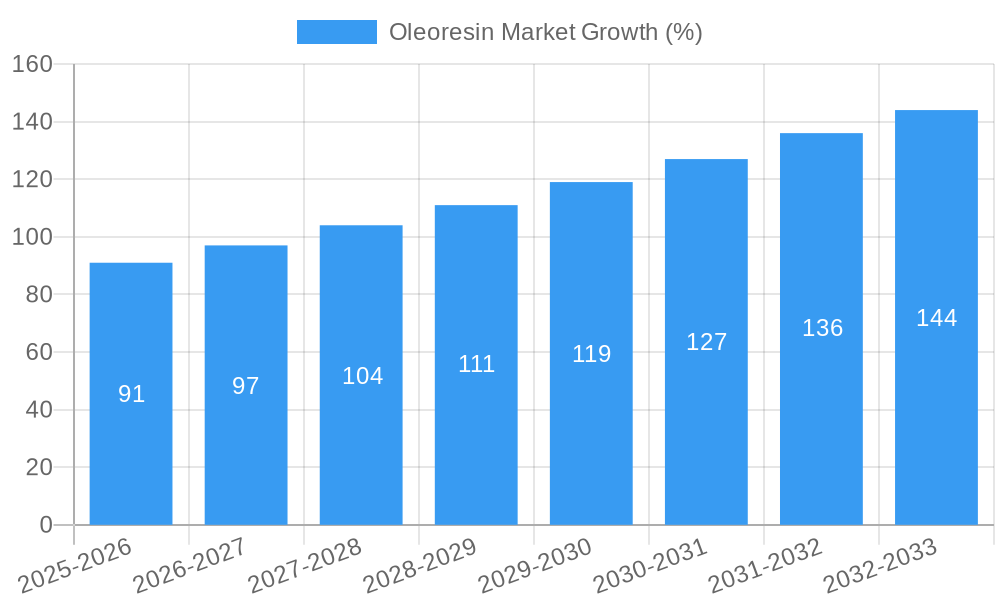
The forecast period (2025-2033) anticipates a steady CAGR of 6.46%, indicating a substantial market expansion. This growth will be shaped by several factors, including the increasing adoption of oleoresins as natural colorants and flavoring agents in various industries. The market segmentation by application highlights the diverse opportunities available, with food and beverage remaining the primary driver. However, significant growth is also projected in the cosmetics and personal care sectors, driven by the demand for natural and sustainable ingredients. Competitive dynamics are characterized by a mix of established global players and regional manufacturers. Strategic partnerships, acquisitions, and innovations in extraction and processing technologies are expected to reshape the competitive landscape in the coming years. Sustained research and development efforts focused on improving oleoresin quality and expanding applications will further contribute to market growth.
Oleoresin Market: A Comprehensive Report (2019-2033)
This comprehensive report provides an in-depth analysis of the global oleoresin market, encompassing historical data (2019-2024), current estimations (2025), and future projections (2025-2033). It delves into market segmentation, competitive dynamics, key growth drivers, and emerging trends, offering valuable insights for businesses operating within this dynamic sector. The report utilizes a robust methodology to provide actionable intelligence for informed strategic decision-making. The global oleoresin market is projected to reach xx Million by 2033, exhibiting a CAGR of xx% during the forecast period.
Oleoresin Market Structure & Competitive Dynamics
This section analyzes the competitive landscape of the oleoresin market, considering market concentration, innovation ecosystems, regulatory frameworks, product substitutes, end-user trends, and M&A activities. The market is characterized by a mix of large multinational corporations and smaller specialized players. Market share is currently dominated by a few key players, with Kalsec Inc., Mane Group, and Oterra A/s (akay Group Ltd) holding significant positions. However, smaller players are actively innovating to gain market share.
- Market Concentration: The market exhibits a moderately concentrated structure, with the top five players accounting for approximately xx% of the global market share in 2024.
- Innovation Ecosystems: Companies are heavily investing in R&D to develop novel oleoresin extraction methods and applications. This is driven by the growing demand for natural and sustainable ingredients.
- Regulatory Frameworks: Stringent regulations regarding food safety and labeling are impacting market dynamics, necessitating compliance and transparency.
- Product Substitutes: Synthetic colorings and flavorings pose a competitive threat to natural oleoresins, yet the increasing preference for natural ingredients is bolstering the market's growth.
- End-User Trends: Growing demand from the food and beverage industry, particularly in processed foods and beverages, is a significant driver for market growth.
- M&A Activities: The past five years have witnessed several strategic mergers and acquisitions, valued at an estimated xx Million, indicating consolidation within the industry. These transactions aim to expand product portfolios and geographical reach.
Oleoresin Market Industry Trends & Insights
The global oleoresin market is experiencing significant growth, driven by increasing consumer demand for natural and clean-label products, particularly in the food and beverage sector. The market exhibits a rising preference for sustainable and ethically sourced ingredients, influencing supply chain dynamics. Technological advancements in extraction and processing methods are also contributing to market expansion. The shift towards health-conscious lifestyles and the growing popularity of ethnic cuisines are key factors propelling market growth. The incorporation of oleoresins in cosmetics and pharmaceuticals further broadens the market's application landscape. The CAGR for the period 2025-2033 is estimated at xx%, indicating substantial growth potential. Market penetration is particularly strong in developed regions, but developing economies are showing robust growth rates.
Dominant Markets & Segments in Oleoresin Market
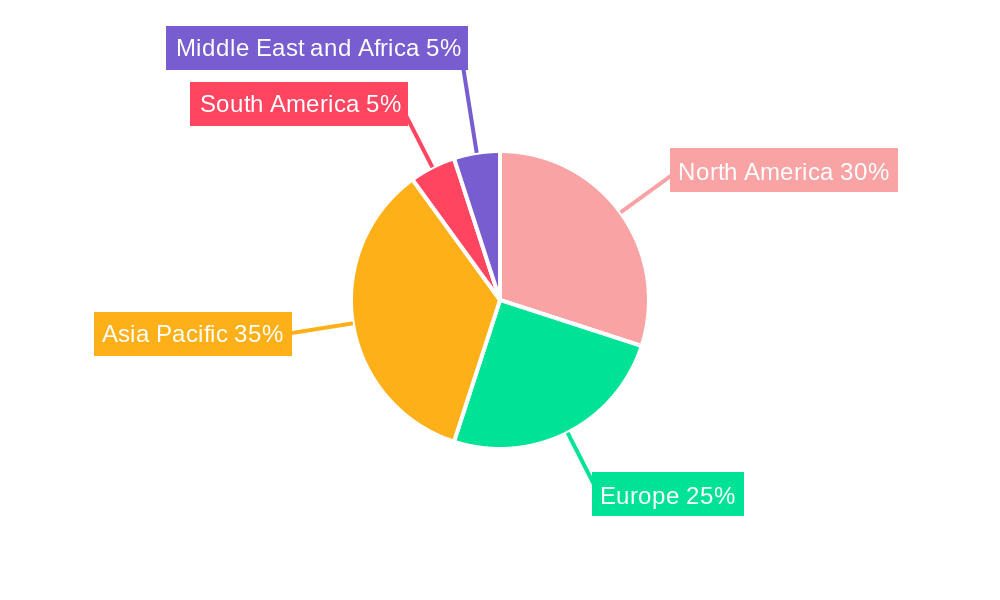
The food and beverage industry is the leading application segment for oleoresins, with paprika and capsaicin being the most dominant types. The Asia-Pacific region is currently the leading market for oleoresins, driven by rising consumption of processed foods and beverages, along with a growing population.
Dominant Segments:
- By Type: Paprika, Capsicum, and Turmeric are the leading segments, exhibiting significant growth due to their extensive applications in food, beverages, and cosmetics.
- By Application: The food and beverage industry dominates, followed by cosmetics and personal care products. Pharmaceuticals account for a smaller but growing segment.
Key Drivers by Region:
- Asia-Pacific: Rapid economic growth, rising disposable incomes, and increasing urbanization are driving demand.
- North America: Growing demand for natural and organic food products fuels market expansion.
- Europe: Stringent regulations on food additives are creating opportunities for natural oleoresin products.
Oleoresin Market Product Innovations
Recent innovations include advancements in extraction techniques to enhance the quality and yield of oleoresins, and the development of new formulations for specific applications. Companies are focusing on creating customized oleoresin blends to meet specific customer requirements. These advancements are improving the cost-effectiveness and efficiency of oleoresin production and creating opportunities in new applications such as functional foods and nutraceuticals.
Report Segmentation & Scope
This report segments the oleoresin market by type (Paprika, Black Pepper, Turmeric, Capsicum, Ginger, Other Product Types) and by application (Food and Beverage, Cosmetics and Personal Care, Pharmaceuticals, Other Applications). Each segment's growth projections, market size (in Millions), and competitive dynamics are analyzed, offering a granular understanding of the market. The "Other Product Types" segment encompasses a variety of oleoresins from different spices and herbs. Similarly, the "Other Applications" segment includes diverse uses such as animal feed and industrial applications.
Key Drivers of Oleoresin Market Growth
Several key factors contribute to the oleoresin market's growth. The increasing demand for natural food colors and flavors is a major driver, fueled by consumer preference for clean-label products. Technological advancements in extraction and processing are enhancing product quality and efficiency. Furthermore, the expansion of the food and beverage industry, especially in developing economies, presents significant growth opportunities. The growing adoption of oleoresins in cosmetics and pharmaceuticals also contributes to market expansion.
Challenges in the Oleoresin Market Sector
The oleoresin market faces certain challenges, including price volatility of raw materials, fluctuations in agricultural yields, and stringent regulatory compliance requirements. Supply chain disruptions and competition from synthetic alternatives can also impact market dynamics. Furthermore, maintaining the quality and consistency of oleoresins produced from natural sources can be a challenge. These factors can influence profitability and market stability.
Leading Players in the Oleoresin Market Market
- Naturite Agro Products Ltd
- Kalsec Inc
- Lionel Hitchen
- Plant Lipids
- Universal Oleoresins
- Synthite Industries Ltd
- Silverline Chemicals Ltd
- Ozone Naturals
- Oterra A/s (akay Group Ltd)
- Mane Group
Key Developments in Oleoresin Market Sector
- November 2023: KALSEC Inc. expanded its footprint on the European continent by opening its Innovation Centre of Excellence in Wageningen, Netherlands.
- December 2023: KALSEC Inc. opened a new Finishing and Distribution Centre in Singapore to better serve food and beverage brands and manufacturers.
- February 2024: Lionel Hitchen launched FutureFlavours, a metaverse- and AI-inspired platform to engage younger consumers.
Strategic Oleoresin Market Outlook
The future of the oleoresin market looks promising, driven by increasing consumer demand for natural ingredients, continued innovation in extraction and processing techniques, and the expansion of applications across various sectors. Strategic opportunities exist for companies to invest in sustainable sourcing, product diversification, and technological advancements to gain a competitive edge. Focusing on emerging markets and addressing regulatory challenges will be crucial for future success.
Oleoresin Market Segmentation
-
1. Type
- 1.1. Paprika
- 1.2. Black Pepper
- 1.3. Turmeric
- 1.4. Capsicum
- 1.5. Ginger
- 1.6. Other Product Types
-
2. Application
-
2.1. Food and Beverage
- 2.1.1. Bakery Goods
- 2.1.2. Spices and Condiments
- 2.1.3. Meat and Seafood Products
- 2.1.4. Other Food and Beverages
- 2.2. Cosmetics and Personal Care
- 2.3. Pharmaceuticals
- 2.4. Other Applications
-
2.1. Food and Beverage
Oleoresin Market Segmentation By Geography
-
1. North America
- 1.1. United States
- 1.2. Canada
- 1.3. Mexico
- 1.4. Rest of North America
-
2. Europe
- 2.1. Spain
- 2.2. United Kingdom
- 2.3. France
- 2.4. Germany
- 2.5. Russia
- 2.6. Italy
- 2.7. Rest of Europe
-
3. Asia Pacific
- 3.1. China
- 3.2. Japan
- 3.3. India
- 3.4. Australia
- 3.5. Rest of Asia Pacific
-
4. South America
- 4.1. Brazil
- 4.2. Argentina
- 4.3. Rest of South America
-
5. Middle East and Africa
- 5.1. South Africa
- 5.2. Saudi Arabia
- 5.3. Rest of Middle East
Oleoresin Market REPORT HIGHLIGHTS
| Aspects | Details |
|---|---|
| Study Period | 2019-2033 |
| Base Year | 2024 |
| Estimated Year | 2025 |
| Forecast Period | 2025-2033 |
| Historical Period | 2019-2024 |
| Growth Rate | CAGR of 6.46% from 2019-2033 |
| Segmentation |
|
Table of Contents
- 1. Introduction
- 1.1. Research Scope
- 1.2. Market Segmentation
- 1.3. Research Methodology
- 1.4. Definitions and Assumptions
- 2. Executive Summary
- 2.1. Introduction
- 3. Market Dynamics
- 3.1. Introduction
- 3.2. Market Drivers
- 3.2.1. Awareness Of Health Benefits Of Oleoresins; Rise Of Clean Label Products
- 3.3. Market Restrains
- 3.3.1. Supply Chain Volatility and Availability Of Other Flavor Ingredients
- 3.4. Market Trends
- 3.4.1. Awareness Of Health Benefits Of Oleoresins
- 4. Market Factor Analysis
- 4.1. Porters Five Forces
- 4.2. Supply/Value Chain
- 4.3. PESTEL analysis
- 4.4. Market Entropy
- 4.5. Patent/Trademark Analysis
- 5. Global Oleoresin Market Analysis, Insights and Forecast, 2019-2031
- 5.1. Market Analysis, Insights and Forecast - by Type
- 5.1.1. Paprika
- 5.1.2. Black Pepper
- 5.1.3. Turmeric
- 5.1.4. Capsicum
- 5.1.5. Ginger
- 5.1.6. Other Product Types
- 5.2. Market Analysis, Insights and Forecast - by Application
- 5.2.1. Food and Beverage
- 5.2.1.1. Bakery Goods
- 5.2.1.2. Spices and Condiments
- 5.2.1.3. Meat and Seafood Products
- 5.2.1.4. Other Food and Beverages
- 5.2.2. Cosmetics and Personal Care
- 5.2.3. Pharmaceuticals
- 5.2.4. Other Applications
- 5.2.1. Food and Beverage
- 5.3. Market Analysis, Insights and Forecast - by Region
- 5.3.1. North America
- 5.3.2. Europe
- 5.3.3. Asia Pacific
- 5.3.4. South America
- 5.3.5. Middle East and Africa
- 5.1. Market Analysis, Insights and Forecast - by Type
- 6. North America Oleoresin Market Analysis, Insights and Forecast, 2019-2031
- 6.1. Market Analysis, Insights and Forecast - by Type
- 6.1.1. Paprika
- 6.1.2. Black Pepper
- 6.1.3. Turmeric
- 6.1.4. Capsicum
- 6.1.5. Ginger
- 6.1.6. Other Product Types
- 6.2. Market Analysis, Insights and Forecast - by Application
- 6.2.1. Food and Beverage
- 6.2.1.1. Bakery Goods
- 6.2.1.2. Spices and Condiments
- 6.2.1.3. Meat and Seafood Products
- 6.2.1.4. Other Food and Beverages
- 6.2.2. Cosmetics and Personal Care
- 6.2.3. Pharmaceuticals
- 6.2.4. Other Applications
- 6.2.1. Food and Beverage
- 6.1. Market Analysis, Insights and Forecast - by Type
- 7. Europe Oleoresin Market Analysis, Insights and Forecast, 2019-2031
- 7.1. Market Analysis, Insights and Forecast - by Type
- 7.1.1. Paprika
- 7.1.2. Black Pepper
- 7.1.3. Turmeric
- 7.1.4. Capsicum
- 7.1.5. Ginger
- 7.1.6. Other Product Types
- 7.2. Market Analysis, Insights and Forecast - by Application
- 7.2.1. Food and Beverage
- 7.2.1.1. Bakery Goods
- 7.2.1.2. Spices and Condiments
- 7.2.1.3. Meat and Seafood Products
- 7.2.1.4. Other Food and Beverages
- 7.2.2. Cosmetics and Personal Care
- 7.2.3. Pharmaceuticals
- 7.2.4. Other Applications
- 7.2.1. Food and Beverage
- 7.1. Market Analysis, Insights and Forecast - by Type
- 8. Asia Pacific Oleoresin Market Analysis, Insights and Forecast, 2019-2031
- 8.1. Market Analysis, Insights and Forecast - by Type
- 8.1.1. Paprika
- 8.1.2. Black Pepper
- 8.1.3. Turmeric
- 8.1.4. Capsicum
- 8.1.5. Ginger
- 8.1.6. Other Product Types
- 8.2. Market Analysis, Insights and Forecast - by Application
- 8.2.1. Food and Beverage
- 8.2.1.1. Bakery Goods
- 8.2.1.2. Spices and Condiments
- 8.2.1.3. Meat and Seafood Products
- 8.2.1.4. Other Food and Beverages
- 8.2.2. Cosmetics and Personal Care
- 8.2.3. Pharmaceuticals
- 8.2.4. Other Applications
- 8.2.1. Food and Beverage
- 8.1. Market Analysis, Insights and Forecast - by Type
- 9. South America Oleoresin Market Analysis, Insights and Forecast, 2019-2031
- 9.1. Market Analysis, Insights and Forecast - by Type
- 9.1.1. Paprika
- 9.1.2. Black Pepper
- 9.1.3. Turmeric
- 9.1.4. Capsicum
- 9.1.5. Ginger
- 9.1.6. Other Product Types
- 9.2. Market Analysis, Insights and Forecast - by Application
- 9.2.1. Food and Beverage
- 9.2.1.1. Bakery Goods
- 9.2.1.2. Spices and Condiments
- 9.2.1.3. Meat and Seafood Products
- 9.2.1.4. Other Food and Beverages
- 9.2.2. Cosmetics and Personal Care
- 9.2.3. Pharmaceuticals
- 9.2.4. Other Applications
- 9.2.1. Food and Beverage
- 9.1. Market Analysis, Insights and Forecast - by Type
- 10. Middle East and Africa Oleoresin Market Analysis, Insights and Forecast, 2019-2031
- 10.1. Market Analysis, Insights and Forecast - by Type
- 10.1.1. Paprika
- 10.1.2. Black Pepper
- 10.1.3. Turmeric
- 10.1.4. Capsicum
- 10.1.5. Ginger
- 10.1.6. Other Product Types
- 10.2. Market Analysis, Insights and Forecast - by Application
- 10.2.1. Food and Beverage
- 10.2.1.1. Bakery Goods
- 10.2.1.2. Spices and Condiments
- 10.2.1.3. Meat and Seafood Products
- 10.2.1.4. Other Food and Beverages
- 10.2.2. Cosmetics and Personal Care
- 10.2.3. Pharmaceuticals
- 10.2.4. Other Applications
- 10.2.1. Food and Beverage
- 10.1. Market Analysis, Insights and Forecast - by Type
- 11. North America Oleoresin Market Analysis, Insights and Forecast, 2019-2031
- 11.1. Market Analysis, Insights and Forecast - By Country/Sub-region
- 11.1.1 United States
- 11.1.2 Canada
- 11.1.3 Mexico
- 11.1.4 Rest of North America
- 12. Europe Oleoresin Market Analysis, Insights and Forecast, 2019-2031
- 12.1. Market Analysis, Insights and Forecast - By Country/Sub-region
- 12.1.1 Spain
- 12.1.2 United Kingdom
- 12.1.3 France
- 12.1.4 Germany
- 12.1.5 Russia
- 12.1.6 Italy
- 12.1.7 Rest of Europe
- 13. Asia Pacific Oleoresin Market Analysis, Insights and Forecast, 2019-2031
- 13.1. Market Analysis, Insights and Forecast - By Country/Sub-region
- 13.1.1 China
- 13.1.2 Japan
- 13.1.3 India
- 13.1.4 Australia
- 13.1.5 Rest of Asia Pacific
- 14. South America Oleoresin Market Analysis, Insights and Forecast, 2019-2031
- 14.1. Market Analysis, Insights and Forecast - By Country/Sub-region
- 14.1.1 Brazil
- 14.1.2 Argentina
- 14.1.3 Rest of South America
- 15. Middle East and Africa Oleoresin Market Analysis, Insights and Forecast, 2019-2031
- 15.1. Market Analysis, Insights and Forecast - By Country/Sub-region
- 15.1.1 South Africa
- 15.1.2 Saudi Arabia
- 15.1.3 Rest of Middle East
- 16. Competitive Analysis
- 16.1. Global Market Share Analysis 2024
- 16.2. Company Profiles
- 16.2.1 Naturite Agro Products Ltd *List Not Exhaustive
- 16.2.1.1. Overview
- 16.2.1.2. Products
- 16.2.1.3. SWOT Analysis
- 16.2.1.4. Recent Developments
- 16.2.1.5. Financials (Based on Availability)
- 16.2.2 Kalsec Inc
- 16.2.2.1. Overview
- 16.2.2.2. Products
- 16.2.2.3. SWOT Analysis
- 16.2.2.4. Recent Developments
- 16.2.2.5. Financials (Based on Availability)
- 16.2.3 Lionel Hitchen
- 16.2.3.1. Overview
- 16.2.3.2. Products
- 16.2.3.3. SWOT Analysis
- 16.2.3.4. Recent Developments
- 16.2.3.5. Financials (Based on Availability)
- 16.2.4 Plant Lipids
- 16.2.4.1. Overview
- 16.2.4.2. Products
- 16.2.4.3. SWOT Analysis
- 16.2.4.4. Recent Developments
- 16.2.4.5. Financials (Based on Availability)
- 16.2.5 Universal Oleoresins
- 16.2.5.1. Overview
- 16.2.5.2. Products
- 16.2.5.3. SWOT Analysis
- 16.2.5.4. Recent Developments
- 16.2.5.5. Financials (Based on Availability)
- 16.2.6 Synthite Industries Ltd
- 16.2.6.1. Overview
- 16.2.6.2. Products
- 16.2.6.3. SWOT Analysis
- 16.2.6.4. Recent Developments
- 16.2.6.5. Financials (Based on Availability)
- 16.2.7 Silverline Chemicals Ltd
- 16.2.7.1. Overview
- 16.2.7.2. Products
- 16.2.7.3. SWOT Analysis
- 16.2.7.4. Recent Developments
- 16.2.7.5. Financials (Based on Availability)
- 16.2.8 Ozone Naturals
- 16.2.8.1. Overview
- 16.2.8.2. Products
- 16.2.8.3. SWOT Analysis
- 16.2.8.4. Recent Developments
- 16.2.8.5. Financials (Based on Availability)
- 16.2.9 Oterra A/s (akay Group Ltd)
- 16.2.9.1. Overview
- 16.2.9.2. Products
- 16.2.9.3. SWOT Analysis
- 16.2.9.4. Recent Developments
- 16.2.9.5. Financials (Based on Availability)
- 16.2.10 Mane Group
- 16.2.10.1. Overview
- 16.2.10.2. Products
- 16.2.10.3. SWOT Analysis
- 16.2.10.4. Recent Developments
- 16.2.10.5. Financials (Based on Availability)
- 16.2.1 Naturite Agro Products Ltd *List Not Exhaustive
List of Figures
- Figure 1: Global Oleoresin Market Revenue Breakdown (Million, %) by Region 2024 & 2032
- Figure 2: Global Oleoresin Market Volume Breakdown (K Tons, %) by Region 2024 & 2032
- Figure 3: North America Oleoresin Market Revenue (Million), by Country 2024 & 2032
- Figure 4: North America Oleoresin Market Volume (K Tons), by Country 2024 & 2032
- Figure 5: North America Oleoresin Market Revenue Share (%), by Country 2024 & 2032
- Figure 6: North America Oleoresin Market Volume Share (%), by Country 2024 & 2032
- Figure 7: Europe Oleoresin Market Revenue (Million), by Country 2024 & 2032
- Figure 8: Europe Oleoresin Market Volume (K Tons), by Country 2024 & 2032
- Figure 9: Europe Oleoresin Market Revenue Share (%), by Country 2024 & 2032
- Figure 10: Europe Oleoresin Market Volume Share (%), by Country 2024 & 2032
- Figure 11: Asia Pacific Oleoresin Market Revenue (Million), by Country 2024 & 2032
- Figure 12: Asia Pacific Oleoresin Market Volume (K Tons), by Country 2024 & 2032
- Figure 13: Asia Pacific Oleoresin Market Revenue Share (%), by Country 2024 & 2032
- Figure 14: Asia Pacific Oleoresin Market Volume Share (%), by Country 2024 & 2032
- Figure 15: South America Oleoresin Market Revenue (Million), by Country 2024 & 2032
- Figure 16: South America Oleoresin Market Volume (K Tons), by Country 2024 & 2032
- Figure 17: South America Oleoresin Market Revenue Share (%), by Country 2024 & 2032
- Figure 18: South America Oleoresin Market Volume Share (%), by Country 2024 & 2032
- Figure 19: Middle East and Africa Oleoresin Market Revenue (Million), by Country 2024 & 2032
- Figure 20: Middle East and Africa Oleoresin Market Volume (K Tons), by Country 2024 & 2032
- Figure 21: Middle East and Africa Oleoresin Market Revenue Share (%), by Country 2024 & 2032
- Figure 22: Middle East and Africa Oleoresin Market Volume Share (%), by Country 2024 & 2032
- Figure 23: North America Oleoresin Market Revenue (Million), by Type 2024 & 2032
- Figure 24: North America Oleoresin Market Volume (K Tons), by Type 2024 & 2032
- Figure 25: North America Oleoresin Market Revenue Share (%), by Type 2024 & 2032
- Figure 26: North America Oleoresin Market Volume Share (%), by Type 2024 & 2032
- Figure 27: North America Oleoresin Market Revenue (Million), by Application 2024 & 2032
- Figure 28: North America Oleoresin Market Volume (K Tons), by Application 2024 & 2032
- Figure 29: North America Oleoresin Market Revenue Share (%), by Application 2024 & 2032
- Figure 30: North America Oleoresin Market Volume Share (%), by Application 2024 & 2032
- Figure 31: North America Oleoresin Market Revenue (Million), by Country 2024 & 2032
- Figure 32: North America Oleoresin Market Volume (K Tons), by Country 2024 & 2032
- Figure 33: North America Oleoresin Market Revenue Share (%), by Country 2024 & 2032
- Figure 34: North America Oleoresin Market Volume Share (%), by Country 2024 & 2032
- Figure 35: Europe Oleoresin Market Revenue (Million), by Type 2024 & 2032
- Figure 36: Europe Oleoresin Market Volume (K Tons), by Type 2024 & 2032
- Figure 37: Europe Oleoresin Market Revenue Share (%), by Type 2024 & 2032
- Figure 38: Europe Oleoresin Market Volume Share (%), by Type 2024 & 2032
- Figure 39: Europe Oleoresin Market Revenue (Million), by Application 2024 & 2032
- Figure 40: Europe Oleoresin Market Volume (K Tons), by Application 2024 & 2032
- Figure 41: Europe Oleoresin Market Revenue Share (%), by Application 2024 & 2032
- Figure 42: Europe Oleoresin Market Volume Share (%), by Application 2024 & 2032
- Figure 43: Europe Oleoresin Market Revenue (Million), by Country 2024 & 2032
- Figure 44: Europe Oleoresin Market Volume (K Tons), by Country 2024 & 2032
- Figure 45: Europe Oleoresin Market Revenue Share (%), by Country 2024 & 2032
- Figure 46: Europe Oleoresin Market Volume Share (%), by Country 2024 & 2032
- Figure 47: Asia Pacific Oleoresin Market Revenue (Million), by Type 2024 & 2032
- Figure 48: Asia Pacific Oleoresin Market Volume (K Tons), by Type 2024 & 2032
- Figure 49: Asia Pacific Oleoresin Market Revenue Share (%), by Type 2024 & 2032
- Figure 50: Asia Pacific Oleoresin Market Volume Share (%), by Type 2024 & 2032
- Figure 51: Asia Pacific Oleoresin Market Revenue (Million), by Application 2024 & 2032
- Figure 52: Asia Pacific Oleoresin Market Volume (K Tons), by Application 2024 & 2032
- Figure 53: Asia Pacific Oleoresin Market Revenue Share (%), by Application 2024 & 2032
- Figure 54: Asia Pacific Oleoresin Market Volume Share (%), by Application 2024 & 2032
- Figure 55: Asia Pacific Oleoresin Market Revenue (Million), by Country 2024 & 2032
- Figure 56: Asia Pacific Oleoresin Market Volume (K Tons), by Country 2024 & 2032
- Figure 57: Asia Pacific Oleoresin Market Revenue Share (%), by Country 2024 & 2032
- Figure 58: Asia Pacific Oleoresin Market Volume Share (%), by Country 2024 & 2032
- Figure 59: South America Oleoresin Market Revenue (Million), by Type 2024 & 2032
- Figure 60: South America Oleoresin Market Volume (K Tons), by Type 2024 & 2032
- Figure 61: South America Oleoresin Market Revenue Share (%), by Type 2024 & 2032
- Figure 62: South America Oleoresin Market Volume Share (%), by Type 2024 & 2032
- Figure 63: South America Oleoresin Market Revenue (Million), by Application 2024 & 2032
- Figure 64: South America Oleoresin Market Volume (K Tons), by Application 2024 & 2032
- Figure 65: South America Oleoresin Market Revenue Share (%), by Application 2024 & 2032
- Figure 66: South America Oleoresin Market Volume Share (%), by Application 2024 & 2032
- Figure 67: South America Oleoresin Market Revenue (Million), by Country 2024 & 2032
- Figure 68: South America Oleoresin Market Volume (K Tons), by Country 2024 & 2032
- Figure 69: South America Oleoresin Market Revenue Share (%), by Country 2024 & 2032
- Figure 70: South America Oleoresin Market Volume Share (%), by Country 2024 & 2032
- Figure 71: Middle East and Africa Oleoresin Market Revenue (Million), by Type 2024 & 2032
- Figure 72: Middle East and Africa Oleoresin Market Volume (K Tons), by Type 2024 & 2032
- Figure 73: Middle East and Africa Oleoresin Market Revenue Share (%), by Type 2024 & 2032
- Figure 74: Middle East and Africa Oleoresin Market Volume Share (%), by Type 2024 & 2032
- Figure 75: Middle East and Africa Oleoresin Market Revenue (Million), by Application 2024 & 2032
- Figure 76: Middle East and Africa Oleoresin Market Volume (K Tons), by Application 2024 & 2032
- Figure 77: Middle East and Africa Oleoresin Market Revenue Share (%), by Application 2024 & 2032
- Figure 78: Middle East and Africa Oleoresin Market Volume Share (%), by Application 2024 & 2032
- Figure 79: Middle East and Africa Oleoresin Market Revenue (Million), by Country 2024 & 2032
- Figure 80: Middle East and Africa Oleoresin Market Volume (K Tons), by Country 2024 & 2032
- Figure 81: Middle East and Africa Oleoresin Market Revenue Share (%), by Country 2024 & 2032
- Figure 82: Middle East and Africa Oleoresin Market Volume Share (%), by Country 2024 & 2032
List of Tables
- Table 1: Global Oleoresin Market Revenue Million Forecast, by Region 2019 & 2032
- Table 2: Global Oleoresin Market Volume K Tons Forecast, by Region 2019 & 2032
- Table 3: Global Oleoresin Market Revenue Million Forecast, by Type 2019 & 2032
- Table 4: Global Oleoresin Market Volume K Tons Forecast, by Type 2019 & 2032
- Table 5: Global Oleoresin Market Revenue Million Forecast, by Application 2019 & 2032
- Table 6: Global Oleoresin Market Volume K Tons Forecast, by Application 2019 & 2032
- Table 7: Global Oleoresin Market Revenue Million Forecast, by Region 2019 & 2032
- Table 8: Global Oleoresin Market Volume K Tons Forecast, by Region 2019 & 2032
- Table 9: Global Oleoresin Market Revenue Million Forecast, by Country 2019 & 2032
- Table 10: Global Oleoresin Market Volume K Tons Forecast, by Country 2019 & 2032
- Table 11: United States Oleoresin Market Revenue (Million) Forecast, by Application 2019 & 2032
- Table 12: United States Oleoresin Market Volume (K Tons) Forecast, by Application 2019 & 2032
- Table 13: Canada Oleoresin Market Revenue (Million) Forecast, by Application 2019 & 2032
- Table 14: Canada Oleoresin Market Volume (K Tons) Forecast, by Application 2019 & 2032
- Table 15: Mexico Oleoresin Market Revenue (Million) Forecast, by Application 2019 & 2032
- Table 16: Mexico Oleoresin Market Volume (K Tons) Forecast, by Application 2019 & 2032
- Table 17: Rest of North America Oleoresin Market Revenue (Million) Forecast, by Application 2019 & 2032
- Table 18: Rest of North America Oleoresin Market Volume (K Tons) Forecast, by Application 2019 & 2032
- Table 19: Global Oleoresin Market Revenue Million Forecast, by Country 2019 & 2032
- Table 20: Global Oleoresin Market Volume K Tons Forecast, by Country 2019 & 2032
- Table 21: Spain Oleoresin Market Revenue (Million) Forecast, by Application 2019 & 2032
- Table 22: Spain Oleoresin Market Volume (K Tons) Forecast, by Application 2019 & 2032
- Table 23: United Kingdom Oleoresin Market Revenue (Million) Forecast, by Application 2019 & 2032
- Table 24: United Kingdom Oleoresin Market Volume (K Tons) Forecast, by Application 2019 & 2032
- Table 25: France Oleoresin Market Revenue (Million) Forecast, by Application 2019 & 2032
- Table 26: France Oleoresin Market Volume (K Tons) Forecast, by Application 2019 & 2032
- Table 27: Germany Oleoresin Market Revenue (Million) Forecast, by Application 2019 & 2032
- Table 28: Germany Oleoresin Market Volume (K Tons) Forecast, by Application 2019 & 2032
- Table 29: Russia Oleoresin Market Revenue (Million) Forecast, by Application 2019 & 2032
- Table 30: Russia Oleoresin Market Volume (K Tons) Forecast, by Application 2019 & 2032
- Table 31: Italy Oleoresin Market Revenue (Million) Forecast, by Application 2019 & 2032
- Table 32: Italy Oleoresin Market Volume (K Tons) Forecast, by Application 2019 & 2032
- Table 33: Rest of Europe Oleoresin Market Revenue (Million) Forecast, by Application 2019 & 2032
- Table 34: Rest of Europe Oleoresin Market Volume (K Tons) Forecast, by Application 2019 & 2032
- Table 35: Global Oleoresin Market Revenue Million Forecast, by Country 2019 & 2032
- Table 36: Global Oleoresin Market Volume K Tons Forecast, by Country 2019 & 2032
- Table 37: China Oleoresin Market Revenue (Million) Forecast, by Application 2019 & 2032
- Table 38: China Oleoresin Market Volume (K Tons) Forecast, by Application 2019 & 2032
- Table 39: Japan Oleoresin Market Revenue (Million) Forecast, by Application 2019 & 2032
- Table 40: Japan Oleoresin Market Volume (K Tons) Forecast, by Application 2019 & 2032
- Table 41: India Oleoresin Market Revenue (Million) Forecast, by Application 2019 & 2032
- Table 42: India Oleoresin Market Volume (K Tons) Forecast, by Application 2019 & 2032
- Table 43: Australia Oleoresin Market Revenue (Million) Forecast, by Application 2019 & 2032
- Table 44: Australia Oleoresin Market Volume (K Tons) Forecast, by Application 2019 & 2032
- Table 45: Rest of Asia Pacific Oleoresin Market Revenue (Million) Forecast, by Application 2019 & 2032
- Table 46: Rest of Asia Pacific Oleoresin Market Volume (K Tons) Forecast, by Application 2019 & 2032
- Table 47: Global Oleoresin Market Revenue Million Forecast, by Country 2019 & 2032
- Table 48: Global Oleoresin Market Volume K Tons Forecast, by Country 2019 & 2032
- Table 49: Brazil Oleoresin Market Revenue (Million) Forecast, by Application 2019 & 2032
- Table 50: Brazil Oleoresin Market Volume (K Tons) Forecast, by Application 2019 & 2032
- Table 51: Argentina Oleoresin Market Revenue (Million) Forecast, by Application 2019 & 2032
- Table 52: Argentina Oleoresin Market Volume (K Tons) Forecast, by Application 2019 & 2032
- Table 53: Rest of South America Oleoresin Market Revenue (Million) Forecast, by Application 2019 & 2032
- Table 54: Rest of South America Oleoresin Market Volume (K Tons) Forecast, by Application 2019 & 2032
- Table 55: Global Oleoresin Market Revenue Million Forecast, by Country 2019 & 2032
- Table 56: Global Oleoresin Market Volume K Tons Forecast, by Country 2019 & 2032
- Table 57: South Africa Oleoresin Market Revenue (Million) Forecast, by Application 2019 & 2032
- Table 58: South Africa Oleoresin Market Volume (K Tons) Forecast, by Application 2019 & 2032
- Table 59: Saudi Arabia Oleoresin Market Revenue (Million) Forecast, by Application 2019 & 2032
- Table 60: Saudi Arabia Oleoresin Market Volume (K Tons) Forecast, by Application 2019 & 2032
- Table 61: Rest of Middle East Oleoresin Market Revenue (Million) Forecast, by Application 2019 & 2032
- Table 62: Rest of Middle East Oleoresin Market Volume (K Tons) Forecast, by Application 2019 & 2032
- Table 63: Global Oleoresin Market Revenue Million Forecast, by Type 2019 & 2032
- Table 64: Global Oleoresin Market Volume K Tons Forecast, by Type 2019 & 2032
- Table 65: Global Oleoresin Market Revenue Million Forecast, by Application 2019 & 2032
- Table 66: Global Oleoresin Market Volume K Tons Forecast, by Application 2019 & 2032
- Table 67: Global Oleoresin Market Revenue Million Forecast, by Country 2019 & 2032
- Table 68: Global Oleoresin Market Volume K Tons Forecast, by Country 2019 & 2032
- Table 69: United States Oleoresin Market Revenue (Million) Forecast, by Application 2019 & 2032
- Table 70: United States Oleoresin Market Volume (K Tons) Forecast, by Application 2019 & 2032
- Table 71: Canada Oleoresin Market Revenue (Million) Forecast, by Application 2019 & 2032
- Table 72: Canada Oleoresin Market Volume (K Tons) Forecast, by Application 2019 & 2032
- Table 73: Mexico Oleoresin Market Revenue (Million) Forecast, by Application 2019 & 2032
- Table 74: Mexico Oleoresin Market Volume (K Tons) Forecast, by Application 2019 & 2032
- Table 75: Rest of North America Oleoresin Market Revenue (Million) Forecast, by Application 2019 & 2032
- Table 76: Rest of North America Oleoresin Market Volume (K Tons) Forecast, by Application 2019 & 2032
- Table 77: Global Oleoresin Market Revenue Million Forecast, by Type 2019 & 2032
- Table 78: Global Oleoresin Market Volume K Tons Forecast, by Type 2019 & 2032
- Table 79: Global Oleoresin Market Revenue Million Forecast, by Application 2019 & 2032
- Table 80: Global Oleoresin Market Volume K Tons Forecast, by Application 2019 & 2032
- Table 81: Global Oleoresin Market Revenue Million Forecast, by Country 2019 & 2032
- Table 82: Global Oleoresin Market Volume K Tons Forecast, by Country 2019 & 2032
- Table 83: Spain Oleoresin Market Revenue (Million) Forecast, by Application 2019 & 2032
- Table 84: Spain Oleoresin Market Volume (K Tons) Forecast, by Application 2019 & 2032
- Table 85: United Kingdom Oleoresin Market Revenue (Million) Forecast, by Application 2019 & 2032
- Table 86: United Kingdom Oleoresin Market Volume (K Tons) Forecast, by Application 2019 & 2032
- Table 87: France Oleoresin Market Revenue (Million) Forecast, by Application 2019 & 2032
- Table 88: France Oleoresin Market Volume (K Tons) Forecast, by Application 2019 & 2032
- Table 89: Germany Oleoresin Market Revenue (Million) Forecast, by Application 2019 & 2032
- Table 90: Germany Oleoresin Market Volume (K Tons) Forecast, by Application 2019 & 2032
- Table 91: Russia Oleoresin Market Revenue (Million) Forecast, by Application 2019 & 2032
- Table 92: Russia Oleoresin Market Volume (K Tons) Forecast, by Application 2019 & 2032
- Table 93: Italy Oleoresin Market Revenue (Million) Forecast, by Application 2019 & 2032
- Table 94: Italy Oleoresin Market Volume (K Tons) Forecast, by Application 2019 & 2032
- Table 95: Rest of Europe Oleoresin Market Revenue (Million) Forecast, by Application 2019 & 2032
- Table 96: Rest of Europe Oleoresin Market Volume (K Tons) Forecast, by Application 2019 & 2032
- Table 97: Global Oleoresin Market Revenue Million Forecast, by Type 2019 & 2032
- Table 98: Global Oleoresin Market Volume K Tons Forecast, by Type 2019 & 2032
- Table 99: Global Oleoresin Market Revenue Million Forecast, by Application 2019 & 2032
- Table 100: Global Oleoresin Market Volume K Tons Forecast, by Application 2019 & 2032
- Table 101: Global Oleoresin Market Revenue Million Forecast, by Country 2019 & 2032
- Table 102: Global Oleoresin Market Volume K Tons Forecast, by Country 2019 & 2032
- Table 103: China Oleoresin Market Revenue (Million) Forecast, by Application 2019 & 2032
- Table 104: China Oleoresin Market Volume (K Tons) Forecast, by Application 2019 & 2032
- Table 105: Japan Oleoresin Market Revenue (Million) Forecast, by Application 2019 & 2032
- Table 106: Japan Oleoresin Market Volume (K Tons) Forecast, by Application 2019 & 2032
- Table 107: India Oleoresin Market Revenue (Million) Forecast, by Application 2019 & 2032
- Table 108: India Oleoresin Market Volume (K Tons) Forecast, by Application 2019 & 2032
- Table 109: Australia Oleoresin Market Revenue (Million) Forecast, by Application 2019 & 2032
- Table 110: Australia Oleoresin Market Volume (K Tons) Forecast, by Application 2019 & 2032
- Table 111: Rest of Asia Pacific Oleoresin Market Revenue (Million) Forecast, by Application 2019 & 2032
- Table 112: Rest of Asia Pacific Oleoresin Market Volume (K Tons) Forecast, by Application 2019 & 2032
- Table 113: Global Oleoresin Market Revenue Million Forecast, by Type 2019 & 2032
- Table 114: Global Oleoresin Market Volume K Tons Forecast, by Type 2019 & 2032
- Table 115: Global Oleoresin Market Revenue Million Forecast, by Application 2019 & 2032
- Table 116: Global Oleoresin Market Volume K Tons Forecast, by Application 2019 & 2032
- Table 117: Global Oleoresin Market Revenue Million Forecast, by Country 2019 & 2032
- Table 118: Global Oleoresin Market Volume K Tons Forecast, by Country 2019 & 2032
- Table 119: Brazil Oleoresin Market Revenue (Million) Forecast, by Application 2019 & 2032
- Table 120: Brazil Oleoresin Market Volume (K Tons) Forecast, by Application 2019 & 2032
- Table 121: Argentina Oleoresin Market Revenue (Million) Forecast, by Application 2019 & 2032
- Table 122: Argentina Oleoresin Market Volume (K Tons) Forecast, by Application 2019 & 2032
- Table 123: Rest of South America Oleoresin Market Revenue (Million) Forecast, by Application 2019 & 2032
- Table 124: Rest of South America Oleoresin Market Volume (K Tons) Forecast, by Application 2019 & 2032
- Table 125: Global Oleoresin Market Revenue Million Forecast, by Type 2019 & 2032
- Table 126: Global Oleoresin Market Volume K Tons Forecast, by Type 2019 & 2032
- Table 127: Global Oleoresin Market Revenue Million Forecast, by Application 2019 & 2032
- Table 128: Global Oleoresin Market Volume K Tons Forecast, by Application 2019 & 2032
- Table 129: Global Oleoresin Market Revenue Million Forecast, by Country 2019 & 2032
- Table 130: Global Oleoresin Market Volume K Tons Forecast, by Country 2019 & 2032
- Table 131: South Africa Oleoresin Market Revenue (Million) Forecast, by Application 2019 & 2032
- Table 132: South Africa Oleoresin Market Volume (K Tons) Forecast, by Application 2019 & 2032
- Table 133: Saudi Arabia Oleoresin Market Revenue (Million) Forecast, by Application 2019 & 2032
- Table 134: Saudi Arabia Oleoresin Market Volume (K Tons) Forecast, by Application 2019 & 2032
- Table 135: Rest of Middle East Oleoresin Market Revenue (Million) Forecast, by Application 2019 & 2032
- Table 136: Rest of Middle East Oleoresin Market Volume (K Tons) Forecast, by Application 2019 & 2032
Frequently Asked Questions
1. What is the projected Compound Annual Growth Rate (CAGR) of the Oleoresin Market?
The projected CAGR is approximately 6.46%.
2. Which companies are prominent players in the Oleoresin Market?
Key companies in the market include Naturite Agro Products Ltd *List Not Exhaustive, Kalsec Inc, Lionel Hitchen, Plant Lipids, Universal Oleoresins, Synthite Industries Ltd, Silverline Chemicals Ltd, Ozone Naturals, Oterra A/s (akay Group Ltd), Mane Group.
3. What are the main segments of the Oleoresin Market?
The market segments include Type, Application.
4. Can you provide details about the market size?
The market size is estimated to be USD 1,350 Million as of 2022.
5. What are some drivers contributing to market growth?
Awareness Of Health Benefits Of Oleoresins; Rise Of Clean Label Products.
6. What are the notable trends driving market growth?
Awareness Of Health Benefits Of Oleoresins.
7. Are there any restraints impacting market growth?
Supply Chain Volatility and Availability Of Other Flavor Ingredients.
8. Can you provide examples of recent developments in the market?
February 2024: Lionel Hitchen launched FutureFlavours inspired by the metaverse and AI. To meet the younger generation's demand, the company utilized AI technology to establish its digital presence in the Metaverse through the spatial platform, allowing it to showcase its products and interact with customers in a digital environment.
9. What pricing options are available for accessing the report?
Pricing options include single-user, multi-user, and enterprise licenses priced at USD 4750, USD 5250, and USD 8750 respectively.
10. Is the market size provided in terms of value or volume?
The market size is provided in terms of value, measured in Million and volume, measured in K Tons.
11. Are there any specific market keywords associated with the report?
Yes, the market keyword associated with the report is "Oleoresin Market," which aids in identifying and referencing the specific market segment covered.
12. How do I determine which pricing option suits my needs best?
The pricing options vary based on user requirements and access needs. Individual users may opt for single-user licenses, while businesses requiring broader access may choose multi-user or enterprise licenses for cost-effective access to the report.
13. Are there any additional resources or data provided in the Oleoresin Market report?
While the report offers comprehensive insights, it's advisable to review the specific contents or supplementary materials provided to ascertain if additional resources or data are available.
14. How can I stay updated on further developments or reports in the Oleoresin Market?
To stay informed about further developments, trends, and reports in the Oleoresin Market, consider subscribing to industry newsletters, following relevant companies and organizations, or regularly checking reputable industry news sources and publications.
Methodology
Step 1 - Identification of Relevant Samples Size from Population Database


Step 2 - Approaches for Defining Global Market Size (Value, Volume* & Price*)

Note*: In applicable scenarios
Step 3 - Data Sources
Primary Research
- Web Analytics
- Survey Reports
- Research Institute
- Latest Research Reports
- Opinion Leaders
Secondary Research
- Annual Reports
- White Paper
- Latest Press Release
- Industry Association
- Paid Database
- Investor Presentations

Step 4 - Data Triangulation
Involves using different sources of information in order to increase the validity of a study
These sources are likely to be stakeholders in a program - participants, other researchers, program staff, other community members, and so on.
Then we put all data in single framework & apply various statistical tools to find out the dynamic on the market.
During the analysis stage, feedback from the stakeholder groups would be compared to determine areas of agreement as well as areas of divergence


