
Key Insights
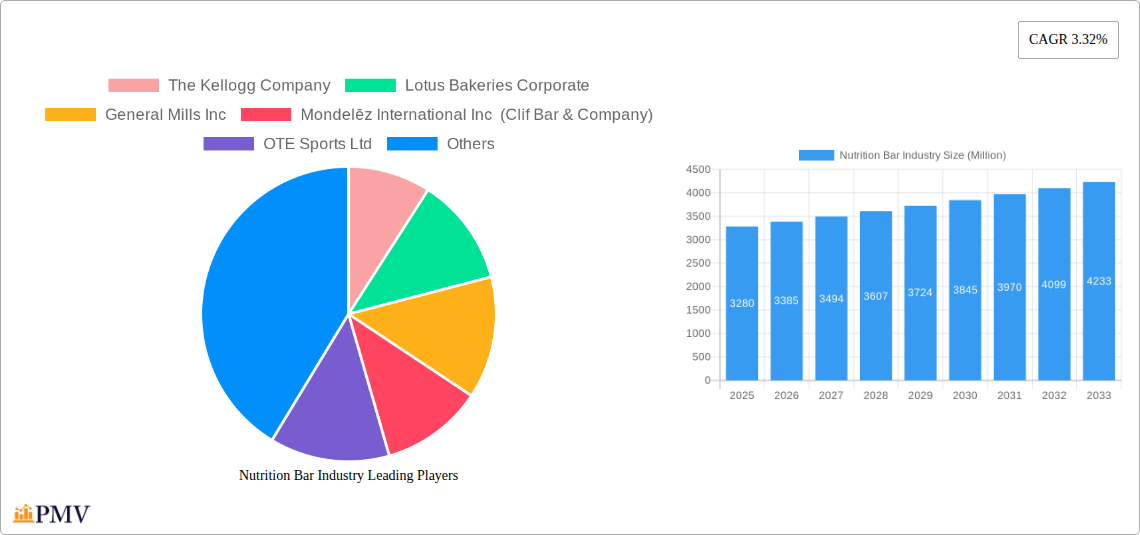
The global nutrition bar market, valued at $3.28 billion in 2025, is projected to experience robust growth, driven by increasing health consciousness, busy lifestyles demanding convenient meal replacements, and the rising prevalence of chronic diseases. The Compound Annual Growth Rate (CAGR) of 3.32% from 2025 to 2033 indicates a steady expansion, with the market expected to surpass $4.5 billion by 2033. Key drivers include the growing demand for protein bars, energy bars, and functional bars catering to specific dietary needs like vegan, gluten-free, and ketogenic options. Furthermore, the increasing adoption of online retail channels and strategic marketing campaigns by leading brands are significantly contributing to market growth. However, factors like fluctuating raw material prices and the presence of several smaller, less established players could pose challenges to market growth in the coming years. The market is segmented based on product type (protein bars, energy bars, meal replacement bars, etc.), distribution channel (online, offline), and consumer demographics, with significant regional variations. Major players like Kellogg's, General Mills, Mondelez, and Nestle are constantly innovating to maintain a competitive edge, with a focus on product diversification and expansion into emerging markets.
The competitive landscape is characterized by both established giants and emerging smaller brands focusing on specialized niches. The success of these brands hinges on factors such as product quality, innovative formulations, effective marketing and distribution strategies, and a strong focus on meeting the evolving demands of health-conscious consumers. Future growth will likely be influenced by technological advancements in nutrition bar formulations, further diversification of product offerings to accommodate niche dietary requirements, and increasing focus on sustainability within production and packaging. The market is expected to see consolidation through mergers and acquisitions, with larger players aiming to enhance their market share and product portfolios. Understanding consumer preferences and adapting to shifting health trends will be crucial for success in this dynamic market.
Nutrition Bar Industry: A Comprehensive Market Report (2019-2033)
This comprehensive report provides an in-depth analysis of the global nutrition bar industry, covering market size, segmentation, competitive landscape, and future growth prospects. The study period spans from 2019 to 2033, with 2025 serving as the base and estimated year. The report utilizes data from the historical period (2019-2024) to forecast market trends from 2025 to 2033. This report is essential for industry stakeholders, investors, and market researchers seeking a detailed understanding of this dynamic sector. The market is expected to reach xx Million USD by 2033, exhibiting a CAGR of xx% during the forecast period.
Nutrition Bar Industry Market Structure & Competitive Dynamics
The global nutrition bar market is characterized by a moderately consolidated structure, with several major players holding significant market share. Key players such as Kellogg's, General Mills, Mondelez International (including Clif Bar), Mars (Kind LLC), and Nestlé compete fiercely, employing various strategies including product innovation, brand building, and strategic acquisitions to gain market dominance. The market exhibits a robust innovation ecosystem, with continuous development of new bar formulations, flavors, and functional ingredients. Regulatory frameworks concerning labeling, ingredient claims, and food safety vary across regions, impacting product development and market entry strategies. The nutrition bar market experiences competition from alternative healthy snacks, including fruit, yogurt, and trail mixes. End-user trends, particularly health consciousness, dietary preferences (e.g., vegan, keto), and convenience, heavily influence product development. Mergers and acquisitions (M&A) play a significant role in shaping market dynamics; recent deals, such as Mondelez’s acquisition of Clif Bar, demonstrate this. The M&A activity is driven by an aim to expand product portfolios, enhance market reach, and access new technologies. Deal values have ranged from xx Million USD to xx Million USD in recent years.
Nutrition Bar Industry Industry Trends & Insights
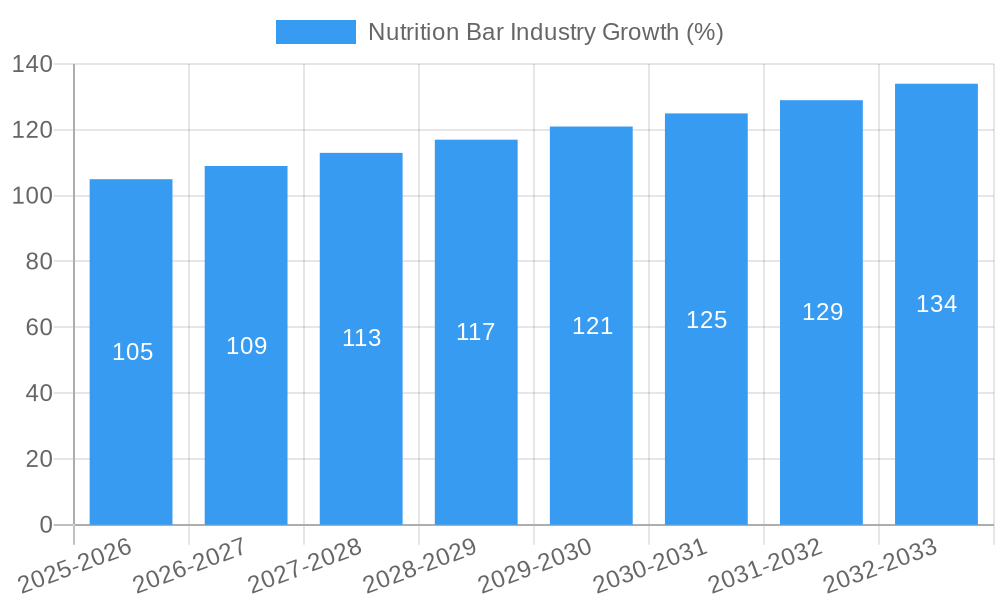
The nutrition bar market is experiencing substantial growth, driven by increasing consumer demand for convenient, healthy, and on-the-go snacking options. The rising prevalence of health-conscious lifestyles and increasing awareness of the benefits of protein and functional ingredients fuel market growth. Technological advancements, such as improved manufacturing processes and innovative packaging solutions, contribute to enhanced product quality and shelf life. Consumer preferences shift towards natural, organic, and minimally processed ingredients. The market demonstrates a clear preference for bars with low sugar, high protein, and added functional benefits. The segment's growth is also influenced by changing dietary habits and growing adoption of health and wellness practices. The growing demand for vegan, gluten-free, and keto-friendly options further drives product innovation and market expansion. Competitive dynamics involve fierce competition, leading to price wars and promotional activities. Market penetration varies considerably by region, with developed economies exhibiting higher penetration rates than emerging markets. The global nutrition bar market is projected to grow at a CAGR of xx% during the forecast period (2025-2033), reaching xx Million USD by 2033.
Dominant Markets & Segments in Nutrition Bar Industry
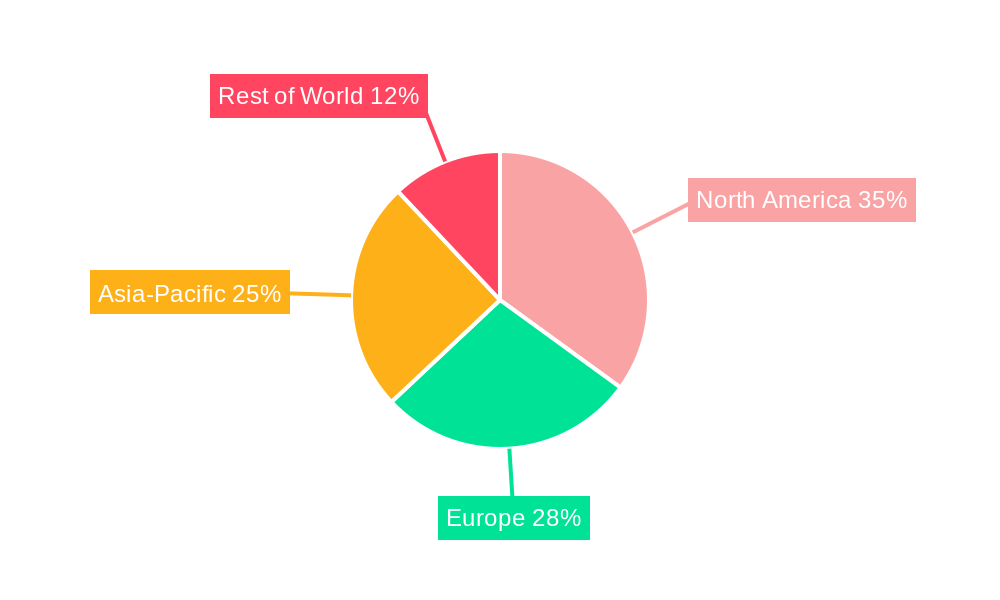
The North American nutrition bar market currently holds the leading position, driven by factors including high disposable incomes, increased health awareness, and a well-established infrastructure for distribution.
- Key Drivers in North America:
- High per capita consumption of convenience foods.
- Strong presence of major nutrition bar manufacturers.
- Well-developed retail channels (grocery stores, convenience stores).
- Growing awareness of health and wellness.
- Favorable regulatory environment.
The dominance of North America is attributed to several factors. Firstly, the high level of disposable income enables consumers to spend more on premium, healthy snack options like nutrition bars. The strong presence of major manufacturers in the region, coupled with extensive distribution networks, ensures widespread availability. The growth is also fueled by increasing awareness among consumers regarding healthy eating and maintaining fitness. Furthermore, the regulatory environment in North America is supportive of the nutrition bar industry, encouraging innovation and growth.
Nutrition Bar Industry Product Innovations
Recent product innovations in the nutrition bar market focus on addressing specific dietary needs and preferences. This includes the development of low-sugar, high-protein bars catering to health-conscious consumers, as well as the expansion of vegan, gluten-free, and keto-friendly options. The use of novel ingredients, such as plant-based proteins and superfoods, aims to enhance nutritional profiles and attract health-conscious customers. Technological advancements in formulation and processing enable the creation of bars with improved texture, taste, and shelf life. This results in a more diverse product portfolio to cater to the evolving demands of consumers.
Report Segmentation & Scope
This report segments the nutrition bar market based on several key parameters:
By Product Type: Energy bars, protein bars, meal replacement bars, other functional bars. Each segment exhibits unique growth trajectories based on consumer demand and product innovation. Energy bars remain a dominant segment; however, protein bars demonstrate significant growth potential due to rising health consciousness.
By Distribution Channel: Online sales, supermarkets/hypermarkets, convenience stores, specialty stores, others. Online channels are rapidly gaining importance, supplementing traditional brick-and-mortar retail networks.
By Region: North America, Europe, Asia-Pacific, Middle East & Africa, South America. The regional breakdown offers detailed insights into specific market dynamics and growth prospects in various geographical regions.
Key Drivers of Nutrition Bar Industry Growth
Several factors contribute to the growth of the nutrition bar industry. Firstly, the increasing prevalence of health-conscious lifestyles and rising awareness of the importance of maintaining a healthy diet are significant drivers. The convenience factor associated with nutrition bars makes them an attractive option for busy individuals. The growing demand for protein-rich and functional foods further fuels the market's growth. Technological advancements in manufacturing and processing technologies, along with innovative packaging solutions, enhance product quality and shelf life. Regulatory changes promoting healthier food choices can also positively influence market growth.
Challenges in the Nutrition Bar Industry Sector
The nutrition bar market faces several challenges. Intense competition among numerous players can lead to price wars and reduced profit margins. Strict regulatory requirements regarding ingredient labeling and health claims can increase compliance costs and limit product innovation. Fluctuations in the prices of raw materials like nuts, seeds, and dairy products can impact production costs and profitability. Supply chain disruptions can affect the timely delivery of ingredients and finished products, leading to production delays and shortages.
Leading Players in the Nutrition Bar Industry Market
- The Kellogg Company
- Lotus Bakeries Corporate
- General Mills Inc
- Mondelēz International Inc (Clif Bar & Company)
- OTE Sports Ltd
- Post Holdings Inc
- Mars Incorporated (Kind LLC)
- PepsiCo Inc
- Wholesome Habits Private Limited (EAT Anytime)
- ProBar LLC
- Nestlé S A
- *List Not Exhaustive
Key Developments in Nutrition Bar Industry Sector
- August 2022: Mondelez International, Inc. acquired Clif Bar & Company for an undisclosed sum, significantly expanding its global snack bar business.
- August 2021: General Mills, Inc. launched Performance Protein bars under its Cinnamon Toast Crunch and Golden Grahams brands, capitalizing on the growing demand for high-protein snacks.
- April 2021: Kellogg India launched K Energy bars, targeting the "in-between meal" snacking segment.
Strategic Nutrition Bar Industry Market Outlook
The future of the nutrition bar market appears promising, with continued growth driven by evolving consumer preferences and ongoing product innovations. Strategic opportunities exist in expanding into emerging markets, developing niche products targeting specific dietary needs, and leveraging technological advancements to enhance production efficiency and product quality. The focus on sustainability and ethical sourcing will gain further traction, shaping future market dynamics. The industry is poised for significant expansion, driven by factors such as the growing demand for healthier snack options, technological advancements, and the expansion of e-commerce platforms.
Nutrition Bar Industry Segmentation
-
1. Type
- 1.1. Organic
- 1.2. Conventional
-
2. Distribution Channel
- 2.1. Supermarkets/Hypermarkets
- 2.2. Convenience Stores
- 2.3. Specialty Stores
- 2.4. Online Retail Stores
- 2.5. Other Distribution Channels
Nutrition Bar Industry Segmentation By Geography
-
1. North America
- 1.1. United States
- 1.2. Canada
- 1.3. Mexico
- 1.4. Rest of North America
-
2. Europe
- 2.1. United Kingdom
- 2.2. Germany
- 2.3. Spain
- 2.4. France
- 2.5. Italy
- 2.6. Russia
- 2.7. Rest of Europe
-
3. Asia Pacific
- 3.1. China
- 3.2. Japan
- 3.3. India
- 3.4. Australia
- 3.5. Rest of Asia Pacific
-
4. South America
- 4.1. Brazil
- 4.2. Argentina
- 4.3. Rest of South America
-
5. Middle East and Africa
- 5.1. Saudi Arabia
- 5.2. South Africa
- 5.3. Rest Middle East and Africa
Nutrition Bar Industry REPORT HIGHLIGHTS
| Aspects | Details |
|---|---|
| Study Period | 2019-2033 |
| Base Year | 2024 |
| Estimated Year | 2025 |
| Forecast Period | 2025-2033 |
| Historical Period | 2019-2024 |
| Growth Rate | CAGR of 3.32% from 2019-2033 |
| Segmentation |
|
Table of Contents
- 1. Introduction
- 1.1. Research Scope
- 1.2. Market Segmentation
- 1.3. Research Methodology
- 1.4. Definitions and Assumptions
- 2. Executive Summary
- 2.1. Introduction
- 3. Market Dynamics
- 3.1. Introduction
- 3.2. Market Drivers
- 3.3. Market Restrains
- 3.4. Market Trends
- 3.4.1. Rising Demand for Healthy On-the-go Snacking
- 4. Market Factor Analysis
- 4.1. Porters Five Forces
- 4.2. Supply/Value Chain
- 4.3. PESTEL analysis
- 4.4. Market Entropy
- 4.5. Patent/Trademark Analysis
- 5. Global Nutrition Bar Industry Analysis, Insights and Forecast, 2019-2031
- 5.1. Market Analysis, Insights and Forecast - by Type
- 5.1.1. Organic
- 5.1.2. Conventional
- 5.2. Market Analysis, Insights and Forecast - by Distribution Channel
- 5.2.1. Supermarkets/Hypermarkets
- 5.2.2. Convenience Stores
- 5.2.3. Specialty Stores
- 5.2.4. Online Retail Stores
- 5.2.5. Other Distribution Channels
- 5.3. Market Analysis, Insights and Forecast - by Region
- 5.3.1. North America
- 5.3.2. Europe
- 5.3.3. Asia Pacific
- 5.3.4. South America
- 5.3.5. Middle East and Africa
- 5.1. Market Analysis, Insights and Forecast - by Type
- 6. North America Nutrition Bar Industry Analysis, Insights and Forecast, 2019-2031
- 6.1. Market Analysis, Insights and Forecast - by Type
- 6.1.1. Organic
- 6.1.2. Conventional
- 6.2. Market Analysis, Insights and Forecast - by Distribution Channel
- 6.2.1. Supermarkets/Hypermarkets
- 6.2.2. Convenience Stores
- 6.2.3. Specialty Stores
- 6.2.4. Online Retail Stores
- 6.2.5. Other Distribution Channels
- 6.1. Market Analysis, Insights and Forecast - by Type
- 7. Europe Nutrition Bar Industry Analysis, Insights and Forecast, 2019-2031
- 7.1. Market Analysis, Insights and Forecast - by Type
- 7.1.1. Organic
- 7.1.2. Conventional
- 7.2. Market Analysis, Insights and Forecast - by Distribution Channel
- 7.2.1. Supermarkets/Hypermarkets
- 7.2.2. Convenience Stores
- 7.2.3. Specialty Stores
- 7.2.4. Online Retail Stores
- 7.2.5. Other Distribution Channels
- 7.1. Market Analysis, Insights and Forecast - by Type
- 8. Asia Pacific Nutrition Bar Industry Analysis, Insights and Forecast, 2019-2031
- 8.1. Market Analysis, Insights and Forecast - by Type
- 8.1.1. Organic
- 8.1.2. Conventional
- 8.2. Market Analysis, Insights and Forecast - by Distribution Channel
- 8.2.1. Supermarkets/Hypermarkets
- 8.2.2. Convenience Stores
- 8.2.3. Specialty Stores
- 8.2.4. Online Retail Stores
- 8.2.5. Other Distribution Channels
- 8.1. Market Analysis, Insights and Forecast - by Type
- 9. South America Nutrition Bar Industry Analysis, Insights and Forecast, 2019-2031
- 9.1. Market Analysis, Insights and Forecast - by Type
- 9.1.1. Organic
- 9.1.2. Conventional
- 9.2. Market Analysis, Insights and Forecast - by Distribution Channel
- 9.2.1. Supermarkets/Hypermarkets
- 9.2.2. Convenience Stores
- 9.2.3. Specialty Stores
- 9.2.4. Online Retail Stores
- 9.2.5. Other Distribution Channels
- 9.1. Market Analysis, Insights and Forecast - by Type
- 10. Middle East and Africa Nutrition Bar Industry Analysis, Insights and Forecast, 2019-2031
- 10.1. Market Analysis, Insights and Forecast - by Type
- 10.1.1. Organic
- 10.1.2. Conventional
- 10.2. Market Analysis, Insights and Forecast - by Distribution Channel
- 10.2.1. Supermarkets/Hypermarkets
- 10.2.2. Convenience Stores
- 10.2.3. Specialty Stores
- 10.2.4. Online Retail Stores
- 10.2.5. Other Distribution Channels
- 10.1. Market Analysis, Insights and Forecast - by Type
- 11. Competitive Analysis
- 11.1. Global Market Share Analysis 2024
- 11.2. Company Profiles
- 11.2.1 The Kellogg Company
- 11.2.1.1. Overview
- 11.2.1.2. Products
- 11.2.1.3. SWOT Analysis
- 11.2.1.4. Recent Developments
- 11.2.1.5. Financials (Based on Availability)
- 11.2.2 Lotus Bakeries Corporate
- 11.2.2.1. Overview
- 11.2.2.2. Products
- 11.2.2.3. SWOT Analysis
- 11.2.2.4. Recent Developments
- 11.2.2.5. Financials (Based on Availability)
- 11.2.3 General Mills Inc
- 11.2.3.1. Overview
- 11.2.3.2. Products
- 11.2.3.3. SWOT Analysis
- 11.2.3.4. Recent Developments
- 11.2.3.5. Financials (Based on Availability)
- 11.2.4 Mondelēz International Inc (Clif Bar & Company)
- 11.2.4.1. Overview
- 11.2.4.2. Products
- 11.2.4.3. SWOT Analysis
- 11.2.4.4. Recent Developments
- 11.2.4.5. Financials (Based on Availability)
- 11.2.5 OTE Sports Ltd
- 11.2.5.1. Overview
- 11.2.5.2. Products
- 11.2.5.3. SWOT Analysis
- 11.2.5.4. Recent Developments
- 11.2.5.5. Financials (Based on Availability)
- 11.2.6 Post Holdings Inc
- 11.2.6.1. Overview
- 11.2.6.2. Products
- 11.2.6.3. SWOT Analysis
- 11.2.6.4. Recent Developments
- 11.2.6.5. Financials (Based on Availability)
- 11.2.7 Mars Incorporated (Kind LLC)
- 11.2.7.1. Overview
- 11.2.7.2. Products
- 11.2.7.3. SWOT Analysis
- 11.2.7.4. Recent Developments
- 11.2.7.5. Financials (Based on Availability)
- 11.2.8 PepsiCo Inc
- 11.2.8.1. Overview
- 11.2.8.2. Products
- 11.2.8.3. SWOT Analysis
- 11.2.8.4. Recent Developments
- 11.2.8.5. Financials (Based on Availability)
- 11.2.9 Wholesome Habits Private Limited (EAT Anytime)
- 11.2.9.1. Overview
- 11.2.9.2. Products
- 11.2.9.3. SWOT Analysis
- 11.2.9.4. Recent Developments
- 11.2.9.5. Financials (Based on Availability)
- 11.2.10 ProBar LLC
- 11.2.10.1. Overview
- 11.2.10.2. Products
- 11.2.10.3. SWOT Analysis
- 11.2.10.4. Recent Developments
- 11.2.10.5. Financials (Based on Availability)
- 11.2.11 Nestlé S A *List Not Exhaustive
- 11.2.11.1. Overview
- 11.2.11.2. Products
- 11.2.11.3. SWOT Analysis
- 11.2.11.4. Recent Developments
- 11.2.11.5. Financials (Based on Availability)
- 11.2.1 The Kellogg Company
List of Figures
- Figure 1: Global Nutrition Bar Industry Revenue Breakdown (Million, %) by Region 2024 & 2032
- Figure 2: Global Nutrition Bar Industry Volume Breakdown (Billion, %) by Region 2024 & 2032
- Figure 3: North America Nutrition Bar Industry Revenue (Million), by Type 2024 & 2032
- Figure 4: North America Nutrition Bar Industry Volume (Billion), by Type 2024 & 2032
- Figure 5: North America Nutrition Bar Industry Revenue Share (%), by Type 2024 & 2032
- Figure 6: North America Nutrition Bar Industry Volume Share (%), by Type 2024 & 2032
- Figure 7: North America Nutrition Bar Industry Revenue (Million), by Distribution Channel 2024 & 2032
- Figure 8: North America Nutrition Bar Industry Volume (Billion), by Distribution Channel 2024 & 2032
- Figure 9: North America Nutrition Bar Industry Revenue Share (%), by Distribution Channel 2024 & 2032
- Figure 10: North America Nutrition Bar Industry Volume Share (%), by Distribution Channel 2024 & 2032
- Figure 11: North America Nutrition Bar Industry Revenue (Million), by Country 2024 & 2032
- Figure 12: North America Nutrition Bar Industry Volume (Billion), by Country 2024 & 2032
- Figure 13: North America Nutrition Bar Industry Revenue Share (%), by Country 2024 & 2032
- Figure 14: North America Nutrition Bar Industry Volume Share (%), by Country 2024 & 2032
- Figure 15: Europe Nutrition Bar Industry Revenue (Million), by Type 2024 & 2032
- Figure 16: Europe Nutrition Bar Industry Volume (Billion), by Type 2024 & 2032
- Figure 17: Europe Nutrition Bar Industry Revenue Share (%), by Type 2024 & 2032
- Figure 18: Europe Nutrition Bar Industry Volume Share (%), by Type 2024 & 2032
- Figure 19: Europe Nutrition Bar Industry Revenue (Million), by Distribution Channel 2024 & 2032
- Figure 20: Europe Nutrition Bar Industry Volume (Billion), by Distribution Channel 2024 & 2032
- Figure 21: Europe Nutrition Bar Industry Revenue Share (%), by Distribution Channel 2024 & 2032
- Figure 22: Europe Nutrition Bar Industry Volume Share (%), by Distribution Channel 2024 & 2032
- Figure 23: Europe Nutrition Bar Industry Revenue (Million), by Country 2024 & 2032
- Figure 24: Europe Nutrition Bar Industry Volume (Billion), by Country 2024 & 2032
- Figure 25: Europe Nutrition Bar Industry Revenue Share (%), by Country 2024 & 2032
- Figure 26: Europe Nutrition Bar Industry Volume Share (%), by Country 2024 & 2032
- Figure 27: Asia Pacific Nutrition Bar Industry Revenue (Million), by Type 2024 & 2032
- Figure 28: Asia Pacific Nutrition Bar Industry Volume (Billion), by Type 2024 & 2032
- Figure 29: Asia Pacific Nutrition Bar Industry Revenue Share (%), by Type 2024 & 2032
- Figure 30: Asia Pacific Nutrition Bar Industry Volume Share (%), by Type 2024 & 2032
- Figure 31: Asia Pacific Nutrition Bar Industry Revenue (Million), by Distribution Channel 2024 & 2032
- Figure 32: Asia Pacific Nutrition Bar Industry Volume (Billion), by Distribution Channel 2024 & 2032
- Figure 33: Asia Pacific Nutrition Bar Industry Revenue Share (%), by Distribution Channel 2024 & 2032
- Figure 34: Asia Pacific Nutrition Bar Industry Volume Share (%), by Distribution Channel 2024 & 2032
- Figure 35: Asia Pacific Nutrition Bar Industry Revenue (Million), by Country 2024 & 2032
- Figure 36: Asia Pacific Nutrition Bar Industry Volume (Billion), by Country 2024 & 2032
- Figure 37: Asia Pacific Nutrition Bar Industry Revenue Share (%), by Country 2024 & 2032
- Figure 38: Asia Pacific Nutrition Bar Industry Volume Share (%), by Country 2024 & 2032
- Figure 39: South America Nutrition Bar Industry Revenue (Million), by Type 2024 & 2032
- Figure 40: South America Nutrition Bar Industry Volume (Billion), by Type 2024 & 2032
- Figure 41: South America Nutrition Bar Industry Revenue Share (%), by Type 2024 & 2032
- Figure 42: South America Nutrition Bar Industry Volume Share (%), by Type 2024 & 2032
- Figure 43: South America Nutrition Bar Industry Revenue (Million), by Distribution Channel 2024 & 2032
- Figure 44: South America Nutrition Bar Industry Volume (Billion), by Distribution Channel 2024 & 2032
- Figure 45: South America Nutrition Bar Industry Revenue Share (%), by Distribution Channel 2024 & 2032
- Figure 46: South America Nutrition Bar Industry Volume Share (%), by Distribution Channel 2024 & 2032
- Figure 47: South America Nutrition Bar Industry Revenue (Million), by Country 2024 & 2032
- Figure 48: South America Nutrition Bar Industry Volume (Billion), by Country 2024 & 2032
- Figure 49: South America Nutrition Bar Industry Revenue Share (%), by Country 2024 & 2032
- Figure 50: South America Nutrition Bar Industry Volume Share (%), by Country 2024 & 2032
- Figure 51: Middle East and Africa Nutrition Bar Industry Revenue (Million), by Type 2024 & 2032
- Figure 52: Middle East and Africa Nutrition Bar Industry Volume (Billion), by Type 2024 & 2032
- Figure 53: Middle East and Africa Nutrition Bar Industry Revenue Share (%), by Type 2024 & 2032
- Figure 54: Middle East and Africa Nutrition Bar Industry Volume Share (%), by Type 2024 & 2032
- Figure 55: Middle East and Africa Nutrition Bar Industry Revenue (Million), by Distribution Channel 2024 & 2032
- Figure 56: Middle East and Africa Nutrition Bar Industry Volume (Billion), by Distribution Channel 2024 & 2032
- Figure 57: Middle East and Africa Nutrition Bar Industry Revenue Share (%), by Distribution Channel 2024 & 2032
- Figure 58: Middle East and Africa Nutrition Bar Industry Volume Share (%), by Distribution Channel 2024 & 2032
- Figure 59: Middle East and Africa Nutrition Bar Industry Revenue (Million), by Country 2024 & 2032
- Figure 60: Middle East and Africa Nutrition Bar Industry Volume (Billion), by Country 2024 & 2032
- Figure 61: Middle East and Africa Nutrition Bar Industry Revenue Share (%), by Country 2024 & 2032
- Figure 62: Middle East and Africa Nutrition Bar Industry Volume Share (%), by Country 2024 & 2032
List of Tables
- Table 1: Global Nutrition Bar Industry Revenue Million Forecast, by Region 2019 & 2032
- Table 2: Global Nutrition Bar Industry Volume Billion Forecast, by Region 2019 & 2032
- Table 3: Global Nutrition Bar Industry Revenue Million Forecast, by Type 2019 & 2032
- Table 4: Global Nutrition Bar Industry Volume Billion Forecast, by Type 2019 & 2032
- Table 5: Global Nutrition Bar Industry Revenue Million Forecast, by Distribution Channel 2019 & 2032
- Table 6: Global Nutrition Bar Industry Volume Billion Forecast, by Distribution Channel 2019 & 2032
- Table 7: Global Nutrition Bar Industry Revenue Million Forecast, by Region 2019 & 2032
- Table 8: Global Nutrition Bar Industry Volume Billion Forecast, by Region 2019 & 2032
- Table 9: Global Nutrition Bar Industry Revenue Million Forecast, by Type 2019 & 2032
- Table 10: Global Nutrition Bar Industry Volume Billion Forecast, by Type 2019 & 2032
- Table 11: Global Nutrition Bar Industry Revenue Million Forecast, by Distribution Channel 2019 & 2032
- Table 12: Global Nutrition Bar Industry Volume Billion Forecast, by Distribution Channel 2019 & 2032
- Table 13: Global Nutrition Bar Industry Revenue Million Forecast, by Country 2019 & 2032
- Table 14: Global Nutrition Bar Industry Volume Billion Forecast, by Country 2019 & 2032
- Table 15: United States Nutrition Bar Industry Revenue (Million) Forecast, by Application 2019 & 2032
- Table 16: United States Nutrition Bar Industry Volume (Billion) Forecast, by Application 2019 & 2032
- Table 17: Canada Nutrition Bar Industry Revenue (Million) Forecast, by Application 2019 & 2032
- Table 18: Canada Nutrition Bar Industry Volume (Billion) Forecast, by Application 2019 & 2032
- Table 19: Mexico Nutrition Bar Industry Revenue (Million) Forecast, by Application 2019 & 2032
- Table 20: Mexico Nutrition Bar Industry Volume (Billion) Forecast, by Application 2019 & 2032
- Table 21: Rest of North America Nutrition Bar Industry Revenue (Million) Forecast, by Application 2019 & 2032
- Table 22: Rest of North America Nutrition Bar Industry Volume (Billion) Forecast, by Application 2019 & 2032
- Table 23: Global Nutrition Bar Industry Revenue Million Forecast, by Type 2019 & 2032
- Table 24: Global Nutrition Bar Industry Volume Billion Forecast, by Type 2019 & 2032
- Table 25: Global Nutrition Bar Industry Revenue Million Forecast, by Distribution Channel 2019 & 2032
- Table 26: Global Nutrition Bar Industry Volume Billion Forecast, by Distribution Channel 2019 & 2032
- Table 27: Global Nutrition Bar Industry Revenue Million Forecast, by Country 2019 & 2032
- Table 28: Global Nutrition Bar Industry Volume Billion Forecast, by Country 2019 & 2032
- Table 29: United Kingdom Nutrition Bar Industry Revenue (Million) Forecast, by Application 2019 & 2032
- Table 30: United Kingdom Nutrition Bar Industry Volume (Billion) Forecast, by Application 2019 & 2032
- Table 31: Germany Nutrition Bar Industry Revenue (Million) Forecast, by Application 2019 & 2032
- Table 32: Germany Nutrition Bar Industry Volume (Billion) Forecast, by Application 2019 & 2032
- Table 33: Spain Nutrition Bar Industry Revenue (Million) Forecast, by Application 2019 & 2032
- Table 34: Spain Nutrition Bar Industry Volume (Billion) Forecast, by Application 2019 & 2032
- Table 35: France Nutrition Bar Industry Revenue (Million) Forecast, by Application 2019 & 2032
- Table 36: France Nutrition Bar Industry Volume (Billion) Forecast, by Application 2019 & 2032
- Table 37: Italy Nutrition Bar Industry Revenue (Million) Forecast, by Application 2019 & 2032
- Table 38: Italy Nutrition Bar Industry Volume (Billion) Forecast, by Application 2019 & 2032
- Table 39: Russia Nutrition Bar Industry Revenue (Million) Forecast, by Application 2019 & 2032
- Table 40: Russia Nutrition Bar Industry Volume (Billion) Forecast, by Application 2019 & 2032
- Table 41: Rest of Europe Nutrition Bar Industry Revenue (Million) Forecast, by Application 2019 & 2032
- Table 42: Rest of Europe Nutrition Bar Industry Volume (Billion) Forecast, by Application 2019 & 2032
- Table 43: Global Nutrition Bar Industry Revenue Million Forecast, by Type 2019 & 2032
- Table 44: Global Nutrition Bar Industry Volume Billion Forecast, by Type 2019 & 2032
- Table 45: Global Nutrition Bar Industry Revenue Million Forecast, by Distribution Channel 2019 & 2032
- Table 46: Global Nutrition Bar Industry Volume Billion Forecast, by Distribution Channel 2019 & 2032
- Table 47: Global Nutrition Bar Industry Revenue Million Forecast, by Country 2019 & 2032
- Table 48: Global Nutrition Bar Industry Volume Billion Forecast, by Country 2019 & 2032
- Table 49: China Nutrition Bar Industry Revenue (Million) Forecast, by Application 2019 & 2032
- Table 50: China Nutrition Bar Industry Volume (Billion) Forecast, by Application 2019 & 2032
- Table 51: Japan Nutrition Bar Industry Revenue (Million) Forecast, by Application 2019 & 2032
- Table 52: Japan Nutrition Bar Industry Volume (Billion) Forecast, by Application 2019 & 2032
- Table 53: India Nutrition Bar Industry Revenue (Million) Forecast, by Application 2019 & 2032
- Table 54: India Nutrition Bar Industry Volume (Billion) Forecast, by Application 2019 & 2032
- Table 55: Australia Nutrition Bar Industry Revenue (Million) Forecast, by Application 2019 & 2032
- Table 56: Australia Nutrition Bar Industry Volume (Billion) Forecast, by Application 2019 & 2032
- Table 57: Rest of Asia Pacific Nutrition Bar Industry Revenue (Million) Forecast, by Application 2019 & 2032
- Table 58: Rest of Asia Pacific Nutrition Bar Industry Volume (Billion) Forecast, by Application 2019 & 2032
- Table 59: Global Nutrition Bar Industry Revenue Million Forecast, by Type 2019 & 2032
- Table 60: Global Nutrition Bar Industry Volume Billion Forecast, by Type 2019 & 2032
- Table 61: Global Nutrition Bar Industry Revenue Million Forecast, by Distribution Channel 2019 & 2032
- Table 62: Global Nutrition Bar Industry Volume Billion Forecast, by Distribution Channel 2019 & 2032
- Table 63: Global Nutrition Bar Industry Revenue Million Forecast, by Country 2019 & 2032
- Table 64: Global Nutrition Bar Industry Volume Billion Forecast, by Country 2019 & 2032
- Table 65: Brazil Nutrition Bar Industry Revenue (Million) Forecast, by Application 2019 & 2032
- Table 66: Brazil Nutrition Bar Industry Volume (Billion) Forecast, by Application 2019 & 2032
- Table 67: Argentina Nutrition Bar Industry Revenue (Million) Forecast, by Application 2019 & 2032
- Table 68: Argentina Nutrition Bar Industry Volume (Billion) Forecast, by Application 2019 & 2032
- Table 69: Rest of South America Nutrition Bar Industry Revenue (Million) Forecast, by Application 2019 & 2032
- Table 70: Rest of South America Nutrition Bar Industry Volume (Billion) Forecast, by Application 2019 & 2032
- Table 71: Global Nutrition Bar Industry Revenue Million Forecast, by Type 2019 & 2032
- Table 72: Global Nutrition Bar Industry Volume Billion Forecast, by Type 2019 & 2032
- Table 73: Global Nutrition Bar Industry Revenue Million Forecast, by Distribution Channel 2019 & 2032
- Table 74: Global Nutrition Bar Industry Volume Billion Forecast, by Distribution Channel 2019 & 2032
- Table 75: Global Nutrition Bar Industry Revenue Million Forecast, by Country 2019 & 2032
- Table 76: Global Nutrition Bar Industry Volume Billion Forecast, by Country 2019 & 2032
- Table 77: Saudi Arabia Nutrition Bar Industry Revenue (Million) Forecast, by Application 2019 & 2032
- Table 78: Saudi Arabia Nutrition Bar Industry Volume (Billion) Forecast, by Application 2019 & 2032
- Table 79: South Africa Nutrition Bar Industry Revenue (Million) Forecast, by Application 2019 & 2032
- Table 80: South Africa Nutrition Bar Industry Volume (Billion) Forecast, by Application 2019 & 2032
- Table 81: Rest Middle East and Africa Nutrition Bar Industry Revenue (Million) Forecast, by Application 2019 & 2032
- Table 82: Rest Middle East and Africa Nutrition Bar Industry Volume (Billion) Forecast, by Application 2019 & 2032
Frequently Asked Questions
1. What is the projected Compound Annual Growth Rate (CAGR) of the Nutrition Bar Industry?
The projected CAGR is approximately 3.32%.
2. Which companies are prominent players in the Nutrition Bar Industry?
Key companies in the market include The Kellogg Company, Lotus Bakeries Corporate, General Mills Inc, Mondelēz International Inc (Clif Bar & Company), OTE Sports Ltd, Post Holdings Inc, Mars Incorporated (Kind LLC), PepsiCo Inc, Wholesome Habits Private Limited (EAT Anytime), ProBar LLC, Nestlé S A *List Not Exhaustive.
3. What are the main segments of the Nutrition Bar Industry?
The market segments include Type, Distribution Channel.
4. Can you provide details about the market size?
The market size is estimated to be USD 3.28 Million as of 2022.
5. What are some drivers contributing to market growth?
N/A
6. What are the notable trends driving market growth?
Rising Demand for Healthy On-the-go Snacking.
7. Are there any restraints impacting market growth?
N/A
8. Can you provide examples of recent developments in the market?
August 2022: Clif Bar & Company, which offers a range of energy bars, was acquired by Mondelez International, Inc. With leading brands like CLIF, CLIF Kid, and LUNA complementing the company's refrigerated snacking business in the United States and popular performance nutrition business Grenade in the United Kingdom, the acquisition is anticipated to increase Mondelez International's global snack bar business to more than USD 1 billion.
9. What pricing options are available for accessing the report?
Pricing options include single-user, multi-user, and enterprise licenses priced at USD 4750, USD 5250, and USD 8750 respectively.
10. Is the market size provided in terms of value or volume?
The market size is provided in terms of value, measured in Million and volume, measured in Billion.
11. Are there any specific market keywords associated with the report?
Yes, the market keyword associated with the report is "Nutrition Bar Industry," which aids in identifying and referencing the specific market segment covered.
12. How do I determine which pricing option suits my needs best?
The pricing options vary based on user requirements and access needs. Individual users may opt for single-user licenses, while businesses requiring broader access may choose multi-user or enterprise licenses for cost-effective access to the report.
13. Are there any additional resources or data provided in the Nutrition Bar Industry report?
While the report offers comprehensive insights, it's advisable to review the specific contents or supplementary materials provided to ascertain if additional resources or data are available.
14. How can I stay updated on further developments or reports in the Nutrition Bar Industry?
To stay informed about further developments, trends, and reports in the Nutrition Bar Industry, consider subscribing to industry newsletters, following relevant companies and organizations, or regularly checking reputable industry news sources and publications.
Methodology
Step 1 - Identification of Relevant Samples Size from Population Database


Step 2 - Approaches for Defining Global Market Size (Value, Volume* & Price*)

Note*: In applicable scenarios
Step 3 - Data Sources
Primary Research
- Web Analytics
- Survey Reports
- Research Institute
- Latest Research Reports
- Opinion Leaders
Secondary Research
- Annual Reports
- White Paper
- Latest Press Release
- Industry Association
- Paid Database
- Investor Presentations

Step 4 - Data Triangulation
Involves using different sources of information in order to increase the validity of a study
These sources are likely to be stakeholders in a program - participants, other researchers, program staff, other community members, and so on.
Then we put all data in single framework & apply various statistical tools to find out the dynamic on the market.
During the analysis stage, feedback from the stakeholder groups would be compared to determine areas of agreement as well as areas of divergence


