
Key Insights
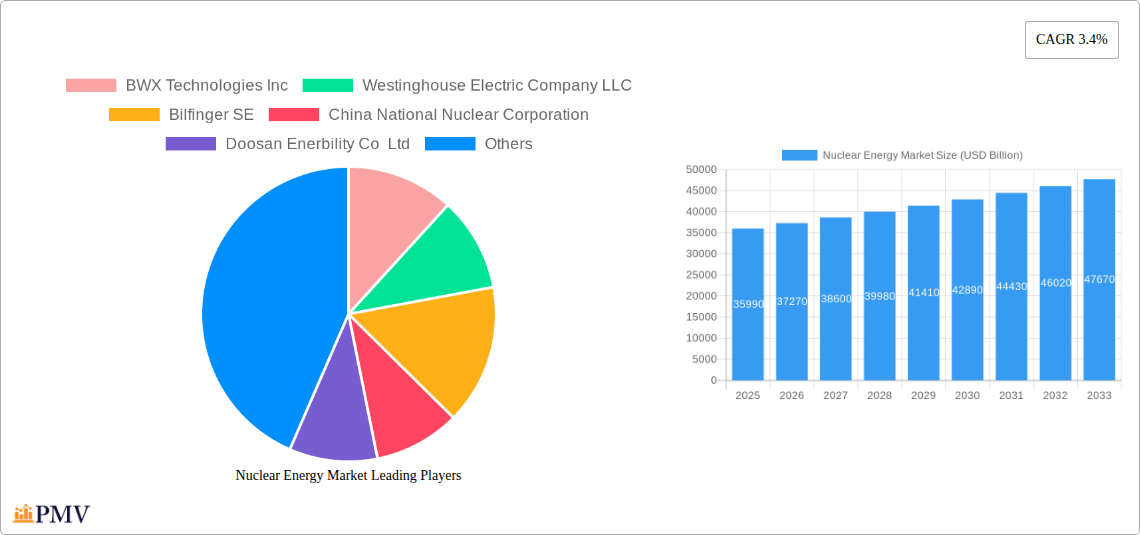
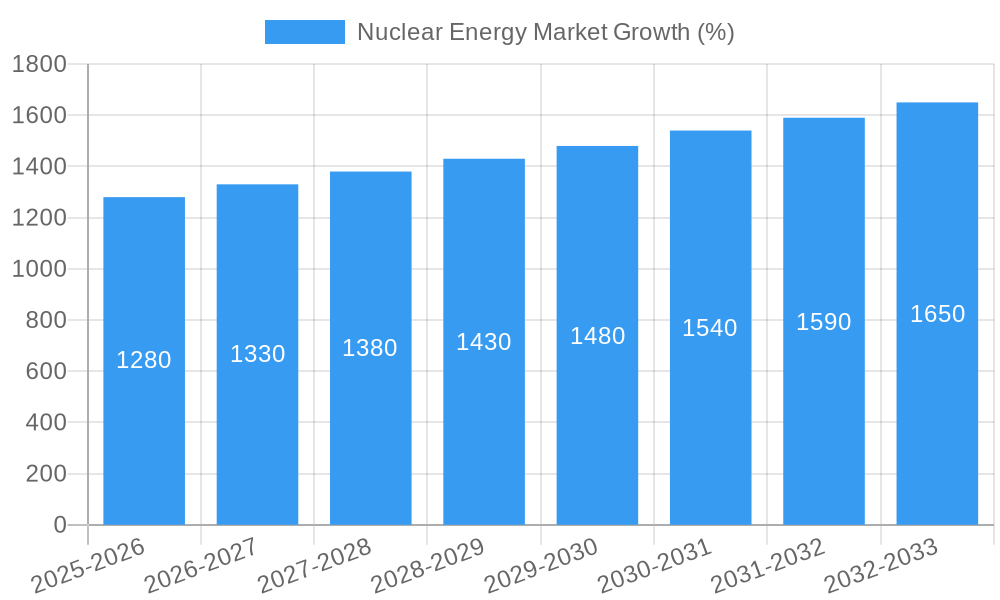
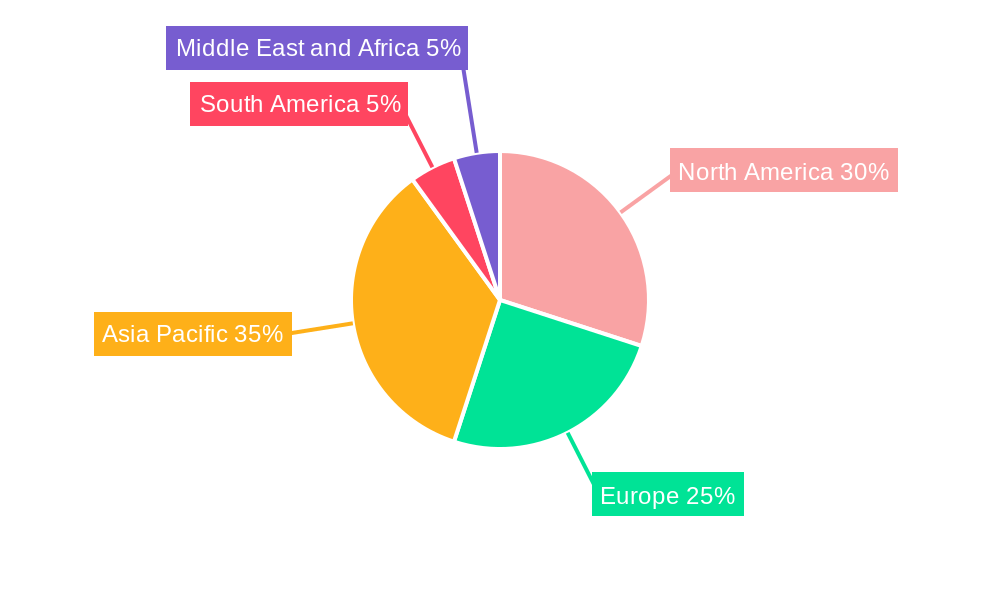
The global nuclear energy market, valued at $35.99 billion in 2025, is projected to experience steady growth, exhibiting a compound annual growth rate (CAGR) of 3.4% from 2025 to 2033. Several factors drive this expansion. Increasing concerns about climate change and the need for reliable, low-carbon energy sources are fueling demand for nuclear power. Furthermore, advancements in reactor technology, such as the development of smaller, modular reactors (SMRs), are enhancing safety and reducing construction costs, making nuclear energy more competitive with other energy sources. Government policies supporting nuclear energy development, particularly in countries aiming to achieve carbon neutrality, also contribute to market growth. However, challenges remain, including the high initial investment costs associated with nuclear power plants and public concerns regarding nuclear waste disposal and safety. The market is segmented by reactor type (Pressurized Water Reactor, Pressurized Heavy Water Reactor, Boiling Water Reactor, High-temperature Gas-cooled Reactor, Liquid-metal Fast-breeder Reactor, and Others), and application (energy generation, defense, and other applications). Key players like BWX Technologies, Westinghouse, and Rosatom are actively shaping the market through technological innovations and strategic partnerships. Geographic distribution shows significant market presence across North America, Europe, and Asia Pacific, with China, the US, and other regions investing heavily in expanding their nuclear energy capacities.
The competitive landscape is characterized by established players and emerging companies vying for market share. Established players leverage their experience and expertise in reactor design, construction, and operation, while newer entrants focus on innovative technologies and cost-effective solutions. Regional variations in regulatory frameworks and energy policies influence market growth patterns, with countries prioritizing energy independence and decarbonization strategies displaying stronger growth trajectories. The market’s trajectory is projected to remain stable, driven by a combination of technological progress, supportive government policies, and the growing urgency to address climate change. Ongoing research and development into advanced reactor designs and enhanced safety features will further define the market’s future. Despite challenges related to cost and public perception, the long-term outlook for the nuclear energy market remains positive, fueled by its role in achieving global sustainability goals.
Nuclear Energy Market: A Comprehensive Market Report (2019-2033)
This detailed report provides a comprehensive analysis of the global nuclear energy market, offering invaluable insights for industry stakeholders, investors, and researchers. With a focus on market trends, competitive landscape, and future projections, this report covers the period from 2019 to 2033, with a base year of 2025. The market is projected to reach USD xx Billion by 2033, exhibiting a CAGR of xx% during the forecast period (2025-2033).
Nuclear Energy Market Market Structure & Competitive Dynamics
The nuclear energy market exhibits a moderately concentrated structure, with a handful of major players holding significant market share. The industry is characterized by high barriers to entry, driven by substantial capital investment requirements, stringent regulatory frameworks, and the need for specialized expertise. Innovation ecosystems are primarily centered around research and development efforts by established players and government-funded initiatives. Key aspects include:
Market Concentration: The top 6 players account for approximately xx% of the global market share in 2025, with further analysis detailing individual market shares. This concentration reflects the capital-intensive nature of the industry.
Innovation Ecosystems: Collaborative R&D between governmental agencies, private companies, and universities drives technological advancements, with a strong emphasis on improving reactor efficiency, safety, and waste management.
Regulatory Frameworks: Stringent safety and environmental regulations govern the industry, significantly impacting the market dynamics and influencing investments. These regulations vary widely across different countries and regions.
Product Substitutes: Renewable energy sources, such as solar and wind power, pose the most significant competitive threat. However, the baseload power generation capabilities of nuclear energy remain a key differentiator.
End-User Trends: Increasing energy demands, coupled with a growing focus on energy security and decarbonization, are driving the adoption of nuclear energy, particularly in regions facing energy shortages.
M&A Activities: The past five years have seen a moderate level of M&A activity, primarily focused on strategic partnerships and acquisitions of smaller technology companies by larger players. Significant deals have totaled approximately USD xx Billion during this period.
Nuclear Energy Market Industry Trends & Insights
The nuclear energy market is experiencing a period of transformation, driven by several key factors:
The market's growth is fueled by increasing global energy demand, particularly in developing economies, alongside a growing imperative to reduce carbon emissions and achieve energy security. Technological advancements, such as the development of advanced reactor designs (e.g., Small Modular Reactors – SMRs), are enhancing the efficiency, safety, and economic viability of nuclear power. Furthermore, supportive government policies and initiatives in various countries are promoting nuclear energy deployment. Conversely, concerns about nuclear waste disposal, safety risks, and high initial investment costs continue to present challenges for widespread market penetration. This complex interplay between drivers and inhibitors shapes the market’s trajectory. The market is expected to witness significant growth, with a projected compound annual growth rate (CAGR) of xx% from 2025 to 2033. The penetration rate of nuclear energy in the global energy mix is anticipated to increase from xx% in 2025 to xx% by 2033. This expansion is primarily driven by the adoption of new reactor technologies and supportive government policies.
Dominant Markets & Segments in Nuclear Energy Market
Leading Regions: Asia, followed by North America and Europe, represent the dominant markets for nuclear energy. This dominance is primarily influenced by factors such as existing nuclear infrastructure, government support, and high energy demand.
Dominant Reactor Types: Pressurized Water Reactors (PWRs) currently hold the largest market share among reactor types, owing to their maturity, reliability, and widespread adoption. However, other types like Boiling Water Reactors (BWRs) and advanced reactor designs, including SMRs, are showing increasing growth potential. The market share of PWRs is estimated to be approximately xx% in 2025, with other types showing substantial growth prospects.
Dominant Applications: The energy sector accounts for the majority of the market share. Defense applications constitute a smaller, yet crucial, segment.
Key Drivers:
- Economic Policies: Government incentives, subsidies, and favorable regulatory frameworks are major growth drivers.
- Infrastructure Development: Investments in nuclear power plants and related infrastructure.
- Energy Security: Nuclear energy provides a reliable and stable source of power.
- Decarbonization Goals: The need to reduce greenhouse gas emissions is spurring increased reliance on nuclear power as a low-carbon energy source.
Nuclear Energy Market Product Innovations
Recent product innovations in the nuclear energy market are largely focused on advanced reactor designs such as Small Modular Reactors (SMRs), offering enhanced safety features, modularity, and potentially lower capital costs. These innovations are aimed at addressing the historical concerns of high capital investment and safety. Other notable advancements include improvements in nuclear fuel technology to increase efficiency and reduce waste. These advancements are improving the overall competitiveness and market acceptance of nuclear energy.
Report Segmentation & Scope
By Reactor Type:
Pressurized Water Reactor (PWR) and Pressurized Heavy Water Reactor (PHWR): This segment is projected to witness substantial growth due to established technology and large-scale deployment. The market size for PWRs and PHWRs is expected to reach USD xx Billion by 2033, growing at a CAGR of xx%.
Boiling Water Reactor (BWR): The BWR segment is expected to show moderate growth, driven by improvements in efficiency and safety features.
High-temperature Gas-cooled Reactor (HTGR): This segment demonstrates potential for future growth, driven by its enhanced safety characteristics and high thermal efficiency.
Liquid-metal Fast-breeder Reactor (LMFBR): The LMFBR segment remains relatively small but holds significant long-term potential for resource efficiency.
Other Reactor Types: This segment includes other emerging reactor technologies, potentially showing significant future growth.
By Application:
Energy: This segment dominates the market, driven by the need for baseload power generation.
Defense: This segment is niche but strategically important, contributing to national security initiatives.
Other Applications: This segment includes diverse applications, such as medical isotopes and industrial processes.
Key Drivers of Nuclear Energy Market Growth
Several factors fuel the growth of the nuclear energy market. These include stringent emission reduction targets imposed by governments worldwide, escalating global energy demand, and the need for reliable and sustainable baseload power generation. Furthermore, advancements in reactor design, such as SMRs, offer improved safety and economic viability. Finally, increased government investment and support through subsidies and regulatory incentives are also vital drivers of market expansion.
Challenges in the Nuclear Energy Market Sector
The nuclear energy sector faces several challenges, including: high capital costs associated with building nuclear power plants; stringent safety and regulatory requirements; concerns over nuclear waste disposal and proliferation risks; and competition from renewable energy sources. The complexity of obtaining necessary licenses and permits presents a major hurdle. These challenges affect project timelines and overall costs, impacting market growth.
Leading Players in the Nuclear Energy Market Market
- BWX Technologies Inc
- Westinghouse Electric Company LLC
- Bilfinger SE
- China National Nuclear Corporation
- Doosan Enerbility Co Ltd
- SKODA JS AS
- Electricite de France SA (EDF)
- Rosatom State Atomic Energy Corporation
- Bechtel Group Inc
- KEPCO Engineering & Construction
- Japan Atomic Power Company
- Duke Energy Corporation
- Mitsubishi Heavy Industries Ltd
- GE-Hitachi Nuclear Energy Inc
Key Developments in Nuclear Energy Market Sector
February 2024: Iran announces plans to construct four new nuclear power plants (5,000 MW total capacity), representing a significant investment (USD 20 Billion+) and increased regional nuclear capacity.
February 2024: India unveils plans to add 18 new nuclear reactors (13,800 MWe), significantly expanding its nuclear power generation capacity and aiming to increase the nuclear share of its energy mix to 22,480 MWe by 2031-2032.
January 2024: The UK announces a major expansion of nuclear power (USD 382 million investment in advanced uranium fuel), emphasizing energy independence and carbon reduction goals. This signals a commitment to nuclear energy as a critical component of its energy future.
Strategic Nuclear Energy Market Market Outlook
The future of the nuclear energy market appears promising, driven by the growing demand for clean energy and enhanced energy security. Technological innovations, particularly in SMR technology, are poised to improve efficiency and reduce costs. Government support, both through direct investment and favorable regulatory frameworks, will continue to play a crucial role in driving market growth. The ongoing efforts to address challenges related to waste management and safety will be essential in ensuring the long-term sustainability and public acceptance of nuclear power.
Nuclear Energy Market Segmentation
-
1. Application (Qualitative Analysis)
- 1.1. Energy
- 1.2. Defense
- 1.3. Other Applications
-
2. Reactor Type
- 2.1. Pressuri
- 2.2. Boiling Water Reactor
- 2.3. High-temperature Gas-cooled Reactor
- 2.4. Liquid-metal Fast-breeder Reactor
- 2.5. Other Reactor Types
Nuclear Energy Market Segmentation By Geography
-
1. North America
- 1.1. United States
- 1.2. Canada
- 1.3. Rest of North America
-
2. Europe
- 2.1. Germany
- 2.2. United Kingdom
- 2.3. Russia
- 2.4. France
- 2.5. Rest of Europe
-
3. Asia Pacific
- 3.1. China
- 3.2. India
- 3.3. Japan
- 3.4. South Korea
- 3.5. Rest of Asia Pacific
-
4. South America
- 4.1. Brazil
- 4.2. Argentina
- 4.3. Rest of South America
-
5. Middle East and Africa
- 5.1. United Arab Emirates
- 5.2. Saudi Arabia
- 5.3. South Africa
- 5.4. Iran
- 5.5. Rest of Middle East and Africa
Nuclear Energy Market REPORT HIGHLIGHTS
| Aspects | Details |
|---|---|
| Study Period | 2019-2033 |
| Base Year | 2024 |
| Estimated Year | 2025 |
| Forecast Period | 2025-2033 |
| Historical Period | 2019-2024 |
| Growth Rate | CAGR of 3.4% from 2019-2033 |
| Segmentation |
|
Table of Contents
- 1. Introduction
- 1.1. Research Scope
- 1.2. Market Segmentation
- 1.3. Research Methodology
- 1.4. Definitions and Assumptions
- 2. Executive Summary
- 2.1. Introduction
- 3. Market Dynamics
- 3.1. Introduction
- 3.2. Market Drivers
- 3.2.1. 4.; Increase in Demand for Clean Energy4.; Plant Lifetime Extensions With Favorable Policies
- 3.3. Market Restrains
- 3.3.1. 4.; Intense Competition From Renewable Energy Sources4.; Accidents and Uncertainty over the Cost Effectiveness
- 3.4. Market Trends
- 3.4.1. Energy Segment Expected to Dominate the Market
- 4. Market Factor Analysis
- 4.1. Porters Five Forces
- 4.2. Supply/Value Chain
- 4.3. PESTEL analysis
- 4.4. Market Entropy
- 4.5. Patent/Trademark Analysis
- 5. Global Nuclear Energy Market Analysis, Insights and Forecast, 2019-2031
- 5.1. Market Analysis, Insights and Forecast - by Application (Qualitative Analysis)
- 5.1.1. Energy
- 5.1.2. Defense
- 5.1.3. Other Applications
- 5.2. Market Analysis, Insights and Forecast - by Reactor Type
- 5.2.1. Pressuri
- 5.2.2. Boiling Water Reactor
- 5.2.3. High-temperature Gas-cooled Reactor
- 5.2.4. Liquid-metal Fast-breeder Reactor
- 5.2.5. Other Reactor Types
- 5.3. Market Analysis, Insights and Forecast - by Region
- 5.3.1. North America
- 5.3.2. Europe
- 5.3.3. Asia Pacific
- 5.3.4. South America
- 5.3.5. Middle East and Africa
- 5.1. Market Analysis, Insights and Forecast - by Application (Qualitative Analysis)
- 6. North America Nuclear Energy Market Analysis, Insights and Forecast, 2019-2031
- 6.1. Market Analysis, Insights and Forecast - by Application (Qualitative Analysis)
- 6.1.1. Energy
- 6.1.2. Defense
- 6.1.3. Other Applications
- 6.2. Market Analysis, Insights and Forecast - by Reactor Type
- 6.2.1. Pressuri
- 6.2.2. Boiling Water Reactor
- 6.2.3. High-temperature Gas-cooled Reactor
- 6.2.4. Liquid-metal Fast-breeder Reactor
- 6.2.5. Other Reactor Types
- 6.1. Market Analysis, Insights and Forecast - by Application (Qualitative Analysis)
- 7. Europe Nuclear Energy Market Analysis, Insights and Forecast, 2019-2031
- 7.1. Market Analysis, Insights and Forecast - by Application (Qualitative Analysis)
- 7.1.1. Energy
- 7.1.2. Defense
- 7.1.3. Other Applications
- 7.2. Market Analysis, Insights and Forecast - by Reactor Type
- 7.2.1. Pressuri
- 7.2.2. Boiling Water Reactor
- 7.2.3. High-temperature Gas-cooled Reactor
- 7.2.4. Liquid-metal Fast-breeder Reactor
- 7.2.5. Other Reactor Types
- 7.1. Market Analysis, Insights and Forecast - by Application (Qualitative Analysis)
- 8. Asia Pacific Nuclear Energy Market Analysis, Insights and Forecast, 2019-2031
- 8.1. Market Analysis, Insights and Forecast - by Application (Qualitative Analysis)
- 8.1.1. Energy
- 8.1.2. Defense
- 8.1.3. Other Applications
- 8.2. Market Analysis, Insights and Forecast - by Reactor Type
- 8.2.1. Pressuri
- 8.2.2. Boiling Water Reactor
- 8.2.3. High-temperature Gas-cooled Reactor
- 8.2.4. Liquid-metal Fast-breeder Reactor
- 8.2.5. Other Reactor Types
- 8.1. Market Analysis, Insights and Forecast - by Application (Qualitative Analysis)
- 9. South America Nuclear Energy Market Analysis, Insights and Forecast, 2019-2031
- 9.1. Market Analysis, Insights and Forecast - by Application (Qualitative Analysis)
- 9.1.1. Energy
- 9.1.2. Defense
- 9.1.3. Other Applications
- 9.2. Market Analysis, Insights and Forecast - by Reactor Type
- 9.2.1. Pressuri
- 9.2.2. Boiling Water Reactor
- 9.2.3. High-temperature Gas-cooled Reactor
- 9.2.4. Liquid-metal Fast-breeder Reactor
- 9.2.5. Other Reactor Types
- 9.1. Market Analysis, Insights and Forecast - by Application (Qualitative Analysis)
- 10. Middle East and Africa Nuclear Energy Market Analysis, Insights and Forecast, 2019-2031
- 10.1. Market Analysis, Insights and Forecast - by Application (Qualitative Analysis)
- 10.1.1. Energy
- 10.1.2. Defense
- 10.1.3. Other Applications
- 10.2. Market Analysis, Insights and Forecast - by Reactor Type
- 10.2.1. Pressuri
- 10.2.2. Boiling Water Reactor
- 10.2.3. High-temperature Gas-cooled Reactor
- 10.2.4. Liquid-metal Fast-breeder Reactor
- 10.2.5. Other Reactor Types
- 10.1. Market Analysis, Insights and Forecast - by Application (Qualitative Analysis)
- 11. North America Nuclear Energy Market Analysis, Insights and Forecast, 2019-2031
- 11.1. Market Analysis, Insights and Forecast - By Country/Sub-region
- 11.1.1 United States
- 11.1.2 Canada
- 11.1.3 Rest of North America
- 12. Europe Nuclear Energy Market Analysis, Insights and Forecast, 2019-2031
- 12.1. Market Analysis, Insights and Forecast - By Country/Sub-region
- 12.1.1 Germany
- 12.1.2 United Kingdom
- 12.1.3 Russia
- 12.1.4 France
- 12.1.5 Rest of Europe
- 13. Asia Pacific Nuclear Energy Market Analysis, Insights and Forecast, 2019-2031
- 13.1. Market Analysis, Insights and Forecast - By Country/Sub-region
- 13.1.1 China
- 13.1.2 India
- 13.1.3 Japan
- 13.1.4 South Korea
- 13.1.5 Rest of Asia Pacific
- 14. South America Nuclear Energy Market Analysis, Insights and Forecast, 2019-2031
- 14.1. Market Analysis, Insights and Forecast - By Country/Sub-region
- 14.1.1 Brazil
- 14.1.2 Argentina
- 14.1.3 Rest of South America
- 15. Middle East and Africa Nuclear Energy Market Analysis, Insights and Forecast, 2019-2031
- 15.1. Market Analysis, Insights and Forecast - By Country/Sub-region
- 15.1.1 United Arab Emirates
- 15.1.2 Saudi Arabia
- 15.1.3 South Africa
- 15.1.4 Iran
- 15.1.5 Rest of Middle East and Africa
- 16. Competitive Analysis
- 16.1. Global Market Share Analysis 2024
- 16.2. Company Profiles
- 16.2.1 BWX Technologies Inc
- 16.2.1.1. Overview
- 16.2.1.2. Products
- 16.2.1.3. SWOT Analysis
- 16.2.1.4. Recent Developments
- 16.2.1.5. Financials (Based on Availability)
- 16.2.2 Westinghouse Electric Company LLC
- 16.2.2.1. Overview
- 16.2.2.2. Products
- 16.2.2.3. SWOT Analysis
- 16.2.2.4. Recent Developments
- 16.2.2.5. Financials (Based on Availability)
- 16.2.3 Bilfinger SE
- 16.2.3.1. Overview
- 16.2.3.2. Products
- 16.2.3.3. SWOT Analysis
- 16.2.3.4. Recent Developments
- 16.2.3.5. Financials (Based on Availability)
- 16.2.4 China National Nuclear Corporation
- 16.2.4.1. Overview
- 16.2.4.2. Products
- 16.2.4.3. SWOT Analysis
- 16.2.4.4. Recent Developments
- 16.2.4.5. Financials (Based on Availability)
- 16.2.5 Doosan Enerbility Co Ltd
- 16.2.5.1. Overview
- 16.2.5.2. Products
- 16.2.5.3. SWOT Analysis
- 16.2.5.4. Recent Developments
- 16.2.5.5. Financials (Based on Availability)
- 16.2.6 SKODA JS AS
- 16.2.6.1. Overview
- 16.2.6.2. Products
- 16.2.6.3. SWOT Analysis
- 16.2.6.4. Recent Developments
- 16.2.6.5. Financials (Based on Availability)
- 16.2.7 Electricite de France SA (EDF)
- 16.2.7.1. Overview
- 16.2.7.2. Products
- 16.2.7.3. SWOT Analysis
- 16.2.7.4. Recent Developments
- 16.2.7.5. Financials (Based on Availability)
- 16.2.8 Rosatom State Atomic Energy Corporation
- 16.2.8.1. Overview
- 16.2.8.2. Products
- 16.2.8.3. SWOT Analysis
- 16.2.8.4. Recent Developments
- 16.2.8.5. Financials (Based on Availability)
- 16.2.9 Bechtel Group Inc
- 16.2.9.1. Overview
- 16.2.9.2. Products
- 16.2.9.3. SWOT Analysis
- 16.2.9.4. Recent Developments
- 16.2.9.5. Financials (Based on Availability)
- 16.2.10 KEPCO Engineering & Construction*List Not Exhaustive 6 4 Market Ranking/Share (%) Analysi
- 16.2.10.1. Overview
- 16.2.10.2. Products
- 16.2.10.3. SWOT Analysis
- 16.2.10.4. Recent Developments
- 16.2.10.5. Financials (Based on Availability)
- 16.2.11 Japan Atomic Power Company
- 16.2.11.1. Overview
- 16.2.11.2. Products
- 16.2.11.3. SWOT Analysis
- 16.2.11.4. Recent Developments
- 16.2.11.5. Financials (Based on Availability)
- 16.2.12 Duke Energy Corporation
- 16.2.12.1. Overview
- 16.2.12.2. Products
- 16.2.12.3. SWOT Analysis
- 16.2.12.4. Recent Developments
- 16.2.12.5. Financials (Based on Availability)
- 16.2.13 Mitsubishi Heavy Industries Ltd
- 16.2.13.1. Overview
- 16.2.13.2. Products
- 16.2.13.3. SWOT Analysis
- 16.2.13.4. Recent Developments
- 16.2.13.5. Financials (Based on Availability)
- 16.2.14 GE-Hitachi Nuclear Energy Inc
- 16.2.14.1. Overview
- 16.2.14.2. Products
- 16.2.14.3. SWOT Analysis
- 16.2.14.4. Recent Developments
- 16.2.14.5. Financials (Based on Availability)
- 16.2.1 BWX Technologies Inc
List of Figures
- Figure 1: Global Nuclear Energy Market Revenue Breakdown (USD Billion, %) by Region 2024 & 2032
- Figure 2: Global Nuclear Energy Market Volume Breakdown (gigawatt, %) by Region 2024 & 2032
- Figure 3: North America Nuclear Energy Market Revenue (USD Billion), by Country 2024 & 2032
- Figure 4: North America Nuclear Energy Market Volume (gigawatt), by Country 2024 & 2032
- Figure 5: North America Nuclear Energy Market Revenue Share (%), by Country 2024 & 2032
- Figure 6: North America Nuclear Energy Market Volume Share (%), by Country 2024 & 2032
- Figure 7: Europe Nuclear Energy Market Revenue (USD Billion), by Country 2024 & 2032
- Figure 8: Europe Nuclear Energy Market Volume (gigawatt), by Country 2024 & 2032
- Figure 9: Europe Nuclear Energy Market Revenue Share (%), by Country 2024 & 2032
- Figure 10: Europe Nuclear Energy Market Volume Share (%), by Country 2024 & 2032
- Figure 11: Asia Pacific Nuclear Energy Market Revenue (USD Billion), by Country 2024 & 2032
- Figure 12: Asia Pacific Nuclear Energy Market Volume (gigawatt), by Country 2024 & 2032
- Figure 13: Asia Pacific Nuclear Energy Market Revenue Share (%), by Country 2024 & 2032
- Figure 14: Asia Pacific Nuclear Energy Market Volume Share (%), by Country 2024 & 2032
- Figure 15: South America Nuclear Energy Market Revenue (USD Billion), by Country 2024 & 2032
- Figure 16: South America Nuclear Energy Market Volume (gigawatt), by Country 2024 & 2032
- Figure 17: South America Nuclear Energy Market Revenue Share (%), by Country 2024 & 2032
- Figure 18: South America Nuclear Energy Market Volume Share (%), by Country 2024 & 2032
- Figure 19: Middle East and Africa Nuclear Energy Market Revenue (USD Billion), by Country 2024 & 2032
- Figure 20: Middle East and Africa Nuclear Energy Market Volume (gigawatt), by Country 2024 & 2032
- Figure 21: Middle East and Africa Nuclear Energy Market Revenue Share (%), by Country 2024 & 2032
- Figure 22: Middle East and Africa Nuclear Energy Market Volume Share (%), by Country 2024 & 2032
- Figure 23: North America Nuclear Energy Market Revenue (USD Billion), by Application (Qualitative Analysis) 2024 & 2032
- Figure 24: North America Nuclear Energy Market Volume (gigawatt), by Application (Qualitative Analysis) 2024 & 2032
- Figure 25: North America Nuclear Energy Market Revenue Share (%), by Application (Qualitative Analysis) 2024 & 2032
- Figure 26: North America Nuclear Energy Market Volume Share (%), by Application (Qualitative Analysis) 2024 & 2032
- Figure 27: North America Nuclear Energy Market Revenue (USD Billion), by Reactor Type 2024 & 2032
- Figure 28: North America Nuclear Energy Market Volume (gigawatt), by Reactor Type 2024 & 2032
- Figure 29: North America Nuclear Energy Market Revenue Share (%), by Reactor Type 2024 & 2032
- Figure 30: North America Nuclear Energy Market Volume Share (%), by Reactor Type 2024 & 2032
- Figure 31: North America Nuclear Energy Market Revenue (USD Billion), by Country 2024 & 2032
- Figure 32: North America Nuclear Energy Market Volume (gigawatt), by Country 2024 & 2032
- Figure 33: North America Nuclear Energy Market Revenue Share (%), by Country 2024 & 2032
- Figure 34: North America Nuclear Energy Market Volume Share (%), by Country 2024 & 2032
- Figure 35: Europe Nuclear Energy Market Revenue (USD Billion), by Application (Qualitative Analysis) 2024 & 2032
- Figure 36: Europe Nuclear Energy Market Volume (gigawatt), by Application (Qualitative Analysis) 2024 & 2032
- Figure 37: Europe Nuclear Energy Market Revenue Share (%), by Application (Qualitative Analysis) 2024 & 2032
- Figure 38: Europe Nuclear Energy Market Volume Share (%), by Application (Qualitative Analysis) 2024 & 2032
- Figure 39: Europe Nuclear Energy Market Revenue (USD Billion), by Reactor Type 2024 & 2032
- Figure 40: Europe Nuclear Energy Market Volume (gigawatt), by Reactor Type 2024 & 2032
- Figure 41: Europe Nuclear Energy Market Revenue Share (%), by Reactor Type 2024 & 2032
- Figure 42: Europe Nuclear Energy Market Volume Share (%), by Reactor Type 2024 & 2032
- Figure 43: Europe Nuclear Energy Market Revenue (USD Billion), by Country 2024 & 2032
- Figure 44: Europe Nuclear Energy Market Volume (gigawatt), by Country 2024 & 2032
- Figure 45: Europe Nuclear Energy Market Revenue Share (%), by Country 2024 & 2032
- Figure 46: Europe Nuclear Energy Market Volume Share (%), by Country 2024 & 2032
- Figure 47: Asia Pacific Nuclear Energy Market Revenue (USD Billion), by Application (Qualitative Analysis) 2024 & 2032
- Figure 48: Asia Pacific Nuclear Energy Market Volume (gigawatt), by Application (Qualitative Analysis) 2024 & 2032
- Figure 49: Asia Pacific Nuclear Energy Market Revenue Share (%), by Application (Qualitative Analysis) 2024 & 2032
- Figure 50: Asia Pacific Nuclear Energy Market Volume Share (%), by Application (Qualitative Analysis) 2024 & 2032
- Figure 51: Asia Pacific Nuclear Energy Market Revenue (USD Billion), by Reactor Type 2024 & 2032
- Figure 52: Asia Pacific Nuclear Energy Market Volume (gigawatt), by Reactor Type 2024 & 2032
- Figure 53: Asia Pacific Nuclear Energy Market Revenue Share (%), by Reactor Type 2024 & 2032
- Figure 54: Asia Pacific Nuclear Energy Market Volume Share (%), by Reactor Type 2024 & 2032
- Figure 55: Asia Pacific Nuclear Energy Market Revenue (USD Billion), by Country 2024 & 2032
- Figure 56: Asia Pacific Nuclear Energy Market Volume (gigawatt), by Country 2024 & 2032
- Figure 57: Asia Pacific Nuclear Energy Market Revenue Share (%), by Country 2024 & 2032
- Figure 58: Asia Pacific Nuclear Energy Market Volume Share (%), by Country 2024 & 2032
- Figure 59: South America Nuclear Energy Market Revenue (USD Billion), by Application (Qualitative Analysis) 2024 & 2032
- Figure 60: South America Nuclear Energy Market Volume (gigawatt), by Application (Qualitative Analysis) 2024 & 2032
- Figure 61: South America Nuclear Energy Market Revenue Share (%), by Application (Qualitative Analysis) 2024 & 2032
- Figure 62: South America Nuclear Energy Market Volume Share (%), by Application (Qualitative Analysis) 2024 & 2032
- Figure 63: South America Nuclear Energy Market Revenue (USD Billion), by Reactor Type 2024 & 2032
- Figure 64: South America Nuclear Energy Market Volume (gigawatt), by Reactor Type 2024 & 2032
- Figure 65: South America Nuclear Energy Market Revenue Share (%), by Reactor Type 2024 & 2032
- Figure 66: South America Nuclear Energy Market Volume Share (%), by Reactor Type 2024 & 2032
- Figure 67: South America Nuclear Energy Market Revenue (USD Billion), by Country 2024 & 2032
- Figure 68: South America Nuclear Energy Market Volume (gigawatt), by Country 2024 & 2032
- Figure 69: South America Nuclear Energy Market Revenue Share (%), by Country 2024 & 2032
- Figure 70: South America Nuclear Energy Market Volume Share (%), by Country 2024 & 2032
- Figure 71: Middle East and Africa Nuclear Energy Market Revenue (USD Billion), by Application (Qualitative Analysis) 2024 & 2032
- Figure 72: Middle East and Africa Nuclear Energy Market Volume (gigawatt), by Application (Qualitative Analysis) 2024 & 2032
- Figure 73: Middle East and Africa Nuclear Energy Market Revenue Share (%), by Application (Qualitative Analysis) 2024 & 2032
- Figure 74: Middle East and Africa Nuclear Energy Market Volume Share (%), by Application (Qualitative Analysis) 2024 & 2032
- Figure 75: Middle East and Africa Nuclear Energy Market Revenue (USD Billion), by Reactor Type 2024 & 2032
- Figure 76: Middle East and Africa Nuclear Energy Market Volume (gigawatt), by Reactor Type 2024 & 2032
- Figure 77: Middle East and Africa Nuclear Energy Market Revenue Share (%), by Reactor Type 2024 & 2032
- Figure 78: Middle East and Africa Nuclear Energy Market Volume Share (%), by Reactor Type 2024 & 2032
- Figure 79: Middle East and Africa Nuclear Energy Market Revenue (USD Billion), by Country 2024 & 2032
- Figure 80: Middle East and Africa Nuclear Energy Market Volume (gigawatt), by Country 2024 & 2032
- Figure 81: Middle East and Africa Nuclear Energy Market Revenue Share (%), by Country 2024 & 2032
- Figure 82: Middle East and Africa Nuclear Energy Market Volume Share (%), by Country 2024 & 2032
List of Tables
- Table 1: Global Nuclear Energy Market Revenue USD Billion Forecast, by Region 2019 & 2032
- Table 2: Global Nuclear Energy Market Volume gigawatt Forecast, by Region 2019 & 2032
- Table 3: Global Nuclear Energy Market Revenue USD Billion Forecast, by Application (Qualitative Analysis) 2019 & 2032
- Table 4: Global Nuclear Energy Market Volume gigawatt Forecast, by Application (Qualitative Analysis) 2019 & 2032
- Table 5: Global Nuclear Energy Market Revenue USD Billion Forecast, by Reactor Type 2019 & 2032
- Table 6: Global Nuclear Energy Market Volume gigawatt Forecast, by Reactor Type 2019 & 2032
- Table 7: Global Nuclear Energy Market Revenue USD Billion Forecast, by Region 2019 & 2032
- Table 8: Global Nuclear Energy Market Volume gigawatt Forecast, by Region 2019 & 2032
- Table 9: Global Nuclear Energy Market Revenue USD Billion Forecast, by Country 2019 & 2032
- Table 10: Global Nuclear Energy Market Volume gigawatt Forecast, by Country 2019 & 2032
- Table 11: United States Nuclear Energy Market Revenue (USD Billion) Forecast, by Application 2019 & 2032
- Table 12: United States Nuclear Energy Market Volume (gigawatt) Forecast, by Application 2019 & 2032
- Table 13: Canada Nuclear Energy Market Revenue (USD Billion) Forecast, by Application 2019 & 2032
- Table 14: Canada Nuclear Energy Market Volume (gigawatt) Forecast, by Application 2019 & 2032
- Table 15: Rest of North America Nuclear Energy Market Revenue (USD Billion) Forecast, by Application 2019 & 2032
- Table 16: Rest of North America Nuclear Energy Market Volume (gigawatt) Forecast, by Application 2019 & 2032
- Table 17: Global Nuclear Energy Market Revenue USD Billion Forecast, by Country 2019 & 2032
- Table 18: Global Nuclear Energy Market Volume gigawatt Forecast, by Country 2019 & 2032
- Table 19: Germany Nuclear Energy Market Revenue (USD Billion) Forecast, by Application 2019 & 2032
- Table 20: Germany Nuclear Energy Market Volume (gigawatt) Forecast, by Application 2019 & 2032
- Table 21: United Kingdom Nuclear Energy Market Revenue (USD Billion) Forecast, by Application 2019 & 2032
- Table 22: United Kingdom Nuclear Energy Market Volume (gigawatt) Forecast, by Application 2019 & 2032
- Table 23: Russia Nuclear Energy Market Revenue (USD Billion) Forecast, by Application 2019 & 2032
- Table 24: Russia Nuclear Energy Market Volume (gigawatt) Forecast, by Application 2019 & 2032
- Table 25: France Nuclear Energy Market Revenue (USD Billion) Forecast, by Application 2019 & 2032
- Table 26: France Nuclear Energy Market Volume (gigawatt) Forecast, by Application 2019 & 2032
- Table 27: Rest of Europe Nuclear Energy Market Revenue (USD Billion) Forecast, by Application 2019 & 2032
- Table 28: Rest of Europe Nuclear Energy Market Volume (gigawatt) Forecast, by Application 2019 & 2032
- Table 29: Global Nuclear Energy Market Revenue USD Billion Forecast, by Country 2019 & 2032
- Table 30: Global Nuclear Energy Market Volume gigawatt Forecast, by Country 2019 & 2032
- Table 31: China Nuclear Energy Market Revenue (USD Billion) Forecast, by Application 2019 & 2032
- Table 32: China Nuclear Energy Market Volume (gigawatt) Forecast, by Application 2019 & 2032
- Table 33: India Nuclear Energy Market Revenue (USD Billion) Forecast, by Application 2019 & 2032
- Table 34: India Nuclear Energy Market Volume (gigawatt) Forecast, by Application 2019 & 2032
- Table 35: Japan Nuclear Energy Market Revenue (USD Billion) Forecast, by Application 2019 & 2032
- Table 36: Japan Nuclear Energy Market Volume (gigawatt) Forecast, by Application 2019 & 2032
- Table 37: South Korea Nuclear Energy Market Revenue (USD Billion) Forecast, by Application 2019 & 2032
- Table 38: South Korea Nuclear Energy Market Volume (gigawatt) Forecast, by Application 2019 & 2032
- Table 39: Rest of Asia Pacific Nuclear Energy Market Revenue (USD Billion) Forecast, by Application 2019 & 2032
- Table 40: Rest of Asia Pacific Nuclear Energy Market Volume (gigawatt) Forecast, by Application 2019 & 2032
- Table 41: Global Nuclear Energy Market Revenue USD Billion Forecast, by Country 2019 & 2032
- Table 42: Global Nuclear Energy Market Volume gigawatt Forecast, by Country 2019 & 2032
- Table 43: Brazil Nuclear Energy Market Revenue (USD Billion) Forecast, by Application 2019 & 2032
- Table 44: Brazil Nuclear Energy Market Volume (gigawatt) Forecast, by Application 2019 & 2032
- Table 45: Argentina Nuclear Energy Market Revenue (USD Billion) Forecast, by Application 2019 & 2032
- Table 46: Argentina Nuclear Energy Market Volume (gigawatt) Forecast, by Application 2019 & 2032
- Table 47: Rest of South America Nuclear Energy Market Revenue (USD Billion) Forecast, by Application 2019 & 2032
- Table 48: Rest of South America Nuclear Energy Market Volume (gigawatt) Forecast, by Application 2019 & 2032
- Table 49: Global Nuclear Energy Market Revenue USD Billion Forecast, by Country 2019 & 2032
- Table 50: Global Nuclear Energy Market Volume gigawatt Forecast, by Country 2019 & 2032
- Table 51: United Arab Emirates Nuclear Energy Market Revenue (USD Billion) Forecast, by Application 2019 & 2032
- Table 52: United Arab Emirates Nuclear Energy Market Volume (gigawatt) Forecast, by Application 2019 & 2032
- Table 53: Saudi Arabia Nuclear Energy Market Revenue (USD Billion) Forecast, by Application 2019 & 2032
- Table 54: Saudi Arabia Nuclear Energy Market Volume (gigawatt) Forecast, by Application 2019 & 2032
- Table 55: South Africa Nuclear Energy Market Revenue (USD Billion) Forecast, by Application 2019 & 2032
- Table 56: South Africa Nuclear Energy Market Volume (gigawatt) Forecast, by Application 2019 & 2032
- Table 57: Iran Nuclear Energy Market Revenue (USD Billion) Forecast, by Application 2019 & 2032
- Table 58: Iran Nuclear Energy Market Volume (gigawatt) Forecast, by Application 2019 & 2032
- Table 59: Rest of Middle East and Africa Nuclear Energy Market Revenue (USD Billion) Forecast, by Application 2019 & 2032
- Table 60: Rest of Middle East and Africa Nuclear Energy Market Volume (gigawatt) Forecast, by Application 2019 & 2032
- Table 61: Global Nuclear Energy Market Revenue USD Billion Forecast, by Application (Qualitative Analysis) 2019 & 2032
- Table 62: Global Nuclear Energy Market Volume gigawatt Forecast, by Application (Qualitative Analysis) 2019 & 2032
- Table 63: Global Nuclear Energy Market Revenue USD Billion Forecast, by Reactor Type 2019 & 2032
- Table 64: Global Nuclear Energy Market Volume gigawatt Forecast, by Reactor Type 2019 & 2032
- Table 65: Global Nuclear Energy Market Revenue USD Billion Forecast, by Country 2019 & 2032
- Table 66: Global Nuclear Energy Market Volume gigawatt Forecast, by Country 2019 & 2032
- Table 67: United States Nuclear Energy Market Revenue (USD Billion) Forecast, by Application 2019 & 2032
- Table 68: United States Nuclear Energy Market Volume (gigawatt) Forecast, by Application 2019 & 2032
- Table 69: Canada Nuclear Energy Market Revenue (USD Billion) Forecast, by Application 2019 & 2032
- Table 70: Canada Nuclear Energy Market Volume (gigawatt) Forecast, by Application 2019 & 2032
- Table 71: Rest of North America Nuclear Energy Market Revenue (USD Billion) Forecast, by Application 2019 & 2032
- Table 72: Rest of North America Nuclear Energy Market Volume (gigawatt) Forecast, by Application 2019 & 2032
- Table 73: Global Nuclear Energy Market Revenue USD Billion Forecast, by Application (Qualitative Analysis) 2019 & 2032
- Table 74: Global Nuclear Energy Market Volume gigawatt Forecast, by Application (Qualitative Analysis) 2019 & 2032
- Table 75: Global Nuclear Energy Market Revenue USD Billion Forecast, by Reactor Type 2019 & 2032
- Table 76: Global Nuclear Energy Market Volume gigawatt Forecast, by Reactor Type 2019 & 2032
- Table 77: Global Nuclear Energy Market Revenue USD Billion Forecast, by Country 2019 & 2032
- Table 78: Global Nuclear Energy Market Volume gigawatt Forecast, by Country 2019 & 2032
- Table 79: Germany Nuclear Energy Market Revenue (USD Billion) Forecast, by Application 2019 & 2032
- Table 80: Germany Nuclear Energy Market Volume (gigawatt) Forecast, by Application 2019 & 2032
- Table 81: United Kingdom Nuclear Energy Market Revenue (USD Billion) Forecast, by Application 2019 & 2032
- Table 82: United Kingdom Nuclear Energy Market Volume (gigawatt) Forecast, by Application 2019 & 2032
- Table 83: Russia Nuclear Energy Market Revenue (USD Billion) Forecast, by Application 2019 & 2032
- Table 84: Russia Nuclear Energy Market Volume (gigawatt) Forecast, by Application 2019 & 2032
- Table 85: France Nuclear Energy Market Revenue (USD Billion) Forecast, by Application 2019 & 2032
- Table 86: France Nuclear Energy Market Volume (gigawatt) Forecast, by Application 2019 & 2032
- Table 87: Rest of Europe Nuclear Energy Market Revenue (USD Billion) Forecast, by Application 2019 & 2032
- Table 88: Rest of Europe Nuclear Energy Market Volume (gigawatt) Forecast, by Application 2019 & 2032
- Table 89: Global Nuclear Energy Market Revenue USD Billion Forecast, by Application (Qualitative Analysis) 2019 & 2032
- Table 90: Global Nuclear Energy Market Volume gigawatt Forecast, by Application (Qualitative Analysis) 2019 & 2032
- Table 91: Global Nuclear Energy Market Revenue USD Billion Forecast, by Reactor Type 2019 & 2032
- Table 92: Global Nuclear Energy Market Volume gigawatt Forecast, by Reactor Type 2019 & 2032
- Table 93: Global Nuclear Energy Market Revenue USD Billion Forecast, by Country 2019 & 2032
- Table 94: Global Nuclear Energy Market Volume gigawatt Forecast, by Country 2019 & 2032
- Table 95: China Nuclear Energy Market Revenue (USD Billion) Forecast, by Application 2019 & 2032
- Table 96: China Nuclear Energy Market Volume (gigawatt) Forecast, by Application 2019 & 2032
- Table 97: India Nuclear Energy Market Revenue (USD Billion) Forecast, by Application 2019 & 2032
- Table 98: India Nuclear Energy Market Volume (gigawatt) Forecast, by Application 2019 & 2032
- Table 99: Japan Nuclear Energy Market Revenue (USD Billion) Forecast, by Application 2019 & 2032
- Table 100: Japan Nuclear Energy Market Volume (gigawatt) Forecast, by Application 2019 & 2032
- Table 101: South Korea Nuclear Energy Market Revenue (USD Billion) Forecast, by Application 2019 & 2032
- Table 102: South Korea Nuclear Energy Market Volume (gigawatt) Forecast, by Application 2019 & 2032
- Table 103: Rest of Asia Pacific Nuclear Energy Market Revenue (USD Billion) Forecast, by Application 2019 & 2032
- Table 104: Rest of Asia Pacific Nuclear Energy Market Volume (gigawatt) Forecast, by Application 2019 & 2032
- Table 105: Global Nuclear Energy Market Revenue USD Billion Forecast, by Application (Qualitative Analysis) 2019 & 2032
- Table 106: Global Nuclear Energy Market Volume gigawatt Forecast, by Application (Qualitative Analysis) 2019 & 2032
- Table 107: Global Nuclear Energy Market Revenue USD Billion Forecast, by Reactor Type 2019 & 2032
- Table 108: Global Nuclear Energy Market Volume gigawatt Forecast, by Reactor Type 2019 & 2032
- Table 109: Global Nuclear Energy Market Revenue USD Billion Forecast, by Country 2019 & 2032
- Table 110: Global Nuclear Energy Market Volume gigawatt Forecast, by Country 2019 & 2032
- Table 111: Brazil Nuclear Energy Market Revenue (USD Billion) Forecast, by Application 2019 & 2032
- Table 112: Brazil Nuclear Energy Market Volume (gigawatt) Forecast, by Application 2019 & 2032
- Table 113: Argentina Nuclear Energy Market Revenue (USD Billion) Forecast, by Application 2019 & 2032
- Table 114: Argentina Nuclear Energy Market Volume (gigawatt) Forecast, by Application 2019 & 2032
- Table 115: Rest of South America Nuclear Energy Market Revenue (USD Billion) Forecast, by Application 2019 & 2032
- Table 116: Rest of South America Nuclear Energy Market Volume (gigawatt) Forecast, by Application 2019 & 2032
- Table 117: Global Nuclear Energy Market Revenue USD Billion Forecast, by Application (Qualitative Analysis) 2019 & 2032
- Table 118: Global Nuclear Energy Market Volume gigawatt Forecast, by Application (Qualitative Analysis) 2019 & 2032
- Table 119: Global Nuclear Energy Market Revenue USD Billion Forecast, by Reactor Type 2019 & 2032
- Table 120: Global Nuclear Energy Market Volume gigawatt Forecast, by Reactor Type 2019 & 2032
- Table 121: Global Nuclear Energy Market Revenue USD Billion Forecast, by Country 2019 & 2032
- Table 122: Global Nuclear Energy Market Volume gigawatt Forecast, by Country 2019 & 2032
- Table 123: United Arab Emirates Nuclear Energy Market Revenue (USD Billion) Forecast, by Application 2019 & 2032
- Table 124: United Arab Emirates Nuclear Energy Market Volume (gigawatt) Forecast, by Application 2019 & 2032
- Table 125: Saudi Arabia Nuclear Energy Market Revenue (USD Billion) Forecast, by Application 2019 & 2032
- Table 126: Saudi Arabia Nuclear Energy Market Volume (gigawatt) Forecast, by Application 2019 & 2032
- Table 127: South Africa Nuclear Energy Market Revenue (USD Billion) Forecast, by Application 2019 & 2032
- Table 128: South Africa Nuclear Energy Market Volume (gigawatt) Forecast, by Application 2019 & 2032
- Table 129: Iran Nuclear Energy Market Revenue (USD Billion) Forecast, by Application 2019 & 2032
- Table 130: Iran Nuclear Energy Market Volume (gigawatt) Forecast, by Application 2019 & 2032
- Table 131: Rest of Middle East and Africa Nuclear Energy Market Revenue (USD Billion) Forecast, by Application 2019 & 2032
- Table 132: Rest of Middle East and Africa Nuclear Energy Market Volume (gigawatt) Forecast, by Application 2019 & 2032
Frequently Asked Questions
1. What is the projected Compound Annual Growth Rate (CAGR) of the Nuclear Energy Market?
The projected CAGR is approximately 3.4%.
2. Which companies are prominent players in the Nuclear Energy Market?
Key companies in the market include BWX Technologies Inc, Westinghouse Electric Company LLC, Bilfinger SE, China National Nuclear Corporation, Doosan Enerbility Co Ltd, SKODA JS AS, Electricite de France SA (EDF), Rosatom State Atomic Energy Corporation, Bechtel Group Inc, KEPCO Engineering & Construction*List Not Exhaustive 6 4 Market Ranking/Share (%) Analysi, Japan Atomic Power Company, Duke Energy Corporation, Mitsubishi Heavy Industries Ltd, GE-Hitachi Nuclear Energy Inc.
3. What are the main segments of the Nuclear Energy Market?
The market segments include Application (Qualitative Analysis) , Reactor Type.
4. Can you provide details about the market size?
The market size is estimated to be USD 35.99 USD Billion as of 2022.
5. What are some drivers contributing to market growth?
4.; Increase in Demand for Clean Energy4.; Plant Lifetime Extensions With Favorable Policies.
6. What are the notable trends driving market growth?
Energy Segment Expected to Dominate the Market.
7. Are there any restraints impacting market growth?
4.; Intense Competition From Renewable Energy Sources4.; Accidents and Uncertainty over the Cost Effectiveness.
8. Can you provide examples of recent developments in the market?
February 2024: Iran commenced the construction of four additional nuclear power plants in the southern part of the country. These plants will have a combined capacity of 5,000 MW. The plants will be located in the port town of Sirik on Iran's East coast, about 1,150 km South of Tehran. The project is estimated to cost more than USD 20 billion. Each plant is projected to consume 35 tonnes of nuclear fuel per annum.
9. What pricing options are available for accessing the report?
Pricing options include single-user, multi-user, and enterprise licenses priced at USD 4750, USD 5250, and USD 8750 respectively.
10. Is the market size provided in terms of value or volume?
The market size is provided in terms of value, measured in USD Billion and volume, measured in gigawatt.
11. Are there any specific market keywords associated with the report?
Yes, the market keyword associated with the report is "Nuclear Energy Market," which aids in identifying and referencing the specific market segment covered.
12. How do I determine which pricing option suits my needs best?
The pricing options vary based on user requirements and access needs. Individual users may opt for single-user licenses, while businesses requiring broader access may choose multi-user or enterprise licenses for cost-effective access to the report.
13. Are there any additional resources or data provided in the Nuclear Energy Market report?
While the report offers comprehensive insights, it's advisable to review the specific contents or supplementary materials provided to ascertain if additional resources or data are available.
14. How can I stay updated on further developments or reports in the Nuclear Energy Market?
To stay informed about further developments, trends, and reports in the Nuclear Energy Market, consider subscribing to industry newsletters, following relevant companies and organizations, or regularly checking reputable industry news sources and publications.
Methodology
Step 1 - Identification of Relevant Samples Size from Population Database


Step 2 - Approaches for Defining Global Market Size (Value, Volume* & Price*)

Note*: In applicable scenarios
Step 3 - Data Sources
Primary Research
- Web Analytics
- Survey Reports
- Research Institute
- Latest Research Reports
- Opinion Leaders
Secondary Research
- Annual Reports
- White Paper
- Latest Press Release
- Industry Association
- Paid Database
- Investor Presentations

Step 4 - Data Triangulation
Involves using different sources of information in order to increase the validity of a study
These sources are likely to be stakeholders in a program - participants, other researchers, program staff, other community members, and so on.
Then we put all data in single framework & apply various statistical tools to find out the dynamic on the market.
During the analysis stage, feedback from the stakeholder groups would be compared to determine areas of agreement as well as areas of divergence


