
Key Insights
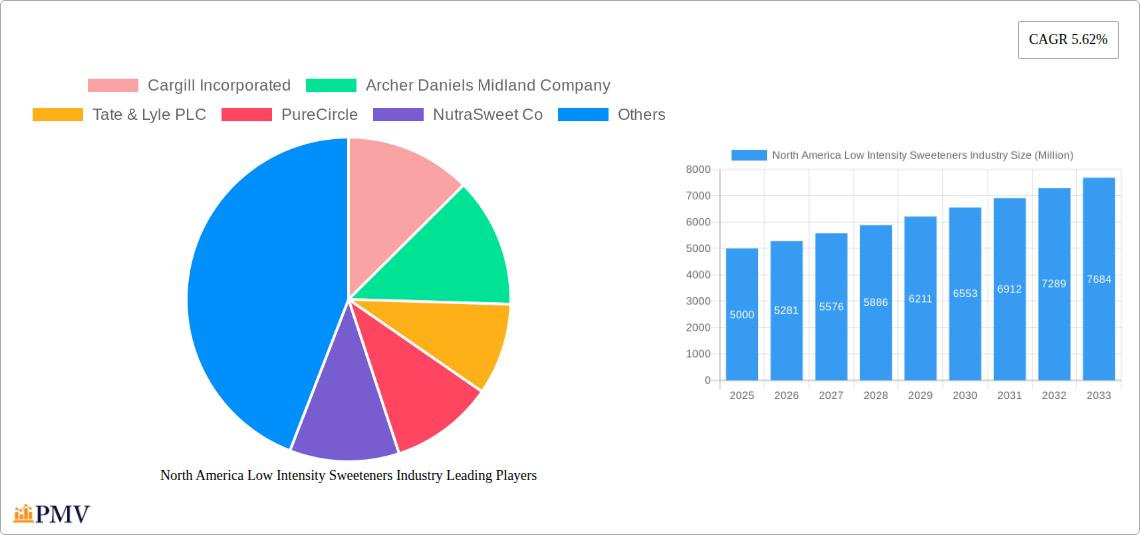
The North American low-intensity sweeteners market, valued at approximately $5 billion in 2025, is projected to experience robust growth, driven by increasing health consciousness and the rising prevalence of diabetes and obesity. Consumers are actively seeking alternatives to traditional sugar, fueling demand for healthier sweeteners across food and beverage applications. The market's expansion is further propelled by the growing popularity of sugar-free and low-sugar products, particularly among health-conscious millennials and Gen Z consumers. Sucralose, stevia, and aspartame remain dominant segments, though stevia's natural origin is driving its market share increase as consumers prioritize natural ingredients. The food and beverage sectors are the largest application areas, with significant potential for growth in functional foods and beverages incorporating these sweeteners. However, concerns regarding the potential long-term health effects of some artificial sweeteners, coupled with fluctuating raw material prices, pose challenges to the market's sustained expansion. The increasing regulatory scrutiny on labeling and ingredient transparency also influences market dynamics. Key players like Cargill, ADM, and Tate & Lyle leverage their strong distribution networks and product diversification strategies to maintain their market leadership. Technological advancements focused on improving the taste and functionality of low-intensity sweeteners are expected to drive innovation and market growth in the coming years.
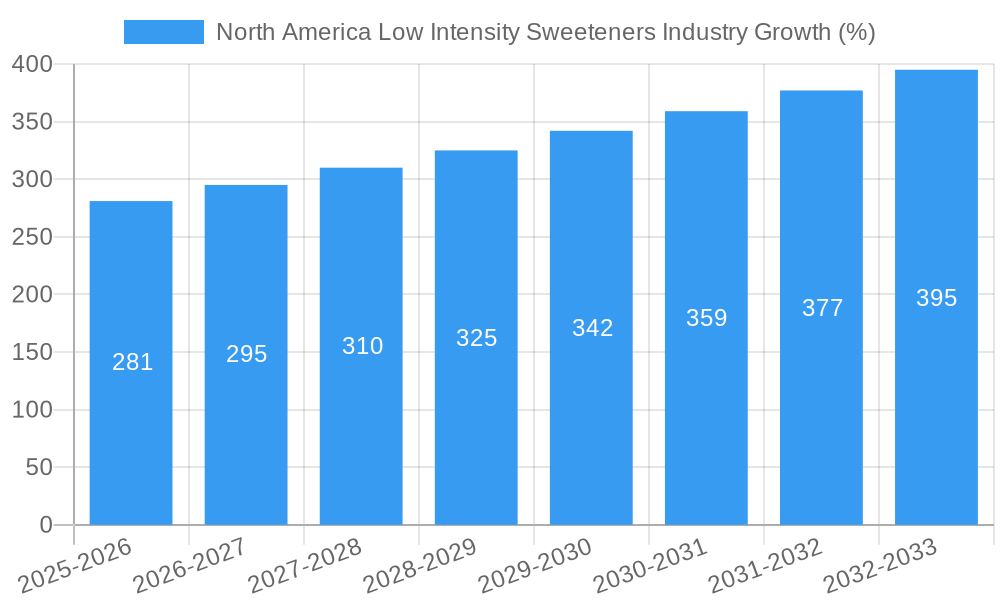
This growth trajectory, projected at a 5.62% CAGR from 2025 to 2033, is expected to significantly increase the market value. The United States, as the largest market within North America, will continue to dominate, driven by high per capita consumption of processed foods and beverages. While Canada and Mexico will also contribute significantly to the regional market, growth in these countries might be influenced by factors like economic conditions and evolving consumer preferences. The competitive landscape is marked by both large multinational corporations and smaller specialized companies, leading to intense competition and continuous innovation in product development and marketing strategies. Strategic partnerships and acquisitions will likely shape the industry's future, reinforcing the need for companies to maintain competitive advantages through product differentiation and efficient supply chains.
North America Low Intensity Sweeteners Industry Report: 2019-2033
This comprehensive report provides an in-depth analysis of the North America low intensity sweeteners market, offering invaluable insights for businesses, investors, and researchers. Covering the period from 2019 to 2033, with 2025 as the base year, this report meticulously examines market trends, competitive dynamics, and future growth potential. The market size in 2025 is estimated at xx Million, projected to reach xx Million by 2033, exhibiting a CAGR of xx% during the forecast period (2025-2033).
North America Low Intensity Sweeteners Industry Market Structure & Competitive Dynamics
This section analyzes the competitive landscape of the North American low-intensity sweeteners market. The market is characterized by a combination of large multinational corporations and specialized smaller players. Key players like Cargill Incorporated, Archer Daniels Midland Company, Tate & Lyle PLC, PureCircle, NutraSweet Co, Ingredion Incorporated, Ajinomoto Health & Nutrition North America Inc, and Koninklijke DSM N.V. dominate the market, holding a significant collective market share estimated at xx%. However, the presence of numerous smaller players creates a dynamic competitive environment. Market concentration is moderate, with the top 5 players controlling approximately xx% of the market.
Innovation plays a crucial role, with companies constantly investing in R&D to develop novel sweeteners and improve existing ones. Regulatory frameworks, particularly concerning labeling and health claims, significantly impact market dynamics. The rise of health-conscious consumers fuels demand for natural sweeteners, creating opportunities and challenges for companies. The market also faces competition from traditional high-intensity sweeteners. Mergers and acquisitions (M&A) are frequent, with recent deals significantly shaping the market landscape. For example, the acquisition of Steviva Ingredients by Cargill further consolidated the stevia segment. The total value of M&A activities in the sector during the historical period (2019-2024) is estimated at xx Million.
North America Low Intensity Sweeteners Industry Industry Trends & Insights
The North American low-intensity sweeteners market is experiencing robust growth driven by several key factors. The increasing prevalence of diabetes and obesity is a major driver, propelling consumer demand for healthier alternatives to sugar. Health-conscious consumers are increasingly choosing low-calorie and sugar-free options, boosting the market’s growth trajectory. The shift towards natural and plant-based sweeteners is another prominent trend. Technological advancements in sweetener production and formulation have led to improvements in taste, stability, and cost-effectiveness. The market is also witnessing significant product innovation, with new sweeteners like allulose and erythritol gaining popularity. The rising demand from the food and beverage industry significantly contributes to market growth, with applications spanning various products from soft drinks and confectionery to dairy and baked goods. Competitive dynamics remain intense, with companies focusing on product differentiation, branding, and strategic partnerships to gain a competitive edge. The market penetration of low-intensity sweeteners in various food and beverage categories is steadily increasing, estimated at xx% in 2025.
Dominant Markets & Segments in North America Low Intensity Sweeteners Industry
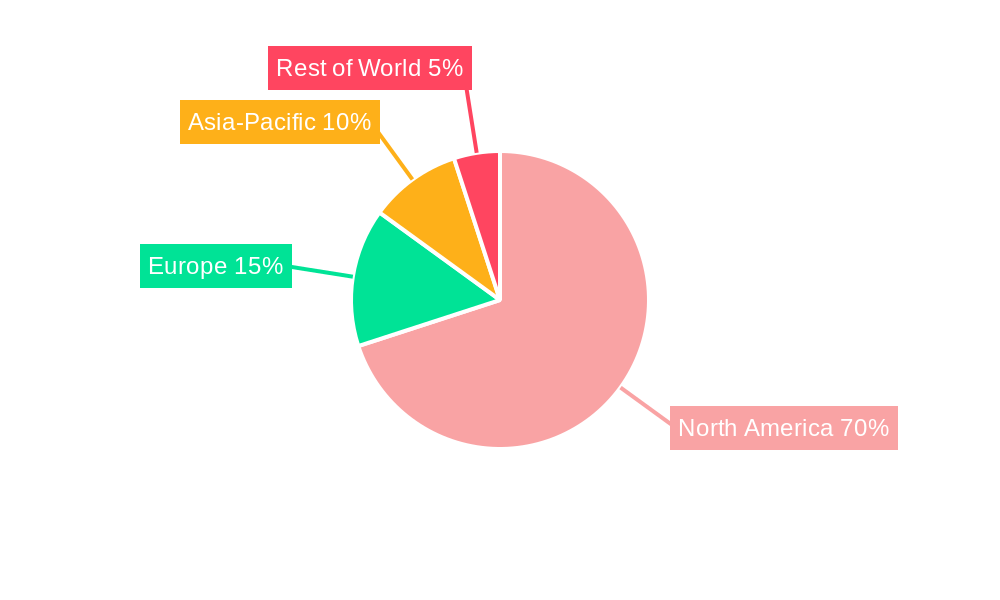
The United States is the dominant market in North America for low-intensity sweeteners, accounting for the largest share of market revenue due to its large population and high consumption of processed foods and beverages. Within the segments, stevia and sucralose are the leading types, driven by their natural origin (Stevia) and widespread adoption (Sucralose). The food and beverage industries are the primary application segments, contributing significantly to market growth.
- Key Drivers for the United States Market:
- Large and health-conscious consumer base.
- Well-established food and beverage industry.
- Favorable regulatory environment for low-calorie sweeteners.
- Robust infrastructure for distribution and supply chains.
The dominance of these segments is attributed to several factors, including:
- Stevia: Growing consumer preference for natural sweeteners and its favorable health perception.
- Sucralose: Widespread acceptance, excellent taste properties, and cost-effectiveness.
- Food & Beverage: High consumption of processed foods and beverages, offering ample application opportunities for low-intensity sweeteners.
North America Low Intensity Sweeteners Industry Product Innovations
Recent years have witnessed significant product innovations in the North American low-intensity sweeteners market. Companies are focusing on enhancing the taste profiles of existing sweeteners and developing new ones with improved functionalities. Technological advancements have led to the introduction of novel sweeteners like allulose and erythritol, which offer unique properties in terms of taste, texture, and health benefits. These innovations cater to the evolving consumer preferences for healthier and more natural options, and enhance the competitive landscape by offering diverse solutions to consumers and manufacturers.
Report Segmentation & Scope
The report segments the North America low-intensity sweeteners market based on source (natural and synthetic), type (sucralose, saccharin, aspartame, neotame, advantame, acesulfame potassium, stevia, and others), and application (food, beverage, pharmaceuticals, and others). Each segment's growth projections, market sizes, and competitive dynamics are analyzed in detail. For example, the natural sweetener segment is expected to exhibit a higher CAGR compared to the synthetic segment during the forecast period, driven by growing consumer demand for naturally derived products. The food and beverage application segment is projected to maintain its dominant position due to its widespread usage in processed foods and beverages.
Key Drivers of North America Low Intensity Sweeteners Industry Growth
Several key factors are driving the growth of the North American low-intensity sweeteners market. The rising prevalence of obesity and diabetes is a major catalyst, compelling consumers to adopt healthier alternatives to sugar. The growing consumer awareness of sugar's negative health implications fuels demand for low-calorie and sugar-free options. Favorable regulatory environments in some regions support market expansion. Furthermore, technological advancements in sweetener production and formulation are improving product quality, taste profiles, and affordability, further fueling market growth.
Challenges in the North America Low Intensity Sweeteners Industry Sector
The North American low-intensity sweeteners industry faces several challenges. Regulatory hurdles related to labeling and health claims create uncertainty and impact market access. Supply chain disruptions and fluctuations in raw material prices can affect profitability. Intense competition among established players and emerging new entrants necessitates continuous innovation and adaptation. Moreover, concerns regarding potential health effects of some artificial sweeteners pose a considerable challenge, affecting consumer perception and purchasing behavior. These factors could limit market growth and profitability if not effectively managed.
Leading Players in the North America Low Intensity Sweeteners Industry Market
- Cargill Incorporated
- Archer Daniels Midland Company
- Tate & Lyle PLC
- PureCircle
- NutraSweet Co
- Ingredion Incorporated
- Ajinomoto Health & Nutrition North America Inc
- Koninklijke DSM N.V.
- List Not Exhaustive
Key Developments in North America Low Intensity Sweeteners Industry Sector
- [Year/Month]: Cargill acquires Steviva Ingredients, a leading producer of stevia sweeteners, expanding its portfolio and market share in the natural sweetener segment.
- [Year/Month]: Tate & Lyle launches a new line of low-calorie sweeteners, including allulose and erythritol, diversifying its product offerings and catering to evolving consumer preferences.
- [Year/Month]: NutraSweet Co introduces a new aspartame-based sweetener with improved flavor and stability, enhancing its market competitiveness and consumer appeal. These developments significantly impact market dynamics by boosting innovation, expanding product portfolios, and strengthening market positions.
Strategic North America Low Intensity Sweeteners Industry Market Outlook
The North American low-intensity sweeteners market exhibits strong growth potential. Continued innovation in sweetener technology, a growing health-conscious consumer base, and expanding applications in various food and beverage categories will fuel market expansion. Strategic opportunities exist for companies to capitalize on these trends by investing in R&D, developing innovative products, and strengthening their market positions through mergers and acquisitions. Focusing on natural sweeteners and sustainability initiatives will be critical for long-term success in this dynamic market.
North America Low Intensity Sweeteners Industry Segmentation
-
1. Source
- 1.1. Natural
- 1.2. Synthetic
-
2. Type
- 2.1. Sucralose
- 2.2. Saccharin
- 2.3. Aspartame
- 2.4. Neotame
- 2.5. Advantam
- 2.6. Acesulfame Potassium
- 2.7. Stevia
- 2.8. Others
-
3. Application
-
3.1. Food
- 3.1.1. Dairy and Frozen Foods
- 3.1.2. Confectionery
- 3.1.3. Bakery
- 3.1.4. Others
- 3.2. Beverage
- 3.3. Pharmaceuticals
-
3.1. Food
-
4. Geography
- 4.1. United States
- 4.2. Canada
- 4.3. Mexico
- 4.4. Rest of North America
North America Low Intensity Sweeteners Industry Segmentation By Geography
- 1. United States
- 2. Canada
- 3. Mexico
- 4. Rest of North America
North America Low Intensity Sweeteners Industry REPORT HIGHLIGHTS
| Aspects | Details |
|---|---|
| Study Period | 2019-2033 |
| Base Year | 2024 |
| Estimated Year | 2025 |
| Forecast Period | 2025-2033 |
| Historical Period | 2019-2024 |
| Growth Rate | CAGR of 5.62% from 2019-2033 |
| Segmentation |
|
Table of Contents
- 1. Introduction
- 1.1. Research Scope
- 1.2. Market Segmentation
- 1.3. Research Methodology
- 1.4. Definitions and Assumptions
- 2. Executive Summary
- 2.1. Introduction
- 3. Market Dynamics
- 3.1. Introduction
- 3.2. Market Drivers
- 3.2.1. Augmented demand for Natural Sweeteners; Rising Consumer Inclination Toward Clean Label and Organic Stevia
- 3.3. Market Restrains
- 3.3.1. Side Effects and Challenges with Stevia
- 3.4. Market Trends
- 3.4.1. Aspartame Holds the Prominent Share of the Market
- 4. Market Factor Analysis
- 4.1. Porters Five Forces
- 4.2. Supply/Value Chain
- 4.3. PESTEL analysis
- 4.4. Market Entropy
- 4.5. Patent/Trademark Analysis
- 5. North America Low Intensity Sweeteners Industry Analysis, Insights and Forecast, 2019-2031
- 5.1. Market Analysis, Insights and Forecast - by Source
- 5.1.1. Natural
- 5.1.2. Synthetic
- 5.2. Market Analysis, Insights and Forecast - by Type
- 5.2.1. Sucralose
- 5.2.2. Saccharin
- 5.2.3. Aspartame
- 5.2.4. Neotame
- 5.2.5. Advantam
- 5.2.6. Acesulfame Potassium
- 5.2.7. Stevia
- 5.2.8. Others
- 5.3. Market Analysis, Insights and Forecast - by Application
- 5.3.1. Food
- 5.3.1.1. Dairy and Frozen Foods
- 5.3.1.2. Confectionery
- 5.3.1.3. Bakery
- 5.3.1.4. Others
- 5.3.2. Beverage
- 5.3.3. Pharmaceuticals
- 5.3.1. Food
- 5.4. Market Analysis, Insights and Forecast - by Geography
- 5.4.1. United States
- 5.4.2. Canada
- 5.4.3. Mexico
- 5.4.4. Rest of North America
- 5.5. Market Analysis, Insights and Forecast - by Region
- 5.5.1. United States
- 5.5.2. Canada
- 5.5.3. Mexico
- 5.5.4. Rest of North America
- 5.1. Market Analysis, Insights and Forecast - by Source
- 6. United States North America Low Intensity Sweeteners Industry Analysis, Insights and Forecast, 2019-2031
- 6.1. Market Analysis, Insights and Forecast - by Source
- 6.1.1. Natural
- 6.1.2. Synthetic
- 6.2. Market Analysis, Insights and Forecast - by Type
- 6.2.1. Sucralose
- 6.2.2. Saccharin
- 6.2.3. Aspartame
- 6.2.4. Neotame
- 6.2.5. Advantam
- 6.2.6. Acesulfame Potassium
- 6.2.7. Stevia
- 6.2.8. Others
- 6.3. Market Analysis, Insights and Forecast - by Application
- 6.3.1. Food
- 6.3.1.1. Dairy and Frozen Foods
- 6.3.1.2. Confectionery
- 6.3.1.3. Bakery
- 6.3.1.4. Others
- 6.3.2. Beverage
- 6.3.3. Pharmaceuticals
- 6.3.1. Food
- 6.4. Market Analysis, Insights and Forecast - by Geography
- 6.4.1. United States
- 6.4.2. Canada
- 6.4.3. Mexico
- 6.4.4. Rest of North America
- 6.1. Market Analysis, Insights and Forecast - by Source
- 7. Canada North America Low Intensity Sweeteners Industry Analysis, Insights and Forecast, 2019-2031
- 7.1. Market Analysis, Insights and Forecast - by Source
- 7.1.1. Natural
- 7.1.2. Synthetic
- 7.2. Market Analysis, Insights and Forecast - by Type
- 7.2.1. Sucralose
- 7.2.2. Saccharin
- 7.2.3. Aspartame
- 7.2.4. Neotame
- 7.2.5. Advantam
- 7.2.6. Acesulfame Potassium
- 7.2.7. Stevia
- 7.2.8. Others
- 7.3. Market Analysis, Insights and Forecast - by Application
- 7.3.1. Food
- 7.3.1.1. Dairy and Frozen Foods
- 7.3.1.2. Confectionery
- 7.3.1.3. Bakery
- 7.3.1.4. Others
- 7.3.2. Beverage
- 7.3.3. Pharmaceuticals
- 7.3.1. Food
- 7.4. Market Analysis, Insights and Forecast - by Geography
- 7.4.1. United States
- 7.4.2. Canada
- 7.4.3. Mexico
- 7.4.4. Rest of North America
- 7.1. Market Analysis, Insights and Forecast - by Source
- 8. Mexico North America Low Intensity Sweeteners Industry Analysis, Insights and Forecast, 2019-2031
- 8.1. Market Analysis, Insights and Forecast - by Source
- 8.1.1. Natural
- 8.1.2. Synthetic
- 8.2. Market Analysis, Insights and Forecast - by Type
- 8.2.1. Sucralose
- 8.2.2. Saccharin
- 8.2.3. Aspartame
- 8.2.4. Neotame
- 8.2.5. Advantam
- 8.2.6. Acesulfame Potassium
- 8.2.7. Stevia
- 8.2.8. Others
- 8.3. Market Analysis, Insights and Forecast - by Application
- 8.3.1. Food
- 8.3.1.1. Dairy and Frozen Foods
- 8.3.1.2. Confectionery
- 8.3.1.3. Bakery
- 8.3.1.4. Others
- 8.3.2. Beverage
- 8.3.3. Pharmaceuticals
- 8.3.1. Food
- 8.4. Market Analysis, Insights and Forecast - by Geography
- 8.4.1. United States
- 8.4.2. Canada
- 8.4.3. Mexico
- 8.4.4. Rest of North America
- 8.1. Market Analysis, Insights and Forecast - by Source
- 9. Rest of North America North America Low Intensity Sweeteners Industry Analysis, Insights and Forecast, 2019-2031
- 9.1. Market Analysis, Insights and Forecast - by Source
- 9.1.1. Natural
- 9.1.2. Synthetic
- 9.2. Market Analysis, Insights and Forecast - by Type
- 9.2.1. Sucralose
- 9.2.2. Saccharin
- 9.2.3. Aspartame
- 9.2.4. Neotame
- 9.2.5. Advantam
- 9.2.6. Acesulfame Potassium
- 9.2.7. Stevia
- 9.2.8. Others
- 9.3. Market Analysis, Insights and Forecast - by Application
- 9.3.1. Food
- 9.3.1.1. Dairy and Frozen Foods
- 9.3.1.2. Confectionery
- 9.3.1.3. Bakery
- 9.3.1.4. Others
- 9.3.2. Beverage
- 9.3.3. Pharmaceuticals
- 9.3.1. Food
- 9.4. Market Analysis, Insights and Forecast - by Geography
- 9.4.1. United States
- 9.4.2. Canada
- 9.4.3. Mexico
- 9.4.4. Rest of North America
- 9.1. Market Analysis, Insights and Forecast - by Source
- 10. United States North America Low Intensity Sweeteners Industry Analysis, Insights and Forecast, 2019-2031
- 11. Canada North America Low Intensity Sweeteners Industry Analysis, Insights and Forecast, 2019-2031
- 12. Mexico North America Low Intensity Sweeteners Industry Analysis, Insights and Forecast, 2019-2031
- 13. Rest of North America North America Low Intensity Sweeteners Industry Analysis, Insights and Forecast, 2019-2031
- 14. Competitive Analysis
- 14.1. Market Share Analysis 2024
- 14.2. Company Profiles
- 14.2.1 Cargill Incorporated
- 14.2.1.1. Overview
- 14.2.1.2. Products
- 14.2.1.3. SWOT Analysis
- 14.2.1.4. Recent Developments
- 14.2.1.5. Financials (Based on Availability)
- 14.2.2 Archer Daniels Midland Company
- 14.2.2.1. Overview
- 14.2.2.2. Products
- 14.2.2.3. SWOT Analysis
- 14.2.2.4. Recent Developments
- 14.2.2.5. Financials (Based on Availability)
- 14.2.3 Tate & Lyle PLC
- 14.2.3.1. Overview
- 14.2.3.2. Products
- 14.2.3.3. SWOT Analysis
- 14.2.3.4. Recent Developments
- 14.2.3.5. Financials (Based on Availability)
- 14.2.4 PureCircle
- 14.2.4.1. Overview
- 14.2.4.2. Products
- 14.2.4.3. SWOT Analysis
- 14.2.4.4. Recent Developments
- 14.2.4.5. Financials (Based on Availability)
- 14.2.5 NutraSweet Co
- 14.2.5.1. Overview
- 14.2.5.2. Products
- 14.2.5.3. SWOT Analysis
- 14.2.5.4. Recent Developments
- 14.2.5.5. Financials (Based on Availability)
- 14.2.6 Ingredion Incorporated
- 14.2.6.1. Overview
- 14.2.6.2. Products
- 14.2.6.3. SWOT Analysis
- 14.2.6.4. Recent Developments
- 14.2.6.5. Financials (Based on Availability)
- 14.2.7 Ajinomoto Health & Nutrition North America Inc
- 14.2.7.1. Overview
- 14.2.7.2. Products
- 14.2.7.3. SWOT Analysis
- 14.2.7.4. Recent Developments
- 14.2.7.5. Financials (Based on Availability)
- 14.2.8 Koninklijke DSM N V *List Not Exhaustive
- 14.2.8.1. Overview
- 14.2.8.2. Products
- 14.2.8.3. SWOT Analysis
- 14.2.8.4. Recent Developments
- 14.2.8.5. Financials (Based on Availability)
- 14.2.1 Cargill Incorporated
List of Figures
- Figure 1: North America Low Intensity Sweeteners Industry Revenue Breakdown (Million, %) by Product 2024 & 2032
- Figure 2: North America Low Intensity Sweeteners Industry Share (%) by Company 2024
List of Tables
- Table 1: North America Low Intensity Sweeteners Industry Revenue Million Forecast, by Region 2019 & 2032
- Table 2: North America Low Intensity Sweeteners Industry Revenue Million Forecast, by Source 2019 & 2032
- Table 3: North America Low Intensity Sweeteners Industry Revenue Million Forecast, by Type 2019 & 2032
- Table 4: North America Low Intensity Sweeteners Industry Revenue Million Forecast, by Application 2019 & 2032
- Table 5: North America Low Intensity Sweeteners Industry Revenue Million Forecast, by Geography 2019 & 2032
- Table 6: North America Low Intensity Sweeteners Industry Revenue Million Forecast, by Region 2019 & 2032
- Table 7: North America Low Intensity Sweeteners Industry Revenue Million Forecast, by Country 2019 & 2032
- Table 8: United States North America Low Intensity Sweeteners Industry Revenue (Million) Forecast, by Application 2019 & 2032
- Table 9: Canada North America Low Intensity Sweeteners Industry Revenue (Million) Forecast, by Application 2019 & 2032
- Table 10: Mexico North America Low Intensity Sweeteners Industry Revenue (Million) Forecast, by Application 2019 & 2032
- Table 11: Rest of North America North America Low Intensity Sweeteners Industry Revenue (Million) Forecast, by Application 2019 & 2032
- Table 12: North America Low Intensity Sweeteners Industry Revenue Million Forecast, by Source 2019 & 2032
- Table 13: North America Low Intensity Sweeteners Industry Revenue Million Forecast, by Type 2019 & 2032
- Table 14: North America Low Intensity Sweeteners Industry Revenue Million Forecast, by Application 2019 & 2032
- Table 15: North America Low Intensity Sweeteners Industry Revenue Million Forecast, by Geography 2019 & 2032
- Table 16: North America Low Intensity Sweeteners Industry Revenue Million Forecast, by Country 2019 & 2032
- Table 17: North America Low Intensity Sweeteners Industry Revenue Million Forecast, by Source 2019 & 2032
- Table 18: North America Low Intensity Sweeteners Industry Revenue Million Forecast, by Type 2019 & 2032
- Table 19: North America Low Intensity Sweeteners Industry Revenue Million Forecast, by Application 2019 & 2032
- Table 20: North America Low Intensity Sweeteners Industry Revenue Million Forecast, by Geography 2019 & 2032
- Table 21: North America Low Intensity Sweeteners Industry Revenue Million Forecast, by Country 2019 & 2032
- Table 22: North America Low Intensity Sweeteners Industry Revenue Million Forecast, by Source 2019 & 2032
- Table 23: North America Low Intensity Sweeteners Industry Revenue Million Forecast, by Type 2019 & 2032
- Table 24: North America Low Intensity Sweeteners Industry Revenue Million Forecast, by Application 2019 & 2032
- Table 25: North America Low Intensity Sweeteners Industry Revenue Million Forecast, by Geography 2019 & 2032
- Table 26: North America Low Intensity Sweeteners Industry Revenue Million Forecast, by Country 2019 & 2032
- Table 27: North America Low Intensity Sweeteners Industry Revenue Million Forecast, by Source 2019 & 2032
- Table 28: North America Low Intensity Sweeteners Industry Revenue Million Forecast, by Type 2019 & 2032
- Table 29: North America Low Intensity Sweeteners Industry Revenue Million Forecast, by Application 2019 & 2032
- Table 30: North America Low Intensity Sweeteners Industry Revenue Million Forecast, by Geography 2019 & 2032
- Table 31: North America Low Intensity Sweeteners Industry Revenue Million Forecast, by Country 2019 & 2032
Frequently Asked Questions
1. What is the projected Compound Annual Growth Rate (CAGR) of the North America Low Intensity Sweeteners Industry?
The projected CAGR is approximately 5.62%.
2. Which companies are prominent players in the North America Low Intensity Sweeteners Industry?
Key companies in the market include Cargill Incorporated, Archer Daniels Midland Company, Tate & Lyle PLC, PureCircle, NutraSweet Co, Ingredion Incorporated, Ajinomoto Health & Nutrition North America Inc, Koninklijke DSM N V *List Not Exhaustive.
3. What are the main segments of the North America Low Intensity Sweeteners Industry?
The market segments include Source, Type, Application, Geography.
4. Can you provide details about the market size?
The market size is estimated to be USD XX Million as of 2022.
5. What are some drivers contributing to market growth?
Augmented demand for Natural Sweeteners; Rising Consumer Inclination Toward Clean Label and Organic Stevia.
6. What are the notable trends driving market growth?
Aspartame Holds the Prominent Share of the Market.
7. Are there any restraints impacting market growth?
Side Effects and Challenges with Stevia.
8. Can you provide examples of recent developments in the market?
1. Cargill acquires Steviva Ingredients, a leading producer of stevia sweeteners. 2. Tate & Lyle launches a new line of low-calorie sweeteners, including allulose and erythritol. 3. NutraSweet Co introduces a new aspartame-based sweetener with improved flavor and stability.
9. What pricing options are available for accessing the report?
Pricing options include single-user, multi-user, and enterprise licenses priced at USD 4750, USD 5250, and USD 8750 respectively.
10. Is the market size provided in terms of value or volume?
The market size is provided in terms of value, measured in Million.
11. Are there any specific market keywords associated with the report?
Yes, the market keyword associated with the report is "North America Low Intensity Sweeteners Industry," which aids in identifying and referencing the specific market segment covered.
12. How do I determine which pricing option suits my needs best?
The pricing options vary based on user requirements and access needs. Individual users may opt for single-user licenses, while businesses requiring broader access may choose multi-user or enterprise licenses for cost-effective access to the report.
13. Are there any additional resources or data provided in the North America Low Intensity Sweeteners Industry report?
While the report offers comprehensive insights, it's advisable to review the specific contents or supplementary materials provided to ascertain if additional resources or data are available.
14. How can I stay updated on further developments or reports in the North America Low Intensity Sweeteners Industry?
To stay informed about further developments, trends, and reports in the North America Low Intensity Sweeteners Industry, consider subscribing to industry newsletters, following relevant companies and organizations, or regularly checking reputable industry news sources and publications.
Methodology
Step 1 - Identification of Relevant Samples Size from Population Database


Step 2 - Approaches for Defining Global Market Size (Value, Volume* & Price*)

Note*: In applicable scenarios
Step 3 - Data Sources
Primary Research
- Web Analytics
- Survey Reports
- Research Institute
- Latest Research Reports
- Opinion Leaders
Secondary Research
- Annual Reports
- White Paper
- Latest Press Release
- Industry Association
- Paid Database
- Investor Presentations

Step 4 - Data Triangulation
Involves using different sources of information in order to increase the validity of a study
These sources are likely to be stakeholders in a program - participants, other researchers, program staff, other community members, and so on.
Then we put all data in single framework & apply various statistical tools to find out the dynamic on the market.
During the analysis stage, feedback from the stakeholder groups would be compared to determine areas of agreement as well as areas of divergence


