
Key Insights
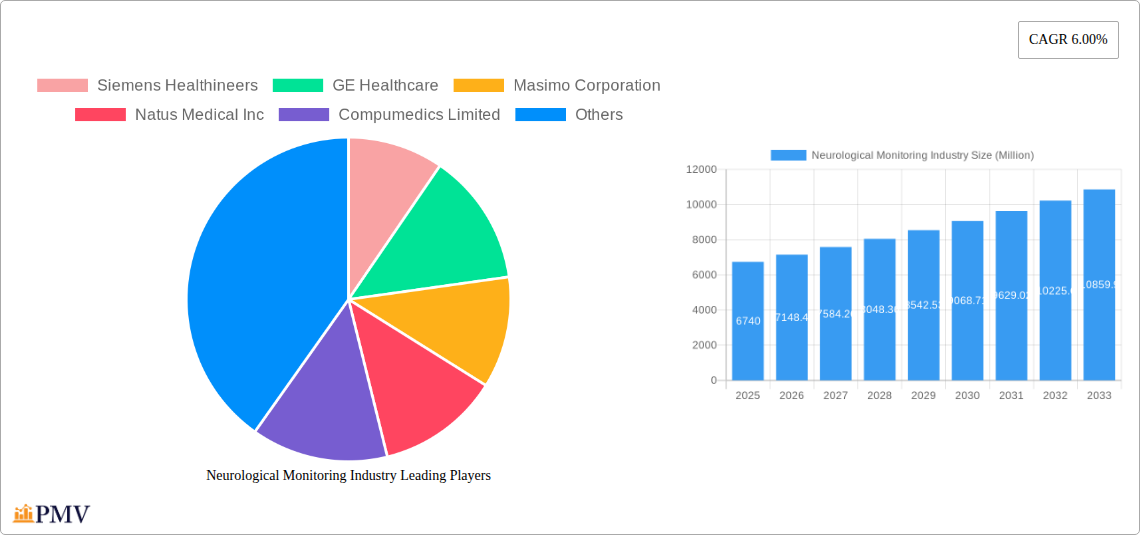
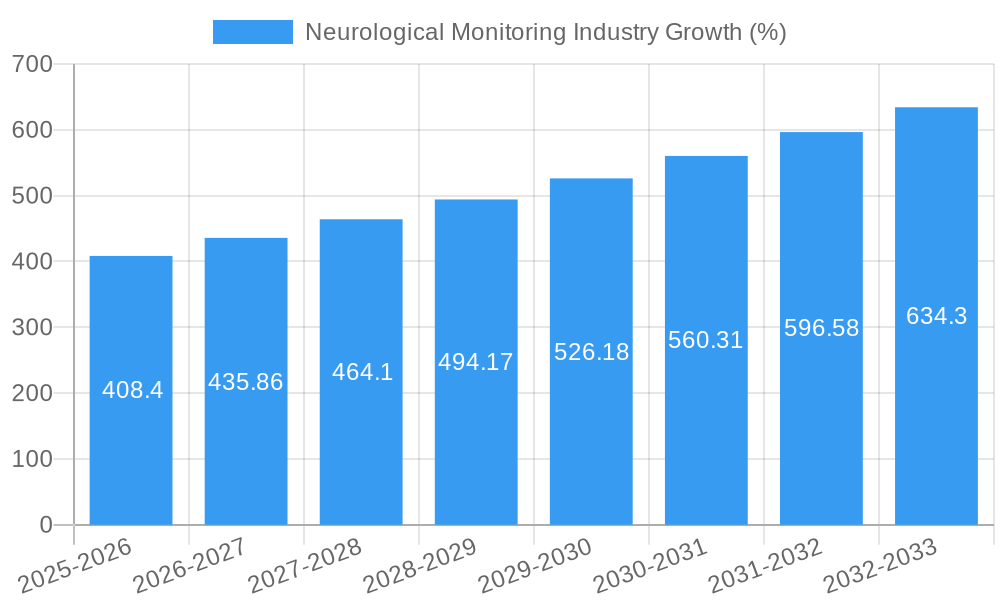
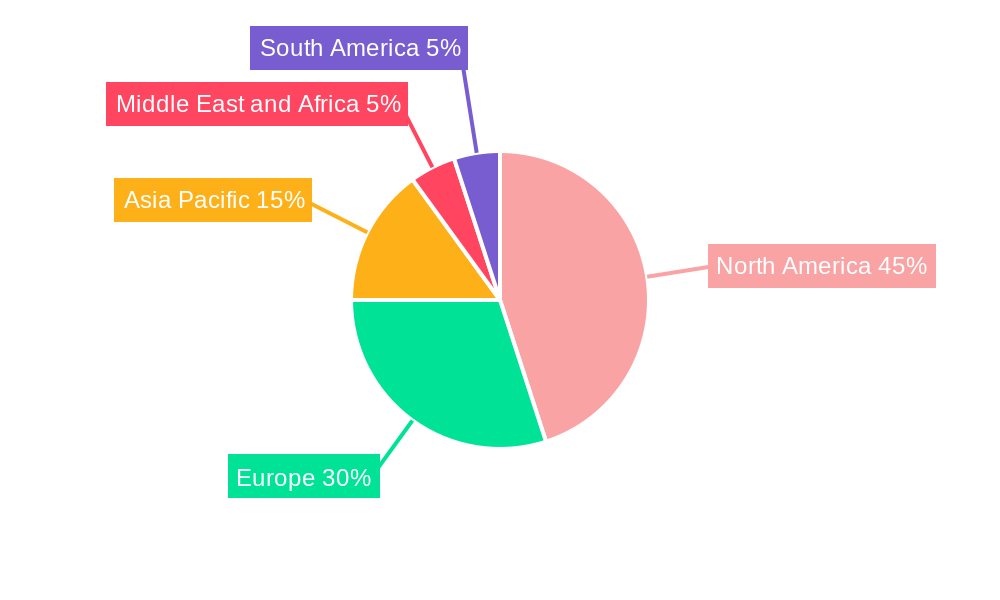
The neurological monitoring market, valued at $6.74 billion in 2025, is experiencing robust growth, projected to expand at a compound annual growth rate (CAGR) of 6.00% from 2025 to 2033. This growth is fueled by several key factors. Increasing prevalence of neurological disorders like stroke, traumatic brain injury (TBI), and epilepsy, coupled with an aging global population, significantly boosts demand for advanced monitoring technologies. Technological advancements, such as the development of miniaturized, wireless devices and improved data analytics capabilities, are enhancing the accuracy and efficiency of neurological monitoring, further driving market expansion. Furthermore, rising healthcare expenditure and increasing awareness about early diagnosis and treatment of neurological conditions contribute to market growth. The market is segmented by product type (MRI, EEG devices, cerebral oximeters, intracranial pressure monitors, and others) and disease type (TBI, stroke, sleep disorders, Parkinson's disease, epilepsy, and others), offering diverse opportunities for market players. North America currently holds a significant market share due to advanced healthcare infrastructure and high adoption rates of technologically advanced devices. However, Asia Pacific is poised for significant growth owing to increasing healthcare investment and rising prevalence of neurological disorders in developing economies.
The competitive landscape is characterized by the presence of both established multinational corporations like Siemens Healthineers, GE Healthcare, and Medtronic, and smaller specialized companies focusing on niche technologies. The market is witnessing increased mergers and acquisitions as larger companies aim to expand their product portfolios and geographic reach. Despite the positive outlook, certain challenges exist, including high costs associated with advanced technologies, stringent regulatory approvals, and potential reimbursement issues. However, continuous innovation and strategic partnerships are expected to mitigate these challenges and support sustained market growth throughout the forecast period. The development of integrated monitoring systems that combine multiple modalities and provide real-time data analysis is a significant trend that will shape the future of the neurological monitoring market.
Neurological Monitoring Industry Market Report: 2019-2033
This comprehensive report provides an in-depth analysis of the Neurological Monitoring market, projecting a robust growth trajectory from 2019 to 2033. The report segments the market by product type (Magnetic Resonance Imaging (MRI) Devices, Electroencephalography (EEG) devices, Cerebral Oximeters, Intracranial Pressure Monitors, and Other Product Types) and disease type (Traumatic Brain Injury (TBI), Stroke, Sleep Disorders, Parkinson's Disease, Epilepsy, and Other Disease Types). It covers key market players, including Siemens Healthineers, GE Healthcare, Masimo Corporation, Natus Medical Inc, Compumedics Limited, Drägerwerk AG & Co. KGaA, Philips Healthcare, Medtronic PLC, Advanced Brain Monitoring Inc, and Nihon Kohden Corporation, providing crucial insights for strategic decision-making. The report is based on extensive research, leveraging historical data (2019-2024), with a base year of 2025 and a forecast period extending to 2033. The estimated market size in 2025 is projected to be xx Million USD.
Neurological Monitoring Industry Market Structure & Competitive Dynamics
The neurological monitoring market exhibits a moderately concentrated structure, with a handful of multinational corporations holding significant market share. Siemens Healthineers, GE Healthcare, and Philips Healthcare are among the dominant players, benefiting from established brand recognition, extensive distribution networks, and a diverse product portfolio. However, smaller specialized companies, such as Natus Medical Inc and Advanced Brain Monitoring Inc, are also making inroads, particularly in niche segments. The industry witnesses continuous innovation, driven by advancements in sensor technology, data analytics, and artificial intelligence. Regulatory frameworks, such as those governing medical device approvals (e.g., FDA in the US, CE marking in Europe), significantly impact market entry and product lifecycle. Product substitutes, like conventional neurological examinations, pose a competitive pressure, albeit limited due to the superiority of objective monitoring data provided by advanced devices. M&A activity within the sector has been relatively moderate in recent years, with deal values generally in the range of xx Million USD to xx Million USD, driven primarily by a desire for technological expansion or market consolidation. End-user trends increasingly favor minimally invasive, portable, and user-friendly monitoring systems that facilitate remote patient monitoring and data integration with Electronic Health Records (EHRs).
- Market Concentration: Moderately concentrated, with top 5 players holding approximately xx% market share.
- Innovation Ecosystem: Strong, driven by technological advancements in sensor technology, AI, and data analytics.
- Regulatory Landscape: Stringent regulatory pathways (FDA, CE Marking) govern market entry.
- M&A Activity: Moderate, with average deal values ranging from xx Million USD to xx Million USD.
Neurological Monitoring Industry Trends & Insights
The neurological monitoring market is experiencing robust growth, driven by several key factors. An aging global population, leading to a higher prevalence of neurological disorders like stroke, TBI, and Parkinson's disease, is a major contributing factor. Technological advancements, such as miniaturization of sensors, improved data processing capabilities, and the integration of AI for diagnostic support, are driving the adoption of advanced monitoring technologies. The increasing focus on early diagnosis and proactive treatment of neurological conditions fuels market expansion. Rising healthcare expenditure and growing investment in healthcare infrastructure, particularly in developing economies, further stimulate market growth. The market also benefits from rising consumer awareness regarding neurological health and improved access to advanced diagnostic and treatment options. The Compound Annual Growth Rate (CAGR) for the forecast period (2025-2033) is projected to be approximately xx%. Market penetration of advanced monitoring systems varies by region and disease type, with higher penetration observed in developed economies and for conditions like stroke and TBI. Competitive dynamics are characterized by intense competition among major players and continuous innovation to enhance product offerings and secure market share.
Dominant Markets & Segments in Neurological Monitoring Industry
The North American region currently holds the largest market share in the neurological monitoring industry due to factors such as high healthcare expenditure, advanced healthcare infrastructure, and a significant prevalence of neurological diseases. Within product types, EEG devices and Intracranial Pressure Monitors represent significant market segments, driven by their extensive use in critical care settings and neurological diagnostic procedures. Among disease types, TBI and stroke account for substantial market shares due to high incidence rates and the critical need for continuous monitoring.
Key Drivers for North America:
- High healthcare expenditure
- Advanced healthcare infrastructure
- High prevalence of neurological disorders
- Favorable regulatory environment
- Strong focus on research and development
Dominant Product Segments:
- EEG Devices: Driven by growing demand in intensive care units and epilepsy monitoring.
- Intracranial Pressure Monitors: Crucial for managing traumatic brain injuries and other critical neurological conditions.
Dominant Disease Segments:
- Traumatic Brain Injury (TBI): Significant market share due to high incidence and demand for comprehensive monitoring.
- Stroke: High incidence and acute care requirements contribute to substantial market demand.
The European market also holds a substantial share, driven by similar factors to North America. Asia Pacific, although currently exhibiting a lower market share, presents strong growth potential due to rising healthcare investments and increasing prevalence of neurological disorders.
Neurological Monitoring Industry Product Innovations
Recent product innovations focus on non-invasive monitoring techniques, wireless capabilities, improved data analysis features, and enhanced portability. For example, the development of advanced algorithms for interpreting EEG signals and the integration of AI for automated diagnostics are improving the accuracy and efficiency of neurological monitoring. These innovations aim to improve patient outcomes, reduce healthcare costs, and enable better remote patient management. Smaller, more comfortable devices are also emerging to enhance patient compliance and comfort. The market is seeing a move towards integrated platforms that combine multiple monitoring modalities, enabling comprehensive data analysis and efficient clinical workflows.
Report Segmentation & Scope
The report segments the neurological monitoring market by product type, encompassing Magnetic Resonance Imaging (MRI) devices, Electroencephalography (EEG) devices, Cerebral Oximeters, Intracranial Pressure Monitors, and Other Product Types. Each segment is analyzed for its growth prospects, market size, and competitive landscape. Similarly, the market is segmented by disease type, including Traumatic Brain Injury (TBI), Stroke, Sleep Disorders, Parkinson's Disease, Epilepsy, and Other Disease Types. Each disease-specific segment is characterized by its unique monitoring requirements, influencing the types of devices used and the market dynamics. Growth projections for each segment are based on the current market trends, technological advancements, and anticipated changes in healthcare policies.
Key Drivers of Neurological Monitoring Industry Growth
Several key factors drive the growth of the neurological monitoring industry. The increasing prevalence of neurological disorders due to an aging population is a primary driver. Advancements in medical technology, leading to the development of more sophisticated and user-friendly monitoring devices, are also contributing significantly. Growing healthcare expenditure globally, coupled with an increased focus on early diagnosis and treatment, further fuels market expansion. Stringent regulations aimed at improving patient safety and device efficacy are also influencing market growth by encouraging the development and adoption of advanced monitoring systems.
Challenges in the Neurological Monitoring Industry Sector
Despite significant growth potential, the neurological monitoring industry faces several challenges. Stringent regulatory hurdles and lengthy approval processes increase the cost and time required for product launches. Supply chain disruptions, particularly affecting the availability of critical components, can impact production and lead times. Furthermore, intense competition among established players and emerging companies creates price pressure and necessitates continuous innovation to maintain market share. The high cost of advanced monitoring systems can limit accessibility in resource-constrained settings. Reimbursement policies and insurance coverage can also influence market adoption.
Leading Players in the Neurological Monitoring Industry Market
- Siemens Healthineers
- GE Healthcare
- Masimo Corporation
- Natus Medical Inc
- Compumedics Limited
- Drägerwerk AG & Co. KGaA
- Philips Healthcare
- Medtronic PLC
- Advanced Brain Monitoring Inc
- Nihon Kohden Corporation
Key Developments in Neurological Monitoring Industry Sector
- March 2022: Braintale launched the brainTale-care platform, incorporating modules like brainQuant (white matter quantification) and brainScore-coma (coma recovery prediction). This launch signifies a move towards AI-powered diagnostic tools within the sector.
- February 2023: The SafeICP project, funded by the Spanish Research Agency and European Next Generation funds, aims to develop a low-cost, user-friendly, non-invasive intracranial pressure monitor for bedside use. This development addresses the need for accessible and affordable monitoring solutions.
Strategic Neurological Monitoring Industry Market Outlook
The neurological monitoring market is poised for continued growth, driven by technological advancements, rising prevalence of neurological disorders, and increasing healthcare spending. Strategic opportunities lie in developing innovative, cost-effective monitoring solutions, expanding into emerging markets, and focusing on personalized medicine approaches. The integration of AI and machine learning is expected to transform diagnostic capabilities and improve patient outcomes. Companies that can successfully navigate regulatory hurdles, optimize supply chains, and offer comprehensive monitoring solutions will be well-positioned to capture significant market share in the years to come.
Neurological Monitoring Industry Segmentation
-
1. Product Type
- 1.1. Magnetic Resonance Imaging (MRI) Devices
- 1.2. Electroencephalography devices
- 1.3. Cerebral Oximeters
- 1.4. Intracranial Pressure Monitors
- 1.5. Other Product Types
-
2. Disease Type
- 2.1. Traumatic Brain Injury (TBI)
- 2.2. Stroke
- 2.3. Sleep Disorders
- 2.4. Parkinson's Disease
- 2.5. Epilepsy
- 2.6. Other Disease Types
Neurological Monitoring Industry Segmentation By Geography
-
1. North America
- 1.1. United States
- 1.2. Canada
- 1.3. Mexico
-
2. Europe
- 2.1. Germany
- 2.2. United Kingdom
- 2.3. France
- 2.4. Italy
- 2.5. Spain
- 2.6. Rest of Europe
-
3. Asia Pacific
- 3.1. China
- 3.2. Japan
- 3.3. India
- 3.4. Australia
- 3.5. South Korea
- 3.6. Rest of Asia Pacific
-
4. Middle East and Africa
- 4.1. GCC
- 4.2. South Africa
- 4.3. Rest of Middle East and Africa
-
5. South America
- 5.1. Brazil
- 5.2. Argentina
- 5.3. Rest of South America
Neurological Monitoring Industry REPORT HIGHLIGHTS
| Aspects | Details |
|---|---|
| Study Period | 2019-2033 |
| Base Year | 2024 |
| Estimated Year | 2025 |
| Forecast Period | 2025-2033 |
| Historical Period | 2019-2024 |
| Growth Rate | CAGR of 6.00% from 2019-2033 |
| Segmentation |
|
Table of Contents
- 1. Introduction
- 1.1. Research Scope
- 1.2. Market Segmentation
- 1.3. Research Methodology
- 1.4. Definitions and Assumptions
- 2. Executive Summary
- 2.1. Introduction
- 3. Market Dynamics
- 3.1. Introduction
- 3.2. Market Drivers
- 3.2.1. Increasing Burden of Neurological Disorders; Growing Incidence of Traumatic Brain Injuries; Increasing Number of Product Approvals
- 3.3. Market Restrains
- 3.3.1. High Cost of Monitoring Devices; Shortage of Trained Professionals
- 3.4. Market Trends
- 3.4.1. Sleep Disorder is Expected to Witness Strong Growth Over the Forecast Period
- 4. Market Factor Analysis
- 4.1. Porters Five Forces
- 4.2. Supply/Value Chain
- 4.3. PESTEL analysis
- 4.4. Market Entropy
- 4.5. Patent/Trademark Analysis
- 5. Global Neurological Monitoring Industry Analysis, Insights and Forecast, 2019-2031
- 5.1. Market Analysis, Insights and Forecast - by Product Type
- 5.1.1. Magnetic Resonance Imaging (MRI) Devices
- 5.1.2. Electroencephalography devices
- 5.1.3. Cerebral Oximeters
- 5.1.4. Intracranial Pressure Monitors
- 5.1.5. Other Product Types
- 5.2. Market Analysis, Insights and Forecast - by Disease Type
- 5.2.1. Traumatic Brain Injury (TBI)
- 5.2.2. Stroke
- 5.2.3. Sleep Disorders
- 5.2.4. Parkinson's Disease
- 5.2.5. Epilepsy
- 5.2.6. Other Disease Types
- 5.3. Market Analysis, Insights and Forecast - by Region
- 5.3.1. North America
- 5.3.2. Europe
- 5.3.3. Asia Pacific
- 5.3.4. Middle East and Africa
- 5.3.5. South America
- 5.1. Market Analysis, Insights and Forecast - by Product Type
- 6. North America Neurological Monitoring Industry Analysis, Insights and Forecast, 2019-2031
- 6.1. Market Analysis, Insights and Forecast - by Product Type
- 6.1.1. Magnetic Resonance Imaging (MRI) Devices
- 6.1.2. Electroencephalography devices
- 6.1.3. Cerebral Oximeters
- 6.1.4. Intracranial Pressure Monitors
- 6.1.5. Other Product Types
- 6.2. Market Analysis, Insights and Forecast - by Disease Type
- 6.2.1. Traumatic Brain Injury (TBI)
- 6.2.2. Stroke
- 6.2.3. Sleep Disorders
- 6.2.4. Parkinson's Disease
- 6.2.5. Epilepsy
- 6.2.6. Other Disease Types
- 6.1. Market Analysis, Insights and Forecast - by Product Type
- 7. Europe Neurological Monitoring Industry Analysis, Insights and Forecast, 2019-2031
- 7.1. Market Analysis, Insights and Forecast - by Product Type
- 7.1.1. Magnetic Resonance Imaging (MRI) Devices
- 7.1.2. Electroencephalography devices
- 7.1.3. Cerebral Oximeters
- 7.1.4. Intracranial Pressure Monitors
- 7.1.5. Other Product Types
- 7.2. Market Analysis, Insights and Forecast - by Disease Type
- 7.2.1. Traumatic Brain Injury (TBI)
- 7.2.2. Stroke
- 7.2.3. Sleep Disorders
- 7.2.4. Parkinson's Disease
- 7.2.5. Epilepsy
- 7.2.6. Other Disease Types
- 7.1. Market Analysis, Insights and Forecast - by Product Type
- 8. Asia Pacific Neurological Monitoring Industry Analysis, Insights and Forecast, 2019-2031
- 8.1. Market Analysis, Insights and Forecast - by Product Type
- 8.1.1. Magnetic Resonance Imaging (MRI) Devices
- 8.1.2. Electroencephalography devices
- 8.1.3. Cerebral Oximeters
- 8.1.4. Intracranial Pressure Monitors
- 8.1.5. Other Product Types
- 8.2. Market Analysis, Insights and Forecast - by Disease Type
- 8.2.1. Traumatic Brain Injury (TBI)
- 8.2.2. Stroke
- 8.2.3. Sleep Disorders
- 8.2.4. Parkinson's Disease
- 8.2.5. Epilepsy
- 8.2.6. Other Disease Types
- 8.1. Market Analysis, Insights and Forecast - by Product Type
- 9. Middle East and Africa Neurological Monitoring Industry Analysis, Insights and Forecast, 2019-2031
- 9.1. Market Analysis, Insights and Forecast - by Product Type
- 9.1.1. Magnetic Resonance Imaging (MRI) Devices
- 9.1.2. Electroencephalography devices
- 9.1.3. Cerebral Oximeters
- 9.1.4. Intracranial Pressure Monitors
- 9.1.5. Other Product Types
- 9.2. Market Analysis, Insights and Forecast - by Disease Type
- 9.2.1. Traumatic Brain Injury (TBI)
- 9.2.2. Stroke
- 9.2.3. Sleep Disorders
- 9.2.4. Parkinson's Disease
- 9.2.5. Epilepsy
- 9.2.6. Other Disease Types
- 9.1. Market Analysis, Insights and Forecast - by Product Type
- 10. South America Neurological Monitoring Industry Analysis, Insights and Forecast, 2019-2031
- 10.1. Market Analysis, Insights and Forecast - by Product Type
- 10.1.1. Magnetic Resonance Imaging (MRI) Devices
- 10.1.2. Electroencephalography devices
- 10.1.3. Cerebral Oximeters
- 10.1.4. Intracranial Pressure Monitors
- 10.1.5. Other Product Types
- 10.2. Market Analysis, Insights and Forecast - by Disease Type
- 10.2.1. Traumatic Brain Injury (TBI)
- 10.2.2. Stroke
- 10.2.3. Sleep Disorders
- 10.2.4. Parkinson's Disease
- 10.2.5. Epilepsy
- 10.2.6. Other Disease Types
- 10.1. Market Analysis, Insights and Forecast - by Product Type
- 11. North America Neurological Monitoring Industry Analysis, Insights and Forecast, 2019-2031
- 11.1. Market Analysis, Insights and Forecast - By Country/Sub-region
- 11.1.1 United States
- 11.1.2 Canada
- 11.1.3 Mexico
- 12. Europe Neurological Monitoring Industry Analysis, Insights and Forecast, 2019-2031
- 12.1. Market Analysis, Insights and Forecast - By Country/Sub-region
- 12.1.1 Germany
- 12.1.2 United Kingdom
- 12.1.3 France
- 12.1.4 Italy
- 12.1.5 Spain
- 12.1.6 Rest of Europe
- 13. Asia Pacific Neurological Monitoring Industry Analysis, Insights and Forecast, 2019-2031
- 13.1. Market Analysis, Insights and Forecast - By Country/Sub-region
- 13.1.1 China
- 13.1.2 Japan
- 13.1.3 India
- 13.1.4 Australia
- 13.1.5 South Korea
- 13.1.6 Rest of Asia Pacific
- 14. Middle East and Africa Neurological Monitoring Industry Analysis, Insights and Forecast, 2019-2031
- 14.1. Market Analysis, Insights and Forecast - By Country/Sub-region
- 14.1.1 GCC
- 14.1.2 South Africa
- 14.1.3 Rest of Middle East and Africa
- 15. South America Neurological Monitoring Industry Analysis, Insights and Forecast, 2019-2031
- 15.1. Market Analysis, Insights and Forecast - By Country/Sub-region
- 15.1.1 Brazil
- 15.1.2 Argentina
- 15.1.3 Rest of South America
- 16. Competitive Analysis
- 16.1. Global Market Share Analysis 2024
- 16.2. Company Profiles
- 16.2.1 Siemens Healthineers
- 16.2.1.1. Overview
- 16.2.1.2. Products
- 16.2.1.3. SWOT Analysis
- 16.2.1.4. Recent Developments
- 16.2.1.5. Financials (Based on Availability)
- 16.2.2 GE Healthcare
- 16.2.2.1. Overview
- 16.2.2.2. Products
- 16.2.2.3. SWOT Analysis
- 16.2.2.4. Recent Developments
- 16.2.2.5. Financials (Based on Availability)
- 16.2.3 Masimo Corporation
- 16.2.3.1. Overview
- 16.2.3.2. Products
- 16.2.3.3. SWOT Analysis
- 16.2.3.4. Recent Developments
- 16.2.3.5. Financials (Based on Availability)
- 16.2.4 Natus Medical Inc
- 16.2.4.1. Overview
- 16.2.4.2. Products
- 16.2.4.3. SWOT Analysis
- 16.2.4.4. Recent Developments
- 16.2.4.5. Financials (Based on Availability)
- 16.2.5 Compumedics Limited
- 16.2.5.1. Overview
- 16.2.5.2. Products
- 16.2.5.3. SWOT Analysis
- 16.2.5.4. Recent Developments
- 16.2.5.5. Financials (Based on Availability)
- 16.2.6 Dragerwerk Ag & Co KGaA
- 16.2.6.1. Overview
- 16.2.6.2. Products
- 16.2.6.3. SWOT Analysis
- 16.2.6.4. Recent Developments
- 16.2.6.5. Financials (Based on Availability)
- 16.2.7 Philips Healthcare
- 16.2.7.1. Overview
- 16.2.7.2. Products
- 16.2.7.3. SWOT Analysis
- 16.2.7.4. Recent Developments
- 16.2.7.5. Financials (Based on Availability)
- 16.2.8 Medtronic PLC
- 16.2.8.1. Overview
- 16.2.8.2. Products
- 16.2.8.3. SWOT Analysis
- 16.2.8.4. Recent Developments
- 16.2.8.5. Financials (Based on Availability)
- 16.2.9 Advanced Brain Monitoring Inc
- 16.2.9.1. Overview
- 16.2.9.2. Products
- 16.2.9.3. SWOT Analysis
- 16.2.9.4. Recent Developments
- 16.2.9.5. Financials (Based on Availability)
- 16.2.10 Nihon Kohden Corporation
- 16.2.10.1. Overview
- 16.2.10.2. Products
- 16.2.10.3. SWOT Analysis
- 16.2.10.4. Recent Developments
- 16.2.10.5. Financials (Based on Availability)
- 16.2.1 Siemens Healthineers
List of Figures
- Figure 1: Global Neurological Monitoring Industry Revenue Breakdown (Million, %) by Region 2024 & 2032
- Figure 2: Global Neurological Monitoring Industry Volume Breakdown (K Unit, %) by Region 2024 & 2032
- Figure 3: North America Neurological Monitoring Industry Revenue (Million), by Country 2024 & 2032
- Figure 4: North America Neurological Monitoring Industry Volume (K Unit), by Country 2024 & 2032
- Figure 5: North America Neurological Monitoring Industry Revenue Share (%), by Country 2024 & 2032
- Figure 6: North America Neurological Monitoring Industry Volume Share (%), by Country 2024 & 2032
- Figure 7: Europe Neurological Monitoring Industry Revenue (Million), by Country 2024 & 2032
- Figure 8: Europe Neurological Monitoring Industry Volume (K Unit), by Country 2024 & 2032
- Figure 9: Europe Neurological Monitoring Industry Revenue Share (%), by Country 2024 & 2032
- Figure 10: Europe Neurological Monitoring Industry Volume Share (%), by Country 2024 & 2032
- Figure 11: Asia Pacific Neurological Monitoring Industry Revenue (Million), by Country 2024 & 2032
- Figure 12: Asia Pacific Neurological Monitoring Industry Volume (K Unit), by Country 2024 & 2032
- Figure 13: Asia Pacific Neurological Monitoring Industry Revenue Share (%), by Country 2024 & 2032
- Figure 14: Asia Pacific Neurological Monitoring Industry Volume Share (%), by Country 2024 & 2032
- Figure 15: Middle East and Africa Neurological Monitoring Industry Revenue (Million), by Country 2024 & 2032
- Figure 16: Middle East and Africa Neurological Monitoring Industry Volume (K Unit), by Country 2024 & 2032
- Figure 17: Middle East and Africa Neurological Monitoring Industry Revenue Share (%), by Country 2024 & 2032
- Figure 18: Middle East and Africa Neurological Monitoring Industry Volume Share (%), by Country 2024 & 2032
- Figure 19: South America Neurological Monitoring Industry Revenue (Million), by Country 2024 & 2032
- Figure 20: South America Neurological Monitoring Industry Volume (K Unit), by Country 2024 & 2032
- Figure 21: South America Neurological Monitoring Industry Revenue Share (%), by Country 2024 & 2032
- Figure 22: South America Neurological Monitoring Industry Volume Share (%), by Country 2024 & 2032
- Figure 23: North America Neurological Monitoring Industry Revenue (Million), by Product Type 2024 & 2032
- Figure 24: North America Neurological Monitoring Industry Volume (K Unit), by Product Type 2024 & 2032
- Figure 25: North America Neurological Monitoring Industry Revenue Share (%), by Product Type 2024 & 2032
- Figure 26: North America Neurological Monitoring Industry Volume Share (%), by Product Type 2024 & 2032
- Figure 27: North America Neurological Monitoring Industry Revenue (Million), by Disease Type 2024 & 2032
- Figure 28: North America Neurological Monitoring Industry Volume (K Unit), by Disease Type 2024 & 2032
- Figure 29: North America Neurological Monitoring Industry Revenue Share (%), by Disease Type 2024 & 2032
- Figure 30: North America Neurological Monitoring Industry Volume Share (%), by Disease Type 2024 & 2032
- Figure 31: North America Neurological Monitoring Industry Revenue (Million), by Country 2024 & 2032
- Figure 32: North America Neurological Monitoring Industry Volume (K Unit), by Country 2024 & 2032
- Figure 33: North America Neurological Monitoring Industry Revenue Share (%), by Country 2024 & 2032
- Figure 34: North America Neurological Monitoring Industry Volume Share (%), by Country 2024 & 2032
- Figure 35: Europe Neurological Monitoring Industry Revenue (Million), by Product Type 2024 & 2032
- Figure 36: Europe Neurological Monitoring Industry Volume (K Unit), by Product Type 2024 & 2032
- Figure 37: Europe Neurological Monitoring Industry Revenue Share (%), by Product Type 2024 & 2032
- Figure 38: Europe Neurological Monitoring Industry Volume Share (%), by Product Type 2024 & 2032
- Figure 39: Europe Neurological Monitoring Industry Revenue (Million), by Disease Type 2024 & 2032
- Figure 40: Europe Neurological Monitoring Industry Volume (K Unit), by Disease Type 2024 & 2032
- Figure 41: Europe Neurological Monitoring Industry Revenue Share (%), by Disease Type 2024 & 2032
- Figure 42: Europe Neurological Monitoring Industry Volume Share (%), by Disease Type 2024 & 2032
- Figure 43: Europe Neurological Monitoring Industry Revenue (Million), by Country 2024 & 2032
- Figure 44: Europe Neurological Monitoring Industry Volume (K Unit), by Country 2024 & 2032
- Figure 45: Europe Neurological Monitoring Industry Revenue Share (%), by Country 2024 & 2032
- Figure 46: Europe Neurological Monitoring Industry Volume Share (%), by Country 2024 & 2032
- Figure 47: Asia Pacific Neurological Monitoring Industry Revenue (Million), by Product Type 2024 & 2032
- Figure 48: Asia Pacific Neurological Monitoring Industry Volume (K Unit), by Product Type 2024 & 2032
- Figure 49: Asia Pacific Neurological Monitoring Industry Revenue Share (%), by Product Type 2024 & 2032
- Figure 50: Asia Pacific Neurological Monitoring Industry Volume Share (%), by Product Type 2024 & 2032
- Figure 51: Asia Pacific Neurological Monitoring Industry Revenue (Million), by Disease Type 2024 & 2032
- Figure 52: Asia Pacific Neurological Monitoring Industry Volume (K Unit), by Disease Type 2024 & 2032
- Figure 53: Asia Pacific Neurological Monitoring Industry Revenue Share (%), by Disease Type 2024 & 2032
- Figure 54: Asia Pacific Neurological Monitoring Industry Volume Share (%), by Disease Type 2024 & 2032
- Figure 55: Asia Pacific Neurological Monitoring Industry Revenue (Million), by Country 2024 & 2032
- Figure 56: Asia Pacific Neurological Monitoring Industry Volume (K Unit), by Country 2024 & 2032
- Figure 57: Asia Pacific Neurological Monitoring Industry Revenue Share (%), by Country 2024 & 2032
- Figure 58: Asia Pacific Neurological Monitoring Industry Volume Share (%), by Country 2024 & 2032
- Figure 59: Middle East and Africa Neurological Monitoring Industry Revenue (Million), by Product Type 2024 & 2032
- Figure 60: Middle East and Africa Neurological Monitoring Industry Volume (K Unit), by Product Type 2024 & 2032
- Figure 61: Middle East and Africa Neurological Monitoring Industry Revenue Share (%), by Product Type 2024 & 2032
- Figure 62: Middle East and Africa Neurological Monitoring Industry Volume Share (%), by Product Type 2024 & 2032
- Figure 63: Middle East and Africa Neurological Monitoring Industry Revenue (Million), by Disease Type 2024 & 2032
- Figure 64: Middle East and Africa Neurological Monitoring Industry Volume (K Unit), by Disease Type 2024 & 2032
- Figure 65: Middle East and Africa Neurological Monitoring Industry Revenue Share (%), by Disease Type 2024 & 2032
- Figure 66: Middle East and Africa Neurological Monitoring Industry Volume Share (%), by Disease Type 2024 & 2032
- Figure 67: Middle East and Africa Neurological Monitoring Industry Revenue (Million), by Country 2024 & 2032
- Figure 68: Middle East and Africa Neurological Monitoring Industry Volume (K Unit), by Country 2024 & 2032
- Figure 69: Middle East and Africa Neurological Monitoring Industry Revenue Share (%), by Country 2024 & 2032
- Figure 70: Middle East and Africa Neurological Monitoring Industry Volume Share (%), by Country 2024 & 2032
- Figure 71: South America Neurological Monitoring Industry Revenue (Million), by Product Type 2024 & 2032
- Figure 72: South America Neurological Monitoring Industry Volume (K Unit), by Product Type 2024 & 2032
- Figure 73: South America Neurological Monitoring Industry Revenue Share (%), by Product Type 2024 & 2032
- Figure 74: South America Neurological Monitoring Industry Volume Share (%), by Product Type 2024 & 2032
- Figure 75: South America Neurological Monitoring Industry Revenue (Million), by Disease Type 2024 & 2032
- Figure 76: South America Neurological Monitoring Industry Volume (K Unit), by Disease Type 2024 & 2032
- Figure 77: South America Neurological Monitoring Industry Revenue Share (%), by Disease Type 2024 & 2032
- Figure 78: South America Neurological Monitoring Industry Volume Share (%), by Disease Type 2024 & 2032
- Figure 79: South America Neurological Monitoring Industry Revenue (Million), by Country 2024 & 2032
- Figure 80: South America Neurological Monitoring Industry Volume (K Unit), by Country 2024 & 2032
- Figure 81: South America Neurological Monitoring Industry Revenue Share (%), by Country 2024 & 2032
- Figure 82: South America Neurological Monitoring Industry Volume Share (%), by Country 2024 & 2032
List of Tables
- Table 1: Global Neurological Monitoring Industry Revenue Million Forecast, by Region 2019 & 2032
- Table 2: Global Neurological Monitoring Industry Volume K Unit Forecast, by Region 2019 & 2032
- Table 3: Global Neurological Monitoring Industry Revenue Million Forecast, by Product Type 2019 & 2032
- Table 4: Global Neurological Monitoring Industry Volume K Unit Forecast, by Product Type 2019 & 2032
- Table 5: Global Neurological Monitoring Industry Revenue Million Forecast, by Disease Type 2019 & 2032
- Table 6: Global Neurological Monitoring Industry Volume K Unit Forecast, by Disease Type 2019 & 2032
- Table 7: Global Neurological Monitoring Industry Revenue Million Forecast, by Region 2019 & 2032
- Table 8: Global Neurological Monitoring Industry Volume K Unit Forecast, by Region 2019 & 2032
- Table 9: Global Neurological Monitoring Industry Revenue Million Forecast, by Country 2019 & 2032
- Table 10: Global Neurological Monitoring Industry Volume K Unit Forecast, by Country 2019 & 2032
- Table 11: United States Neurological Monitoring Industry Revenue (Million) Forecast, by Application 2019 & 2032
- Table 12: United States Neurological Monitoring Industry Volume (K Unit) Forecast, by Application 2019 & 2032
- Table 13: Canada Neurological Monitoring Industry Revenue (Million) Forecast, by Application 2019 & 2032
- Table 14: Canada Neurological Monitoring Industry Volume (K Unit) Forecast, by Application 2019 & 2032
- Table 15: Mexico Neurological Monitoring Industry Revenue (Million) Forecast, by Application 2019 & 2032
- Table 16: Mexico Neurological Monitoring Industry Volume (K Unit) Forecast, by Application 2019 & 2032
- Table 17: Global Neurological Monitoring Industry Revenue Million Forecast, by Country 2019 & 2032
- Table 18: Global Neurological Monitoring Industry Volume K Unit Forecast, by Country 2019 & 2032
- Table 19: Germany Neurological Monitoring Industry Revenue (Million) Forecast, by Application 2019 & 2032
- Table 20: Germany Neurological Monitoring Industry Volume (K Unit) Forecast, by Application 2019 & 2032
- Table 21: United Kingdom Neurological Monitoring Industry Revenue (Million) Forecast, by Application 2019 & 2032
- Table 22: United Kingdom Neurological Monitoring Industry Volume (K Unit) Forecast, by Application 2019 & 2032
- Table 23: France Neurological Monitoring Industry Revenue (Million) Forecast, by Application 2019 & 2032
- Table 24: France Neurological Monitoring Industry Volume (K Unit) Forecast, by Application 2019 & 2032
- Table 25: Italy Neurological Monitoring Industry Revenue (Million) Forecast, by Application 2019 & 2032
- Table 26: Italy Neurological Monitoring Industry Volume (K Unit) Forecast, by Application 2019 & 2032
- Table 27: Spain Neurological Monitoring Industry Revenue (Million) Forecast, by Application 2019 & 2032
- Table 28: Spain Neurological Monitoring Industry Volume (K Unit) Forecast, by Application 2019 & 2032
- Table 29: Rest of Europe Neurological Monitoring Industry Revenue (Million) Forecast, by Application 2019 & 2032
- Table 30: Rest of Europe Neurological Monitoring Industry Volume (K Unit) Forecast, by Application 2019 & 2032
- Table 31: Global Neurological Monitoring Industry Revenue Million Forecast, by Country 2019 & 2032
- Table 32: Global Neurological Monitoring Industry Volume K Unit Forecast, by Country 2019 & 2032
- Table 33: China Neurological Monitoring Industry Revenue (Million) Forecast, by Application 2019 & 2032
- Table 34: China Neurological Monitoring Industry Volume (K Unit) Forecast, by Application 2019 & 2032
- Table 35: Japan Neurological Monitoring Industry Revenue (Million) Forecast, by Application 2019 & 2032
- Table 36: Japan Neurological Monitoring Industry Volume (K Unit) Forecast, by Application 2019 & 2032
- Table 37: India Neurological Monitoring Industry Revenue (Million) Forecast, by Application 2019 & 2032
- Table 38: India Neurological Monitoring Industry Volume (K Unit) Forecast, by Application 2019 & 2032
- Table 39: Australia Neurological Monitoring Industry Revenue (Million) Forecast, by Application 2019 & 2032
- Table 40: Australia Neurological Monitoring Industry Volume (K Unit) Forecast, by Application 2019 & 2032
- Table 41: South Korea Neurological Monitoring Industry Revenue (Million) Forecast, by Application 2019 & 2032
- Table 42: South Korea Neurological Monitoring Industry Volume (K Unit) Forecast, by Application 2019 & 2032
- Table 43: Rest of Asia Pacific Neurological Monitoring Industry Revenue (Million) Forecast, by Application 2019 & 2032
- Table 44: Rest of Asia Pacific Neurological Monitoring Industry Volume (K Unit) Forecast, by Application 2019 & 2032
- Table 45: Global Neurological Monitoring Industry Revenue Million Forecast, by Country 2019 & 2032
- Table 46: Global Neurological Monitoring Industry Volume K Unit Forecast, by Country 2019 & 2032
- Table 47: GCC Neurological Monitoring Industry Revenue (Million) Forecast, by Application 2019 & 2032
- Table 48: GCC Neurological Monitoring Industry Volume (K Unit) Forecast, by Application 2019 & 2032
- Table 49: South Africa Neurological Monitoring Industry Revenue (Million) Forecast, by Application 2019 & 2032
- Table 50: South Africa Neurological Monitoring Industry Volume (K Unit) Forecast, by Application 2019 & 2032
- Table 51: Rest of Middle East and Africa Neurological Monitoring Industry Revenue (Million) Forecast, by Application 2019 & 2032
- Table 52: Rest of Middle East and Africa Neurological Monitoring Industry Volume (K Unit) Forecast, by Application 2019 & 2032
- Table 53: Global Neurological Monitoring Industry Revenue Million Forecast, by Country 2019 & 2032
- Table 54: Global Neurological Monitoring Industry Volume K Unit Forecast, by Country 2019 & 2032
- Table 55: Brazil Neurological Monitoring Industry Revenue (Million) Forecast, by Application 2019 & 2032
- Table 56: Brazil Neurological Monitoring Industry Volume (K Unit) Forecast, by Application 2019 & 2032
- Table 57: Argentina Neurological Monitoring Industry Revenue (Million) Forecast, by Application 2019 & 2032
- Table 58: Argentina Neurological Monitoring Industry Volume (K Unit) Forecast, by Application 2019 & 2032
- Table 59: Rest of South America Neurological Monitoring Industry Revenue (Million) Forecast, by Application 2019 & 2032
- Table 60: Rest of South America Neurological Monitoring Industry Volume (K Unit) Forecast, by Application 2019 & 2032
- Table 61: Global Neurological Monitoring Industry Revenue Million Forecast, by Product Type 2019 & 2032
- Table 62: Global Neurological Monitoring Industry Volume K Unit Forecast, by Product Type 2019 & 2032
- Table 63: Global Neurological Monitoring Industry Revenue Million Forecast, by Disease Type 2019 & 2032
- Table 64: Global Neurological Monitoring Industry Volume K Unit Forecast, by Disease Type 2019 & 2032
- Table 65: Global Neurological Monitoring Industry Revenue Million Forecast, by Country 2019 & 2032
- Table 66: Global Neurological Monitoring Industry Volume K Unit Forecast, by Country 2019 & 2032
- Table 67: United States Neurological Monitoring Industry Revenue (Million) Forecast, by Application 2019 & 2032
- Table 68: United States Neurological Monitoring Industry Volume (K Unit) Forecast, by Application 2019 & 2032
- Table 69: Canada Neurological Monitoring Industry Revenue (Million) Forecast, by Application 2019 & 2032
- Table 70: Canada Neurological Monitoring Industry Volume (K Unit) Forecast, by Application 2019 & 2032
- Table 71: Mexico Neurological Monitoring Industry Revenue (Million) Forecast, by Application 2019 & 2032
- Table 72: Mexico Neurological Monitoring Industry Volume (K Unit) Forecast, by Application 2019 & 2032
- Table 73: Global Neurological Monitoring Industry Revenue Million Forecast, by Product Type 2019 & 2032
- Table 74: Global Neurological Monitoring Industry Volume K Unit Forecast, by Product Type 2019 & 2032
- Table 75: Global Neurological Monitoring Industry Revenue Million Forecast, by Disease Type 2019 & 2032
- Table 76: Global Neurological Monitoring Industry Volume K Unit Forecast, by Disease Type 2019 & 2032
- Table 77: Global Neurological Monitoring Industry Revenue Million Forecast, by Country 2019 & 2032
- Table 78: Global Neurological Monitoring Industry Volume K Unit Forecast, by Country 2019 & 2032
- Table 79: Germany Neurological Monitoring Industry Revenue (Million) Forecast, by Application 2019 & 2032
- Table 80: Germany Neurological Monitoring Industry Volume (K Unit) Forecast, by Application 2019 & 2032
- Table 81: United Kingdom Neurological Monitoring Industry Revenue (Million) Forecast, by Application 2019 & 2032
- Table 82: United Kingdom Neurological Monitoring Industry Volume (K Unit) Forecast, by Application 2019 & 2032
- Table 83: France Neurological Monitoring Industry Revenue (Million) Forecast, by Application 2019 & 2032
- Table 84: France Neurological Monitoring Industry Volume (K Unit) Forecast, by Application 2019 & 2032
- Table 85: Italy Neurological Monitoring Industry Revenue (Million) Forecast, by Application 2019 & 2032
- Table 86: Italy Neurological Monitoring Industry Volume (K Unit) Forecast, by Application 2019 & 2032
- Table 87: Spain Neurological Monitoring Industry Revenue (Million) Forecast, by Application 2019 & 2032
- Table 88: Spain Neurological Monitoring Industry Volume (K Unit) Forecast, by Application 2019 & 2032
- Table 89: Rest of Europe Neurological Monitoring Industry Revenue (Million) Forecast, by Application 2019 & 2032
- Table 90: Rest of Europe Neurological Monitoring Industry Volume (K Unit) Forecast, by Application 2019 & 2032
- Table 91: Global Neurological Monitoring Industry Revenue Million Forecast, by Product Type 2019 & 2032
- Table 92: Global Neurological Monitoring Industry Volume K Unit Forecast, by Product Type 2019 & 2032
- Table 93: Global Neurological Monitoring Industry Revenue Million Forecast, by Disease Type 2019 & 2032
- Table 94: Global Neurological Monitoring Industry Volume K Unit Forecast, by Disease Type 2019 & 2032
- Table 95: Global Neurological Monitoring Industry Revenue Million Forecast, by Country 2019 & 2032
- Table 96: Global Neurological Monitoring Industry Volume K Unit Forecast, by Country 2019 & 2032
- Table 97: China Neurological Monitoring Industry Revenue (Million) Forecast, by Application 2019 & 2032
- Table 98: China Neurological Monitoring Industry Volume (K Unit) Forecast, by Application 2019 & 2032
- Table 99: Japan Neurological Monitoring Industry Revenue (Million) Forecast, by Application 2019 & 2032
- Table 100: Japan Neurological Monitoring Industry Volume (K Unit) Forecast, by Application 2019 & 2032
- Table 101: India Neurological Monitoring Industry Revenue (Million) Forecast, by Application 2019 & 2032
- Table 102: India Neurological Monitoring Industry Volume (K Unit) Forecast, by Application 2019 & 2032
- Table 103: Australia Neurological Monitoring Industry Revenue (Million) Forecast, by Application 2019 & 2032
- Table 104: Australia Neurological Monitoring Industry Volume (K Unit) Forecast, by Application 2019 & 2032
- Table 105: South Korea Neurological Monitoring Industry Revenue (Million) Forecast, by Application 2019 & 2032
- Table 106: South Korea Neurological Monitoring Industry Volume (K Unit) Forecast, by Application 2019 & 2032
- Table 107: Rest of Asia Pacific Neurological Monitoring Industry Revenue (Million) Forecast, by Application 2019 & 2032
- Table 108: Rest of Asia Pacific Neurological Monitoring Industry Volume (K Unit) Forecast, by Application 2019 & 2032
- Table 109: Global Neurological Monitoring Industry Revenue Million Forecast, by Product Type 2019 & 2032
- Table 110: Global Neurological Monitoring Industry Volume K Unit Forecast, by Product Type 2019 & 2032
- Table 111: Global Neurological Monitoring Industry Revenue Million Forecast, by Disease Type 2019 & 2032
- Table 112: Global Neurological Monitoring Industry Volume K Unit Forecast, by Disease Type 2019 & 2032
- Table 113: Global Neurological Monitoring Industry Revenue Million Forecast, by Country 2019 & 2032
- Table 114: Global Neurological Monitoring Industry Volume K Unit Forecast, by Country 2019 & 2032
- Table 115: GCC Neurological Monitoring Industry Revenue (Million) Forecast, by Application 2019 & 2032
- Table 116: GCC Neurological Monitoring Industry Volume (K Unit) Forecast, by Application 2019 & 2032
- Table 117: South Africa Neurological Monitoring Industry Revenue (Million) Forecast, by Application 2019 & 2032
- Table 118: South Africa Neurological Monitoring Industry Volume (K Unit) Forecast, by Application 2019 & 2032
- Table 119: Rest of Middle East and Africa Neurological Monitoring Industry Revenue (Million) Forecast, by Application 2019 & 2032
- Table 120: Rest of Middle East and Africa Neurological Monitoring Industry Volume (K Unit) Forecast, by Application 2019 & 2032
- Table 121: Global Neurological Monitoring Industry Revenue Million Forecast, by Product Type 2019 & 2032
- Table 122: Global Neurological Monitoring Industry Volume K Unit Forecast, by Product Type 2019 & 2032
- Table 123: Global Neurological Monitoring Industry Revenue Million Forecast, by Disease Type 2019 & 2032
- Table 124: Global Neurological Monitoring Industry Volume K Unit Forecast, by Disease Type 2019 & 2032
- Table 125: Global Neurological Monitoring Industry Revenue Million Forecast, by Country 2019 & 2032
- Table 126: Global Neurological Monitoring Industry Volume K Unit Forecast, by Country 2019 & 2032
- Table 127: Brazil Neurological Monitoring Industry Revenue (Million) Forecast, by Application 2019 & 2032
- Table 128: Brazil Neurological Monitoring Industry Volume (K Unit) Forecast, by Application 2019 & 2032
- Table 129: Argentina Neurological Monitoring Industry Revenue (Million) Forecast, by Application 2019 & 2032
- Table 130: Argentina Neurological Monitoring Industry Volume (K Unit) Forecast, by Application 2019 & 2032
- Table 131: Rest of South America Neurological Monitoring Industry Revenue (Million) Forecast, by Application 2019 & 2032
- Table 132: Rest of South America Neurological Monitoring Industry Volume (K Unit) Forecast, by Application 2019 & 2032
Frequently Asked Questions
1. What is the projected Compound Annual Growth Rate (CAGR) of the Neurological Monitoring Industry?
The projected CAGR is approximately 6.00%.
2. Which companies are prominent players in the Neurological Monitoring Industry?
Key companies in the market include Siemens Healthineers, GE Healthcare, Masimo Corporation, Natus Medical Inc, Compumedics Limited, Dragerwerk Ag & Co KGaA, Philips Healthcare, Medtronic PLC, Advanced Brain Monitoring Inc, Nihon Kohden Corporation.
3. What are the main segments of the Neurological Monitoring Industry?
The market segments include Product Type, Disease Type.
4. Can you provide details about the market size?
The market size is estimated to be USD 6.74 Million as of 2022.
5. What are some drivers contributing to market growth?
Increasing Burden of Neurological Disorders; Growing Incidence of Traumatic Brain Injuries; Increasing Number of Product Approvals.
6. What are the notable trends driving market growth?
Sleep Disorder is Expected to Witness Strong Growth Over the Forecast Period.
7. Are there any restraints impacting market growth?
High Cost of Monitoring Devices; Shortage of Trained Professionals.
8. Can you provide examples of recent developments in the market?
February 2023: SafeICP, a project funded by the Spanish Research Agency in collaboration with European Next Generation funds, is developing a low-cost, easy-to-use monitor that will be placed at patients' bedside to non-invasively monitor intracranial pressure values.
9. What pricing options are available for accessing the report?
Pricing options include single-user, multi-user, and enterprise licenses priced at USD 4750, USD 5250, and USD 8750 respectively.
10. Is the market size provided in terms of value or volume?
The market size is provided in terms of value, measured in Million and volume, measured in K Unit.
11. Are there any specific market keywords associated with the report?
Yes, the market keyword associated with the report is "Neurological Monitoring Industry," which aids in identifying and referencing the specific market segment covered.
12. How do I determine which pricing option suits my needs best?
The pricing options vary based on user requirements and access needs. Individual users may opt for single-user licenses, while businesses requiring broader access may choose multi-user or enterprise licenses for cost-effective access to the report.
13. Are there any additional resources or data provided in the Neurological Monitoring Industry report?
While the report offers comprehensive insights, it's advisable to review the specific contents or supplementary materials provided to ascertain if additional resources or data are available.
14. How can I stay updated on further developments or reports in the Neurological Monitoring Industry?
To stay informed about further developments, trends, and reports in the Neurological Monitoring Industry, consider subscribing to industry newsletters, following relevant companies and organizations, or regularly checking reputable industry news sources and publications.
Methodology
Step 1 - Identification of Relevant Samples Size from Population Database


Step 2 - Approaches for Defining Global Market Size (Value, Volume* & Price*)

Note*: In applicable scenarios
Step 3 - Data Sources
Primary Research
- Web Analytics
- Survey Reports
- Research Institute
- Latest Research Reports
- Opinion Leaders
Secondary Research
- Annual Reports
- White Paper
- Latest Press Release
- Industry Association
- Paid Database
- Investor Presentations

Step 4 - Data Triangulation
Involves using different sources of information in order to increase the validity of a study
These sources are likely to be stakeholders in a program - participants, other researchers, program staff, other community members, and so on.
Then we put all data in single framework & apply various statistical tools to find out the dynamic on the market.
During the analysis stage, feedback from the stakeholder groups would be compared to determine areas of agreement as well as areas of divergence


