
Key Insights
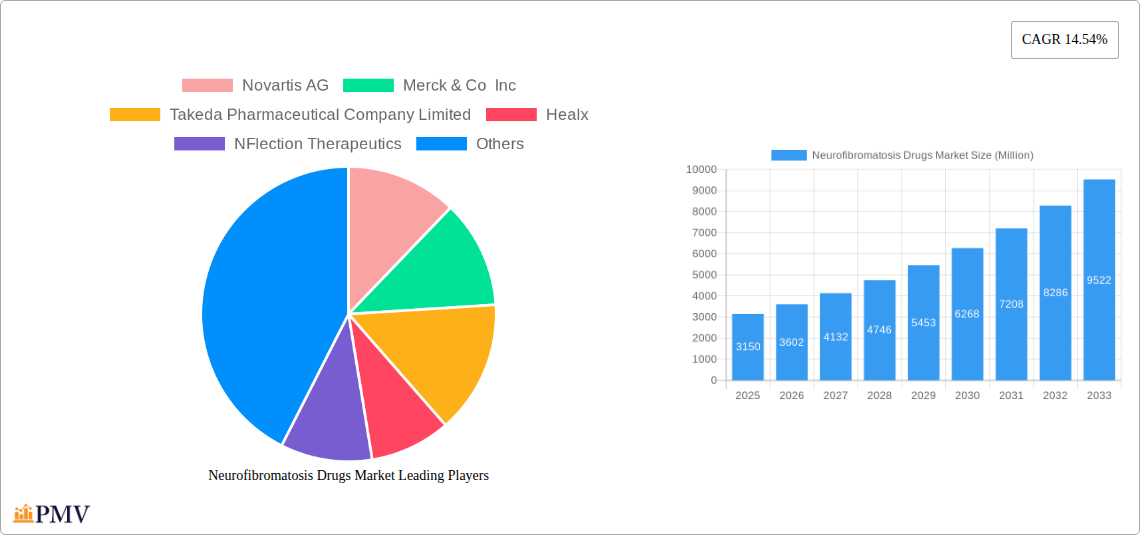
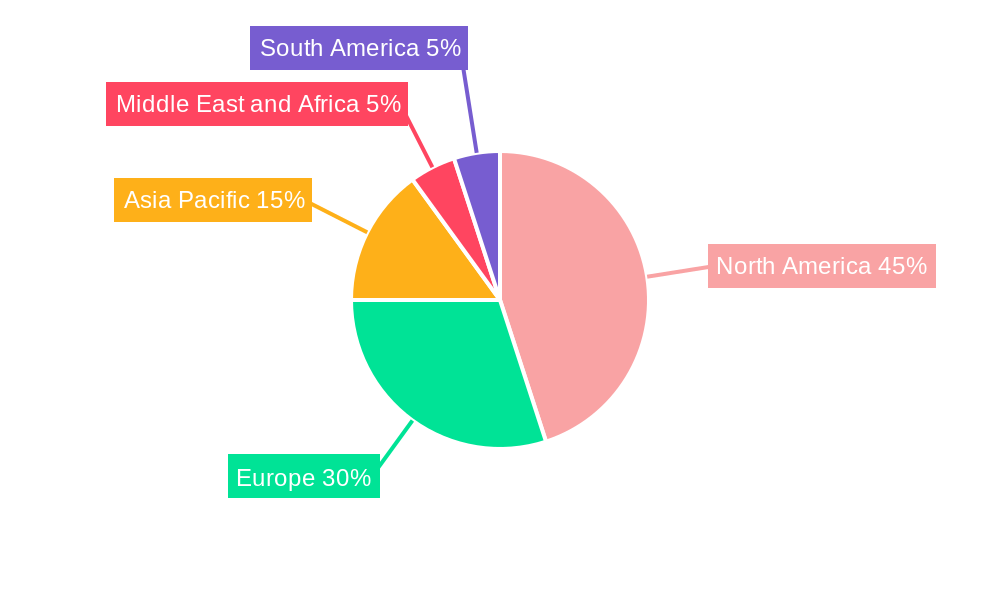
The Neurofibromatosis (NF) drugs market, valued at $3.15 billion in 2025, is projected to experience robust growth, driven by a rising prevalence of NF1, NF2, and Schwannomatosis, coupled with increasing awareness and diagnosis rates. Significant advancements in drug development pipelines, including targeted therapies and novel approaches like gene therapy, are fueling market expansion. The market is segmented by disease type, with NF1 currently dominating due to its higher prevalence. End-user segments encompass hospital pharmacies, drug stores, and the rapidly growing online pharmacy channel. Geographically, North America currently holds a significant market share owing to established healthcare infrastructure and high healthcare expenditure, while the Asia-Pacific region is poised for substantial growth fueled by increasing disposable incomes and rising healthcare awareness. However, the market faces challenges such as the complexity of NF diseases, the need for personalized treatment strategies, and the relatively high cost of innovative therapies. Competition is intensifying with established pharmaceutical giants like Novartis, Merck, and Takeda alongside emerging biotech companies actively involved in research and development. The forecast period (2025-2033) anticipates a continued upward trajectory, driven by ongoing clinical trials and potential regulatory approvals of new therapies.
The continued increase in research and development funding focused on NF drug development is a key factor supporting market growth. The successful development and approval of new treatments for NF, particularly for those currently lacking effective therapies, will substantially boost market revenue. Furthermore, a growing emphasis on personalized medicine approaches promises more effective therapies with improved patient outcomes. The market's success hinges on collaborative efforts among pharmaceutical companies, research institutions, and patient advocacy groups to accelerate drug discovery, ensure wider access, and manage the long-term costs associated with these complex and often debilitating diseases. The strategic partnerships between large pharmaceutical companies and smaller biotech firms enhance research capabilities and accelerate the development pipeline, further impacting market expansion.
Neurofibromatosis Drugs Market: A Comprehensive Analysis (2019-2033)
This in-depth report provides a comprehensive analysis of the Neurofibromatosis Drugs Market, offering invaluable insights for industry stakeholders, investors, and researchers. The study covers the period 2019-2033, with a base year of 2025 and a forecast period of 2025-2033. The report meticulously examines market dynamics, competitive landscapes, and future growth potential, incorporating recent industry developments and key player strategies. Expected market value in 2025 is estimated at xx Million, with a projected CAGR of xx% during the forecast period.
Neurofibromatosis Drugs Market Market Structure & Competitive Dynamics
The Neurofibromatosis drugs market exhibits a moderately concentrated structure, with key players such as Novartis AG, Merck & Co Inc, and Takeda Pharmaceutical Company Limited holding significant market share. However, the emergence of innovative biotech companies like Healx, NFlection Therapeutics, and Recursion Pharmaceuticals is intensifying competition and fostering innovation. The market is characterized by a dynamic innovation ecosystem, driven by advancements in targeted therapies and AI-powered drug discovery. Regulatory frameworks, particularly those governing drug approvals and clinical trials, play a crucial role in shaping market access and growth. Product substitutes are limited, given the rarity and specific nature of neurofibromatosis. End-user trends indicate a growing demand for effective and targeted treatments, driving market expansion. M&A activities within the sector have been relatively moderate in recent years, with deal values ranging from xx Million to xx Million, primarily focused on acquiring promising pipeline assets and enhancing technological capabilities. Market share analysis reveals that Novartis AG holds approximately xx% of the market share in 2025, followed by Merck & Co Inc with xx% and Takeda Pharmaceutical Company Limited at xx%.
Neurofibromatosis Drugs Market Industry Trends & Insights
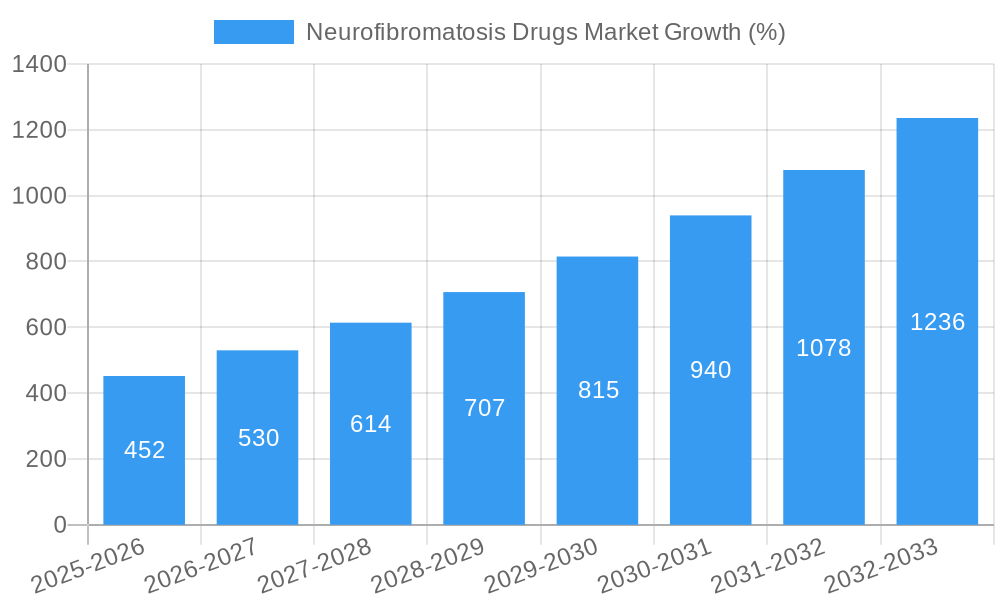
The Neurofibromatosis drugs market is experiencing robust growth, fueled by several key factors. The rising prevalence of neurofibromatosis types 1 and 2, coupled with an increasing awareness of the disease and unmet medical needs, are major market drivers. Technological advancements, particularly in gene therapy and precision medicine, are paving the way for more effective and targeted treatment options. Consumer preferences are shifting towards personalized medicine approaches, emphasizing the importance of tailored therapies to address individual patient needs. The competitive dynamics are characterized by intensified R&D activities, strategic partnerships, and a growing emphasis on early-stage clinical trial development. The market is witnessing a surge in the development of novel therapies targeting specific molecular pathways involved in neurofibromatosis. The overall market is exhibiting a considerable upward trend, with a projected CAGR of xx% between 2025 and 2033. Market penetration for existing therapies remains relatively low due to the limited treatment options; however, this is expected to significantly increase with the introduction of newer drugs in the coming years. This growth is further propelled by the expanding research and development capabilities within both pharmaceutical giants and smaller specialized biotech firms.
Dominant Markets & Segments in Neurofibromatosis Drugs Market
- Disease Type: Neurofibromatosis Type 1 (NF1) represents the largest segment within the market due to its higher prevalence compared to NF2 and Schwannomatosis. The market for NF1 treatments is driven by a large unmet clinical need and a considerable number of patients requiring management of associated symptoms. NF2 and Schwannomatosis, while smaller segments, are experiencing growth as research and development efforts target these rarer forms of neurofibromatosis.
- End User: Hospital pharmacies are the dominant end-user segment, accounting for a significant proportion of drug sales. This is primarily due to the complex nature of treatment and the requirement for specialized administration in many instances. Drug stores and online pharmacies are expected to witness moderate growth as access to treatments improves and the preference for convenient dispensing methods increases.
The North American region currently dominates the Neurofibromatosis drugs market, driven by robust healthcare infrastructure, increased research and development activities, and higher healthcare expenditure. This dominance is further fueled by favorable regulatory policies and a high concentration of pharmaceutical companies in the region. Key drivers include supportive government policies towards drug development and commercialization, as well as substantial investments in medical research.
Neurofibromatosis Drugs Market Product Innovations
Recent advancements in the Neurofibromatosis drugs market have primarily focused on targeted therapies and novel drug delivery systems. The development of drugs that specifically target the underlying genetic mutations associated with neurofibromatosis holds significant promise. Companies are also exploring innovative approaches such as gene therapy to address the root causes of the disease. These advancements address existing market gaps and unmet medical needs, enhancing therapeutic efficacy and patient outcomes. The market fit for these new products is significant, given the large unmet needs in the treatment of neurofibromatosis. The technological trends point towards a shift towards precision medicine and personalized therapies, promising improved treatment outcomes.
Report Segmentation & Scope
This report segments the Neurofibromatosis drugs market based on disease type (Neurofibromatosis Type 1 (NF1), Neurofibromatosis Type 2 (NF2), and Schwannomatosis) and end-user (Hospital Pharmacies, Drug Stores, and Online Pharmacies).
Disease Type Segmentation: Each segment's growth is influenced by prevalence rates, ongoing research, and availability of targeted therapies. NF1 currently dominates, while NF2 and Schwannomatosis represent smaller but growing markets.
End-User Segmentation: The hospital pharmacy segment is expected to hold a major market share due to the complexities involved in the treatment. Drug stores and online pharmacies are expected to show gradual growth as accessibility improves. Market sizes and competitive dynamics vary across each segment, with growth projections determined by specific factors within each category.
Key Drivers of Neurofibromatosis Drugs Market Growth
Several factors contribute to the market's growth. The rising prevalence of neurofibromatosis, coupled with increased awareness and improved diagnostics, fuels demand for effective treatments. Technological advancements, particularly in targeted therapies and gene editing, are creating new treatment options. Regulatory approvals and supportive government policies also contribute. Furthermore, significant investments in R&D are driving the development of novel drugs and therapies.
Challenges in the Neurofibromatosis Drugs Market Sector
The market faces challenges such as the complexity of neurofibromatosis, making drug development difficult and increasing research costs. Regulatory hurdles and lengthy approval processes can delay the introduction of new treatments. The relatively small patient population compared to other disease areas can limit the profitability of drug development, discouraging investment. Furthermore, supply chain disruptions and competition from existing therapies pose further obstacles. The overall impact of these challenges translates to high development costs and relatively limited availability of effective treatments.
Leading Players in the Neurofibromatosis Drugs Market Market
- Novartis AG
- Merck & Co Inc
- Takeda Pharmaceutical Company Limited
- Healx
- NFlection Therapeutics
- Recursion Pharmaceuticals
- SpringWorks Therapeutics
- AstraZeneca Pharmaceuticals
- Fosun Pharmaceutical
- Pfizer Inc
Key Developments in Neurofibromatosis Drugs Market Sector
- April 2024: Healx entered an investment agreement with the Children's Tumor Foundation (CTF), accelerating its AI-driven neurofibromatosis strategy and its lead molecule, HLX-1502, nearing Phase 2 trials. This significantly impacts the market by introducing a new player with promising technology.
- March 2024: SpringWorks Therapeutics initiated a new drug application for mirdametinib in pediatric and adult patients with NF1-associated plexiform neurofibromas. This development brings a potential new treatment option to the market, increasing treatment options and potentially altering the competitive landscape.
Strategic Neurofibromatosis Drugs Market Market Outlook
The Neurofibromatosis drugs market holds significant future potential, driven by ongoing research and development efforts focused on innovative therapies. Strategic opportunities exist in personalized medicine approaches, utilizing genomics and proteomics to develop targeted treatments. Collaboration between pharmaceutical companies, research institutions, and patient advocacy groups is crucial for accelerating drug discovery and development. The continued focus on precision medicine and AI-powered drug discovery promises to deliver more effective and tailored therapies in the coming years, opening further opportunities for growth and innovation within the sector.
Neurofibromatosis Drugs Market Segmentation
-
1. Disease Type
- 1.1. Neurofibromatosis Type 1 (NF1)
- 1.2. Neurofibromatosis Type 2 (NF2)
- 1.3. Schwannomatosis
-
2. End User
- 2.1. Hospital Pharmacies
- 2.2. Drug Stores
- 2.3. Online Pharmacies
Neurofibromatosis Drugs Market Segmentation By Geography
-
1. North America
- 1.1. United States
- 1.2. Canada
- 1.3. Mexico
-
2. Europe
- 2.1. Germany
- 2.2. United Kingdom
- 2.3. France
- 2.4. Italy
- 2.5. Spain
- 2.6. Rest of Europe
-
3. Asia Pacific
- 3.1. China
- 3.2. Japan
- 3.3. India
- 3.4. Australia
- 3.5. South Korea
- 3.6. Rest of Asia Pacific
-
4. Middle East and Africa
- 4.1. GCC
- 4.2. South Africa
- 4.3. Rest of Middle East and Africa
-
5. South America
- 5.1. Brazil
- 5.2. Argentina
- 5.3. Rest of South America
Neurofibromatosis Drugs Market REPORT HIGHLIGHTS
| Aspects | Details |
|---|---|
| Study Period | 2019-2033 |
| Base Year | 2024 |
| Estimated Year | 2025 |
| Forecast Period | 2025-2033 |
| Historical Period | 2019-2024 |
| Growth Rate | CAGR of 14.54% from 2019-2033 |
| Segmentation |
|
Table of Contents
- 1. Introduction
- 1.1. Research Scope
- 1.2. Market Segmentation
- 1.3. Research Methodology
- 1.4. Definitions and Assumptions
- 2. Executive Summary
- 2.1. Introduction
- 3. Market Dynamics
- 3.1. Introduction
- 3.2. Market Drivers
- 3.2.1. Increased Focus on Research and Development of Novel Therapies; Support from Regulatory Authorities
- 3.3. Market Restrains
- 3.3.1. Difficulty in Conducting Clinical Trials for Pediatric Population; Low treatment Rate in Developing Countries due to Lack of Treatment Options
- 3.4. Market Trends
- 3.4.1. Neurofibromatosis Type 1 (NF1) is Expected to Show Healthy Market Growth During the Forecast Period
- 4. Market Factor Analysis
- 4.1. Porters Five Forces
- 4.2. Supply/Value Chain
- 4.3. PESTEL analysis
- 4.4. Market Entropy
- 4.5. Patent/Trademark Analysis
- 5. Global Neurofibromatosis Drugs Market Analysis, Insights and Forecast, 2019-2031
- 5.1. Market Analysis, Insights and Forecast - by Disease Type
- 5.1.1. Neurofibromatosis Type 1 (NF1)
- 5.1.2. Neurofibromatosis Type 2 (NF2)
- 5.1.3. Schwannomatosis
- 5.2. Market Analysis, Insights and Forecast - by End User
- 5.2.1. Hospital Pharmacies
- 5.2.2. Drug Stores
- 5.2.3. Online Pharmacies
- 5.3. Market Analysis, Insights and Forecast - by Region
- 5.3.1. North America
- 5.3.2. Europe
- 5.3.3. Asia Pacific
- 5.3.4. Middle East and Africa
- 5.3.5. South America
- 5.1. Market Analysis, Insights and Forecast - by Disease Type
- 6. North America Neurofibromatosis Drugs Market Analysis, Insights and Forecast, 2019-2031
- 6.1. Market Analysis, Insights and Forecast - by Disease Type
- 6.1.1. Neurofibromatosis Type 1 (NF1)
- 6.1.2. Neurofibromatosis Type 2 (NF2)
- 6.1.3. Schwannomatosis
- 6.2. Market Analysis, Insights and Forecast - by End User
- 6.2.1. Hospital Pharmacies
- 6.2.2. Drug Stores
- 6.2.3. Online Pharmacies
- 6.1. Market Analysis, Insights and Forecast - by Disease Type
- 7. Europe Neurofibromatosis Drugs Market Analysis, Insights and Forecast, 2019-2031
- 7.1. Market Analysis, Insights and Forecast - by Disease Type
- 7.1.1. Neurofibromatosis Type 1 (NF1)
- 7.1.2. Neurofibromatosis Type 2 (NF2)
- 7.1.3. Schwannomatosis
- 7.2. Market Analysis, Insights and Forecast - by End User
- 7.2.1. Hospital Pharmacies
- 7.2.2. Drug Stores
- 7.2.3. Online Pharmacies
- 7.1. Market Analysis, Insights and Forecast - by Disease Type
- 8. Asia Pacific Neurofibromatosis Drugs Market Analysis, Insights and Forecast, 2019-2031
- 8.1. Market Analysis, Insights and Forecast - by Disease Type
- 8.1.1. Neurofibromatosis Type 1 (NF1)
- 8.1.2. Neurofibromatosis Type 2 (NF2)
- 8.1.3. Schwannomatosis
- 8.2. Market Analysis, Insights and Forecast - by End User
- 8.2.1. Hospital Pharmacies
- 8.2.2. Drug Stores
- 8.2.3. Online Pharmacies
- 8.1. Market Analysis, Insights and Forecast - by Disease Type
- 9. Middle East and Africa Neurofibromatosis Drugs Market Analysis, Insights and Forecast, 2019-2031
- 9.1. Market Analysis, Insights and Forecast - by Disease Type
- 9.1.1. Neurofibromatosis Type 1 (NF1)
- 9.1.2. Neurofibromatosis Type 2 (NF2)
- 9.1.3. Schwannomatosis
- 9.2. Market Analysis, Insights and Forecast - by End User
- 9.2.1. Hospital Pharmacies
- 9.2.2. Drug Stores
- 9.2.3. Online Pharmacies
- 9.1. Market Analysis, Insights and Forecast - by Disease Type
- 10. South America Neurofibromatosis Drugs Market Analysis, Insights and Forecast, 2019-2031
- 10.1. Market Analysis, Insights and Forecast - by Disease Type
- 10.1.1. Neurofibromatosis Type 1 (NF1)
- 10.1.2. Neurofibromatosis Type 2 (NF2)
- 10.1.3. Schwannomatosis
- 10.2. Market Analysis, Insights and Forecast - by End User
- 10.2.1. Hospital Pharmacies
- 10.2.2. Drug Stores
- 10.2.3. Online Pharmacies
- 10.1. Market Analysis, Insights and Forecast - by Disease Type
- 11. North America Neurofibromatosis Drugs Market Analysis, Insights and Forecast, 2019-2031
- 11.1. Market Analysis, Insights and Forecast - By Country/Sub-region
- 11.1.1. undefined
- 12. Europe Neurofibromatosis Drugs Market Analysis, Insights and Forecast, 2019-2031
- 12.1. Market Analysis, Insights and Forecast - By Country/Sub-region
- 12.1.1. undefined
- 13. Asia Pacific Neurofibromatosis Drugs Market Analysis, Insights and Forecast, 2019-2031
- 13.1. Market Analysis, Insights and Forecast - By Country/Sub-region
- 13.1.1. undefined
- 14. Middle East and Africa Neurofibromatosis Drugs Market Analysis, Insights and Forecast, 2019-2031
- 14.1. Market Analysis, Insights and Forecast - By Country/Sub-region
- 14.1.1. undefined
- 15. South America Neurofibromatosis Drugs Market Analysis, Insights and Forecast, 2019-2031
- 15.1. Market Analysis, Insights and Forecast - By Country/Sub-region
- 15.1.1. undefined
- 16. Competitive Analysis
- 16.1. Global Market Share Analysis 2024
- 16.2. Company Profiles
- 16.2.1 Novartis AG
- 16.2.1.1. Overview
- 16.2.1.2. Products
- 16.2.1.3. SWOT Analysis
- 16.2.1.4. Recent Developments
- 16.2.1.5. Financials (Based on Availability)
- 16.2.2 Merck & Co Inc
- 16.2.2.1. Overview
- 16.2.2.2. Products
- 16.2.2.3. SWOT Analysis
- 16.2.2.4. Recent Developments
- 16.2.2.5. Financials (Based on Availability)
- 16.2.3 Takeda Pharmaceutical Company Limited
- 16.2.3.1. Overview
- 16.2.3.2. Products
- 16.2.3.3. SWOT Analysis
- 16.2.3.4. Recent Developments
- 16.2.3.5. Financials (Based on Availability)
- 16.2.4 Healx
- 16.2.4.1. Overview
- 16.2.4.2. Products
- 16.2.4.3. SWOT Analysis
- 16.2.4.4. Recent Developments
- 16.2.4.5. Financials (Based on Availability)
- 16.2.5 NFlection Therapeutics
- 16.2.5.1. Overview
- 16.2.5.2. Products
- 16.2.5.3. SWOT Analysis
- 16.2.5.4. Recent Developments
- 16.2.5.5. Financials (Based on Availability)
- 16.2.6 Recursion Pharmaceuticals
- 16.2.6.1. Overview
- 16.2.6.2. Products
- 16.2.6.3. SWOT Analysis
- 16.2.6.4. Recent Developments
- 16.2.6.5. Financials (Based on Availability)
- 16.2.7 SpringWorks Therapeutics
- 16.2.7.1. Overview
- 16.2.7.2. Products
- 16.2.7.3. SWOT Analysis
- 16.2.7.4. Recent Developments
- 16.2.7.5. Financials (Based on Availability)
- 16.2.8 AstraZeneca Pharmaceuticals
- 16.2.8.1. Overview
- 16.2.8.2. Products
- 16.2.8.3. SWOT Analysis
- 16.2.8.4. Recent Developments
- 16.2.8.5. Financials (Based on Availability)
- 16.2.9 Fosun Pharmaceutical
- 16.2.9.1. Overview
- 16.2.9.2. Products
- 16.2.9.3. SWOT Analysis
- 16.2.9.4. Recent Developments
- 16.2.9.5. Financials (Based on Availability)
- 16.2.10 Pfizer Inc
- 16.2.10.1. Overview
- 16.2.10.2. Products
- 16.2.10.3. SWOT Analysis
- 16.2.10.4. Recent Developments
- 16.2.10.5. Financials (Based on Availability)
- 16.2.1 Novartis AG
List of Figures
- Figure 1: Global Neurofibromatosis Drugs Market Revenue Breakdown (Million, %) by Region 2024 & 2032
- Figure 2: Global Neurofibromatosis Drugs Market Volume Breakdown (K Unit, %) by Region 2024 & 2032
- Figure 3: North America Neurofibromatosis Drugs Market Revenue (Million), by Country 2024 & 2032
- Figure 4: North America Neurofibromatosis Drugs Market Volume (K Unit), by Country 2024 & 2032
- Figure 5: North America Neurofibromatosis Drugs Market Revenue Share (%), by Country 2024 & 2032
- Figure 6: North America Neurofibromatosis Drugs Market Volume Share (%), by Country 2024 & 2032
- Figure 7: Europe Neurofibromatosis Drugs Market Revenue (Million), by Country 2024 & 2032
- Figure 8: Europe Neurofibromatosis Drugs Market Volume (K Unit), by Country 2024 & 2032
- Figure 9: Europe Neurofibromatosis Drugs Market Revenue Share (%), by Country 2024 & 2032
- Figure 10: Europe Neurofibromatosis Drugs Market Volume Share (%), by Country 2024 & 2032
- Figure 11: Asia Pacific Neurofibromatosis Drugs Market Revenue (Million), by Country 2024 & 2032
- Figure 12: Asia Pacific Neurofibromatosis Drugs Market Volume (K Unit), by Country 2024 & 2032
- Figure 13: Asia Pacific Neurofibromatosis Drugs Market Revenue Share (%), by Country 2024 & 2032
- Figure 14: Asia Pacific Neurofibromatosis Drugs Market Volume Share (%), by Country 2024 & 2032
- Figure 15: Middle East and Africa Neurofibromatosis Drugs Market Revenue (Million), by Country 2024 & 2032
- Figure 16: Middle East and Africa Neurofibromatosis Drugs Market Volume (K Unit), by Country 2024 & 2032
- Figure 17: Middle East and Africa Neurofibromatosis Drugs Market Revenue Share (%), by Country 2024 & 2032
- Figure 18: Middle East and Africa Neurofibromatosis Drugs Market Volume Share (%), by Country 2024 & 2032
- Figure 19: South America Neurofibromatosis Drugs Market Revenue (Million), by Country 2024 & 2032
- Figure 20: South America Neurofibromatosis Drugs Market Volume (K Unit), by Country 2024 & 2032
- Figure 21: South America Neurofibromatosis Drugs Market Revenue Share (%), by Country 2024 & 2032
- Figure 22: South America Neurofibromatosis Drugs Market Volume Share (%), by Country 2024 & 2032
- Figure 23: North America Neurofibromatosis Drugs Market Revenue (Million), by Disease Type 2024 & 2032
- Figure 24: North America Neurofibromatosis Drugs Market Volume (K Unit), by Disease Type 2024 & 2032
- Figure 25: North America Neurofibromatosis Drugs Market Revenue Share (%), by Disease Type 2024 & 2032
- Figure 26: North America Neurofibromatosis Drugs Market Volume Share (%), by Disease Type 2024 & 2032
- Figure 27: North America Neurofibromatosis Drugs Market Revenue (Million), by End User 2024 & 2032
- Figure 28: North America Neurofibromatosis Drugs Market Volume (K Unit), by End User 2024 & 2032
- Figure 29: North America Neurofibromatosis Drugs Market Revenue Share (%), by End User 2024 & 2032
- Figure 30: North America Neurofibromatosis Drugs Market Volume Share (%), by End User 2024 & 2032
- Figure 31: North America Neurofibromatosis Drugs Market Revenue (Million), by Country 2024 & 2032
- Figure 32: North America Neurofibromatosis Drugs Market Volume (K Unit), by Country 2024 & 2032
- Figure 33: North America Neurofibromatosis Drugs Market Revenue Share (%), by Country 2024 & 2032
- Figure 34: North America Neurofibromatosis Drugs Market Volume Share (%), by Country 2024 & 2032
- Figure 35: Europe Neurofibromatosis Drugs Market Revenue (Million), by Disease Type 2024 & 2032
- Figure 36: Europe Neurofibromatosis Drugs Market Volume (K Unit), by Disease Type 2024 & 2032
- Figure 37: Europe Neurofibromatosis Drugs Market Revenue Share (%), by Disease Type 2024 & 2032
- Figure 38: Europe Neurofibromatosis Drugs Market Volume Share (%), by Disease Type 2024 & 2032
- Figure 39: Europe Neurofibromatosis Drugs Market Revenue (Million), by End User 2024 & 2032
- Figure 40: Europe Neurofibromatosis Drugs Market Volume (K Unit), by End User 2024 & 2032
- Figure 41: Europe Neurofibromatosis Drugs Market Revenue Share (%), by End User 2024 & 2032
- Figure 42: Europe Neurofibromatosis Drugs Market Volume Share (%), by End User 2024 & 2032
- Figure 43: Europe Neurofibromatosis Drugs Market Revenue (Million), by Country 2024 & 2032
- Figure 44: Europe Neurofibromatosis Drugs Market Volume (K Unit), by Country 2024 & 2032
- Figure 45: Europe Neurofibromatosis Drugs Market Revenue Share (%), by Country 2024 & 2032
- Figure 46: Europe Neurofibromatosis Drugs Market Volume Share (%), by Country 2024 & 2032
- Figure 47: Asia Pacific Neurofibromatosis Drugs Market Revenue (Million), by Disease Type 2024 & 2032
- Figure 48: Asia Pacific Neurofibromatosis Drugs Market Volume (K Unit), by Disease Type 2024 & 2032
- Figure 49: Asia Pacific Neurofibromatosis Drugs Market Revenue Share (%), by Disease Type 2024 & 2032
- Figure 50: Asia Pacific Neurofibromatosis Drugs Market Volume Share (%), by Disease Type 2024 & 2032
- Figure 51: Asia Pacific Neurofibromatosis Drugs Market Revenue (Million), by End User 2024 & 2032
- Figure 52: Asia Pacific Neurofibromatosis Drugs Market Volume (K Unit), by End User 2024 & 2032
- Figure 53: Asia Pacific Neurofibromatosis Drugs Market Revenue Share (%), by End User 2024 & 2032
- Figure 54: Asia Pacific Neurofibromatosis Drugs Market Volume Share (%), by End User 2024 & 2032
- Figure 55: Asia Pacific Neurofibromatosis Drugs Market Revenue (Million), by Country 2024 & 2032
- Figure 56: Asia Pacific Neurofibromatosis Drugs Market Volume (K Unit), by Country 2024 & 2032
- Figure 57: Asia Pacific Neurofibromatosis Drugs Market Revenue Share (%), by Country 2024 & 2032
- Figure 58: Asia Pacific Neurofibromatosis Drugs Market Volume Share (%), by Country 2024 & 2032
- Figure 59: Middle East and Africa Neurofibromatosis Drugs Market Revenue (Million), by Disease Type 2024 & 2032
- Figure 60: Middle East and Africa Neurofibromatosis Drugs Market Volume (K Unit), by Disease Type 2024 & 2032
- Figure 61: Middle East and Africa Neurofibromatosis Drugs Market Revenue Share (%), by Disease Type 2024 & 2032
- Figure 62: Middle East and Africa Neurofibromatosis Drugs Market Volume Share (%), by Disease Type 2024 & 2032
- Figure 63: Middle East and Africa Neurofibromatosis Drugs Market Revenue (Million), by End User 2024 & 2032
- Figure 64: Middle East and Africa Neurofibromatosis Drugs Market Volume (K Unit), by End User 2024 & 2032
- Figure 65: Middle East and Africa Neurofibromatosis Drugs Market Revenue Share (%), by End User 2024 & 2032
- Figure 66: Middle East and Africa Neurofibromatosis Drugs Market Volume Share (%), by End User 2024 & 2032
- Figure 67: Middle East and Africa Neurofibromatosis Drugs Market Revenue (Million), by Country 2024 & 2032
- Figure 68: Middle East and Africa Neurofibromatosis Drugs Market Volume (K Unit), by Country 2024 & 2032
- Figure 69: Middle East and Africa Neurofibromatosis Drugs Market Revenue Share (%), by Country 2024 & 2032
- Figure 70: Middle East and Africa Neurofibromatosis Drugs Market Volume Share (%), by Country 2024 & 2032
- Figure 71: South America Neurofibromatosis Drugs Market Revenue (Million), by Disease Type 2024 & 2032
- Figure 72: South America Neurofibromatosis Drugs Market Volume (K Unit), by Disease Type 2024 & 2032
- Figure 73: South America Neurofibromatosis Drugs Market Revenue Share (%), by Disease Type 2024 & 2032
- Figure 74: South America Neurofibromatosis Drugs Market Volume Share (%), by Disease Type 2024 & 2032
- Figure 75: South America Neurofibromatosis Drugs Market Revenue (Million), by End User 2024 & 2032
- Figure 76: South America Neurofibromatosis Drugs Market Volume (K Unit), by End User 2024 & 2032
- Figure 77: South America Neurofibromatosis Drugs Market Revenue Share (%), by End User 2024 & 2032
- Figure 78: South America Neurofibromatosis Drugs Market Volume Share (%), by End User 2024 & 2032
- Figure 79: South America Neurofibromatosis Drugs Market Revenue (Million), by Country 2024 & 2032
- Figure 80: South America Neurofibromatosis Drugs Market Volume (K Unit), by Country 2024 & 2032
- Figure 81: South America Neurofibromatosis Drugs Market Revenue Share (%), by Country 2024 & 2032
- Figure 82: South America Neurofibromatosis Drugs Market Volume Share (%), by Country 2024 & 2032
List of Tables
- Table 1: Global Neurofibromatosis Drugs Market Revenue Million Forecast, by Region 2019 & 2032
- Table 2: Global Neurofibromatosis Drugs Market Volume K Unit Forecast, by Region 2019 & 2032
- Table 3: Global Neurofibromatosis Drugs Market Revenue Million Forecast, by Disease Type 2019 & 2032
- Table 4: Global Neurofibromatosis Drugs Market Volume K Unit Forecast, by Disease Type 2019 & 2032
- Table 5: Global Neurofibromatosis Drugs Market Revenue Million Forecast, by End User 2019 & 2032
- Table 6: Global Neurofibromatosis Drugs Market Volume K Unit Forecast, by End User 2019 & 2032
- Table 7: Global Neurofibromatosis Drugs Market Revenue Million Forecast, by Region 2019 & 2032
- Table 8: Global Neurofibromatosis Drugs Market Volume K Unit Forecast, by Region 2019 & 2032
- Table 9: Global Neurofibromatosis Drugs Market Revenue Million Forecast, by Country 2019 & 2032
- Table 10: Global Neurofibromatosis Drugs Market Volume K Unit Forecast, by Country 2019 & 2032
- Table 11: Global Neurofibromatosis Drugs Market Revenue Million Forecast, by Country 2019 & 2032
- Table 12: Global Neurofibromatosis Drugs Market Volume K Unit Forecast, by Country 2019 & 2032
- Table 13: Global Neurofibromatosis Drugs Market Revenue Million Forecast, by Country 2019 & 2032
- Table 14: Global Neurofibromatosis Drugs Market Volume K Unit Forecast, by Country 2019 & 2032
- Table 15: Global Neurofibromatosis Drugs Market Revenue Million Forecast, by Country 2019 & 2032
- Table 16: Global Neurofibromatosis Drugs Market Volume K Unit Forecast, by Country 2019 & 2032
- Table 17: Global Neurofibromatosis Drugs Market Revenue Million Forecast, by Country 2019 & 2032
- Table 18: Global Neurofibromatosis Drugs Market Volume K Unit Forecast, by Country 2019 & 2032
- Table 19: Global Neurofibromatosis Drugs Market Revenue Million Forecast, by Disease Type 2019 & 2032
- Table 20: Global Neurofibromatosis Drugs Market Volume K Unit Forecast, by Disease Type 2019 & 2032
- Table 21: Global Neurofibromatosis Drugs Market Revenue Million Forecast, by End User 2019 & 2032
- Table 22: Global Neurofibromatosis Drugs Market Volume K Unit Forecast, by End User 2019 & 2032
- Table 23: Global Neurofibromatosis Drugs Market Revenue Million Forecast, by Country 2019 & 2032
- Table 24: Global Neurofibromatosis Drugs Market Volume K Unit Forecast, by Country 2019 & 2032
- Table 25: United States Neurofibromatosis Drugs Market Revenue (Million) Forecast, by Application 2019 & 2032
- Table 26: United States Neurofibromatosis Drugs Market Volume (K Unit) Forecast, by Application 2019 & 2032
- Table 27: Canada Neurofibromatosis Drugs Market Revenue (Million) Forecast, by Application 2019 & 2032
- Table 28: Canada Neurofibromatosis Drugs Market Volume (K Unit) Forecast, by Application 2019 & 2032
- Table 29: Mexico Neurofibromatosis Drugs Market Revenue (Million) Forecast, by Application 2019 & 2032
- Table 30: Mexico Neurofibromatosis Drugs Market Volume (K Unit) Forecast, by Application 2019 & 2032
- Table 31: Global Neurofibromatosis Drugs Market Revenue Million Forecast, by Disease Type 2019 & 2032
- Table 32: Global Neurofibromatosis Drugs Market Volume K Unit Forecast, by Disease Type 2019 & 2032
- Table 33: Global Neurofibromatosis Drugs Market Revenue Million Forecast, by End User 2019 & 2032
- Table 34: Global Neurofibromatosis Drugs Market Volume K Unit Forecast, by End User 2019 & 2032
- Table 35: Global Neurofibromatosis Drugs Market Revenue Million Forecast, by Country 2019 & 2032
- Table 36: Global Neurofibromatosis Drugs Market Volume K Unit Forecast, by Country 2019 & 2032
- Table 37: Germany Neurofibromatosis Drugs Market Revenue (Million) Forecast, by Application 2019 & 2032
- Table 38: Germany Neurofibromatosis Drugs Market Volume (K Unit) Forecast, by Application 2019 & 2032
- Table 39: United Kingdom Neurofibromatosis Drugs Market Revenue (Million) Forecast, by Application 2019 & 2032
- Table 40: United Kingdom Neurofibromatosis Drugs Market Volume (K Unit) Forecast, by Application 2019 & 2032
- Table 41: France Neurofibromatosis Drugs Market Revenue (Million) Forecast, by Application 2019 & 2032
- Table 42: France Neurofibromatosis Drugs Market Volume (K Unit) Forecast, by Application 2019 & 2032
- Table 43: Italy Neurofibromatosis Drugs Market Revenue (Million) Forecast, by Application 2019 & 2032
- Table 44: Italy Neurofibromatosis Drugs Market Volume (K Unit) Forecast, by Application 2019 & 2032
- Table 45: Spain Neurofibromatosis Drugs Market Revenue (Million) Forecast, by Application 2019 & 2032
- Table 46: Spain Neurofibromatosis Drugs Market Volume (K Unit) Forecast, by Application 2019 & 2032
- Table 47: Rest of Europe Neurofibromatosis Drugs Market Revenue (Million) Forecast, by Application 2019 & 2032
- Table 48: Rest of Europe Neurofibromatosis Drugs Market Volume (K Unit) Forecast, by Application 2019 & 2032
- Table 49: Global Neurofibromatosis Drugs Market Revenue Million Forecast, by Disease Type 2019 & 2032
- Table 50: Global Neurofibromatosis Drugs Market Volume K Unit Forecast, by Disease Type 2019 & 2032
- Table 51: Global Neurofibromatosis Drugs Market Revenue Million Forecast, by End User 2019 & 2032
- Table 52: Global Neurofibromatosis Drugs Market Volume K Unit Forecast, by End User 2019 & 2032
- Table 53: Global Neurofibromatosis Drugs Market Revenue Million Forecast, by Country 2019 & 2032
- Table 54: Global Neurofibromatosis Drugs Market Volume K Unit Forecast, by Country 2019 & 2032
- Table 55: China Neurofibromatosis Drugs Market Revenue (Million) Forecast, by Application 2019 & 2032
- Table 56: China Neurofibromatosis Drugs Market Volume (K Unit) Forecast, by Application 2019 & 2032
- Table 57: Japan Neurofibromatosis Drugs Market Revenue (Million) Forecast, by Application 2019 & 2032
- Table 58: Japan Neurofibromatosis Drugs Market Volume (K Unit) Forecast, by Application 2019 & 2032
- Table 59: India Neurofibromatosis Drugs Market Revenue (Million) Forecast, by Application 2019 & 2032
- Table 60: India Neurofibromatosis Drugs Market Volume (K Unit) Forecast, by Application 2019 & 2032
- Table 61: Australia Neurofibromatosis Drugs Market Revenue (Million) Forecast, by Application 2019 & 2032
- Table 62: Australia Neurofibromatosis Drugs Market Volume (K Unit) Forecast, by Application 2019 & 2032
- Table 63: South Korea Neurofibromatosis Drugs Market Revenue (Million) Forecast, by Application 2019 & 2032
- Table 64: South Korea Neurofibromatosis Drugs Market Volume (K Unit) Forecast, by Application 2019 & 2032
- Table 65: Rest of Asia Pacific Neurofibromatosis Drugs Market Revenue (Million) Forecast, by Application 2019 & 2032
- Table 66: Rest of Asia Pacific Neurofibromatosis Drugs Market Volume (K Unit) Forecast, by Application 2019 & 2032
- Table 67: Global Neurofibromatosis Drugs Market Revenue Million Forecast, by Disease Type 2019 & 2032
- Table 68: Global Neurofibromatosis Drugs Market Volume K Unit Forecast, by Disease Type 2019 & 2032
- Table 69: Global Neurofibromatosis Drugs Market Revenue Million Forecast, by End User 2019 & 2032
- Table 70: Global Neurofibromatosis Drugs Market Volume K Unit Forecast, by End User 2019 & 2032
- Table 71: Global Neurofibromatosis Drugs Market Revenue Million Forecast, by Country 2019 & 2032
- Table 72: Global Neurofibromatosis Drugs Market Volume K Unit Forecast, by Country 2019 & 2032
- Table 73: GCC Neurofibromatosis Drugs Market Revenue (Million) Forecast, by Application 2019 & 2032
- Table 74: GCC Neurofibromatosis Drugs Market Volume (K Unit) Forecast, by Application 2019 & 2032
- Table 75: South Africa Neurofibromatosis Drugs Market Revenue (Million) Forecast, by Application 2019 & 2032
- Table 76: South Africa Neurofibromatosis Drugs Market Volume (K Unit) Forecast, by Application 2019 & 2032
- Table 77: Rest of Middle East and Africa Neurofibromatosis Drugs Market Revenue (Million) Forecast, by Application 2019 & 2032
- Table 78: Rest of Middle East and Africa Neurofibromatosis Drugs Market Volume (K Unit) Forecast, by Application 2019 & 2032
- Table 79: Global Neurofibromatosis Drugs Market Revenue Million Forecast, by Disease Type 2019 & 2032
- Table 80: Global Neurofibromatosis Drugs Market Volume K Unit Forecast, by Disease Type 2019 & 2032
- Table 81: Global Neurofibromatosis Drugs Market Revenue Million Forecast, by End User 2019 & 2032
- Table 82: Global Neurofibromatosis Drugs Market Volume K Unit Forecast, by End User 2019 & 2032
- Table 83: Global Neurofibromatosis Drugs Market Revenue Million Forecast, by Country 2019 & 2032
- Table 84: Global Neurofibromatosis Drugs Market Volume K Unit Forecast, by Country 2019 & 2032
- Table 85: Brazil Neurofibromatosis Drugs Market Revenue (Million) Forecast, by Application 2019 & 2032
- Table 86: Brazil Neurofibromatosis Drugs Market Volume (K Unit) Forecast, by Application 2019 & 2032
- Table 87: Argentina Neurofibromatosis Drugs Market Revenue (Million) Forecast, by Application 2019 & 2032
- Table 88: Argentina Neurofibromatosis Drugs Market Volume (K Unit) Forecast, by Application 2019 & 2032
- Table 89: Rest of South America Neurofibromatosis Drugs Market Revenue (Million) Forecast, by Application 2019 & 2032
- Table 90: Rest of South America Neurofibromatosis Drugs Market Volume (K Unit) Forecast, by Application 2019 & 2032
Frequently Asked Questions
1. What is the projected Compound Annual Growth Rate (CAGR) of the Neurofibromatosis Drugs Market?
The projected CAGR is approximately 14.54%.
2. Which companies are prominent players in the Neurofibromatosis Drugs Market?
Key companies in the market include Novartis AG, Merck & Co Inc, Takeda Pharmaceutical Company Limited, Healx, NFlection Therapeutics, Recursion Pharmaceuticals, SpringWorks Therapeutics, AstraZeneca Pharmaceuticals, Fosun Pharmaceutical, Pfizer Inc.
3. What are the main segments of the Neurofibromatosis Drugs Market?
The market segments include Disease Type, End User.
4. Can you provide details about the market size?
The market size is estimated to be USD 3.15 Million as of 2022.
5. What are some drivers contributing to market growth?
Increased Focus on Research and Development of Novel Therapies; Support from Regulatory Authorities.
6. What are the notable trends driving market growth?
Neurofibromatosis Type 1 (NF1) is Expected to Show Healthy Market Growth During the Forecast Period.
7. Are there any restraints impacting market growth?
Difficulty in Conducting Clinical Trials for Pediatric Population; Low treatment Rate in Developing Countries due to Lack of Treatment Options.
8. Can you provide examples of recent developments in the market?
April 2024: Healx entered an investment agreement with the Children's Tumor Foundation (CTF). This partnership will support the advancement of Healx's AI-powered neurofibromatosis strategy, including its lead molecule, HLX-1502, which is about to enter a Phase 2 clinical trial.
9. What pricing options are available for accessing the report?
Pricing options include single-user, multi-user, and enterprise licenses priced at USD 4750, USD 5250, and USD 8750 respectively.
10. Is the market size provided in terms of value or volume?
The market size is provided in terms of value, measured in Million and volume, measured in K Unit.
11. Are there any specific market keywords associated with the report?
Yes, the market keyword associated with the report is "Neurofibromatosis Drugs Market," which aids in identifying and referencing the specific market segment covered.
12. How do I determine which pricing option suits my needs best?
The pricing options vary based on user requirements and access needs. Individual users may opt for single-user licenses, while businesses requiring broader access may choose multi-user or enterprise licenses for cost-effective access to the report.
13. Are there any additional resources or data provided in the Neurofibromatosis Drugs Market report?
While the report offers comprehensive insights, it's advisable to review the specific contents or supplementary materials provided to ascertain if additional resources or data are available.
14. How can I stay updated on further developments or reports in the Neurofibromatosis Drugs Market?
To stay informed about further developments, trends, and reports in the Neurofibromatosis Drugs Market, consider subscribing to industry newsletters, following relevant companies and organizations, or regularly checking reputable industry news sources and publications.
Methodology
Step 1 - Identification of Relevant Samples Size from Population Database


Step 2 - Approaches for Defining Global Market Size (Value, Volume* & Price*)

Note*: In applicable scenarios
Step 3 - Data Sources
Primary Research
- Web Analytics
- Survey Reports
- Research Institute
- Latest Research Reports
- Opinion Leaders
Secondary Research
- Annual Reports
- White Paper
- Latest Press Release
- Industry Association
- Paid Database
- Investor Presentations

Step 4 - Data Triangulation
Involves using different sources of information in order to increase the validity of a study
These sources are likely to be stakeholders in a program - participants, other researchers, program staff, other community members, and so on.
Then we put all data in single framework & apply various statistical tools to find out the dynamic on the market.
During the analysis stage, feedback from the stakeholder groups would be compared to determine areas of agreement as well as areas of divergence


