
Key Insights
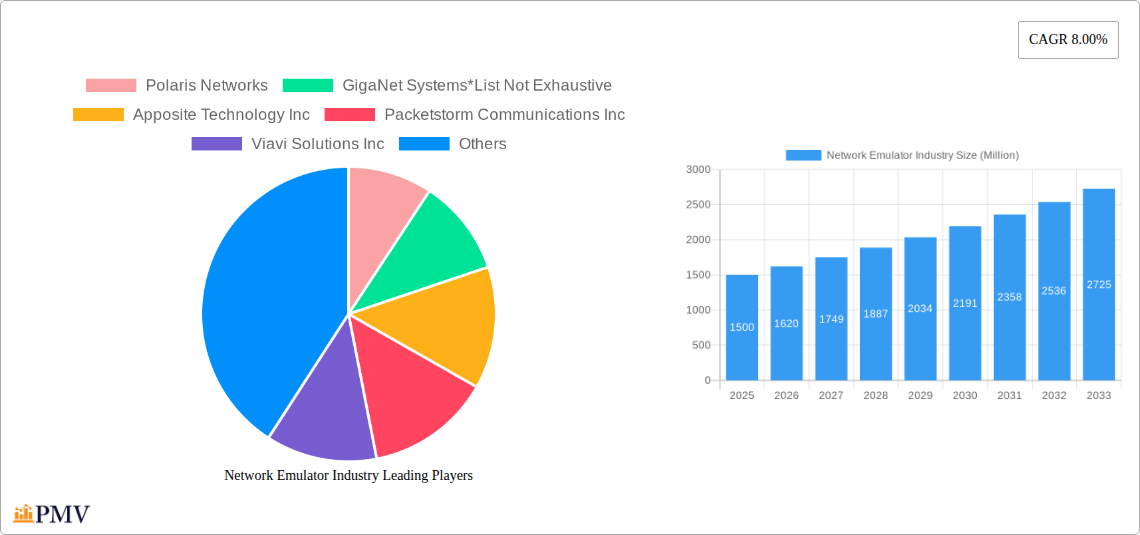
The Network Emulator market, valued at approximately $1.5 billion in 2025, is experiencing robust growth, projected to expand at a compound annual growth rate (CAGR) of 8% from 2025 to 2033. This expansion is fueled by several key drivers. The increasing complexity of modern networks, driven by the adoption of 5G, cloud computing, and the Internet of Things (IoT), necessitates sophisticated testing and simulation capabilities offered by network emulators. Furthermore, the rising demand for network security testing and optimization across various sectors, including telecommunications and defense, is significantly contributing to market growth. The emergence of software-defined networking (SDN) and network function virtualization (NFV) also presents substantial opportunities for network emulator vendors, as these technologies require extensive testing and validation. While the market faces some restraints such as high initial investment costs and the need for specialized expertise, the overall outlook remains positive, with continuous technological advancements and increasing regulatory compliance mandates driving further adoption.
The market is segmented by component (hardware and software) and end-user vertical (telecommunication, defense, and other verticals). The telecommunications sector currently holds the largest market share, owing to the intense need for rigorous testing of network infrastructure before deployment. However, the defense and other verticals, including finance and automotive, are exhibiting significant growth potential, driven by the rising adoption of advanced network technologies within their operations. Key players in this competitive landscape include Polaris Networks, GigaNet Systems, Apposite Technology Inc., Packetstorm Communications Inc., Viavi Solutions Inc., Spirent Communications Inc., Keysight Technologies Inc., Aukua Systems Inc., iTrinegy, and InterWorking Labs. Geographic expansion is also a key trend, with North America expected to maintain a leading position due to high technological advancements and early adoption. However, the Asia-Pacific region is projected to witness the fastest growth rate, driven by rising infrastructure investments and increasing network deployments.
Network Emulator Industry Market Report: 2019-2033
This comprehensive report provides a detailed analysis of the Network Emulator industry, offering invaluable insights for businesses, investors, and researchers. The study covers the period from 2019 to 2033, with a base year of 2025 and a forecast period extending to 2033. The report meticulously examines market size, segmentation, competitive dynamics, and future growth potential, providing actionable intelligence for strategic decision-making. The market is projected to reach xx Million by 2033, exhibiting a CAGR of xx% during the forecast period.
Network Emulator Industry Market Structure & Competitive Dynamics
The Network Emulator market is characterized by a moderately consolidated structure, with several key players holding significant market share. The industry is witnessing increasing innovation, driven by advancements in software-defined networking (SDN), network function virtualization (NFV), and 5G technologies. Regulatory frameworks, particularly concerning cybersecurity and data privacy, significantly influence market dynamics. Product substitutes, such as cloud-based simulation platforms, are gaining traction, posing a challenge to traditional emulator vendors. End-user trends, particularly the increasing adoption of network emulation in testing and development of next-generation networks, are driving market growth. Mergers and acquisitions (M&A) activity is relatively moderate, with deal values ranging from xx Million to xx Million in recent years.
- Market Concentration: The top 5 players account for approximately xx% of the market share in 2025.
- Innovation Ecosystems: Collaboration between vendors and research institutions is driving innovation in network emulation technologies.
- Regulatory Frameworks: Compliance with data privacy regulations is a key consideration for vendors.
- M&A Activity: Recent M&A activities have focused on expanding product portfolios and geographic reach.
Network Emulator Industry Industry Trends & Insights
The Network Emulator market is experiencing robust growth, driven by several key factors. The increasing complexity of modern networks necessitates sophisticated testing and validation solutions, fueling demand for network emulators. The proliferation of 5G networks and the expansion of IoT devices are creating a significant need for robust network emulation capabilities. Technological advancements, such as the integration of AI and machine learning, are enhancing the capabilities of network emulators, leading to improved accuracy and efficiency. Consumer preferences are shifting towards cloud-based solutions, offering scalability and cost-effectiveness. Competitive dynamics are characterized by ongoing innovation, strategic partnerships, and product differentiation.
- Market Growth Drivers: 5G rollout, IoT growth, increasing network complexity, and demand for advanced testing capabilities.
- Technological Disruptions: Cloud-based emulation, AI/ML integration, and software-defined networking (SDN) are transforming the market.
- Consumer Preferences: Demand for scalable, cost-effective, and cloud-based solutions is on the rise.
- Competitive Dynamics: Intense competition among established players and emerging vendors is driving innovation and price reductions.

Dominant Markets & Segments in Network Emulator Industry
The North American region currently dominates the Network Emulator market, driven by strong technological advancements, a robust defense sector, and high adoption rates in the telecommunications industry. Within the component segment, the software segment holds a larger market share than the hardware segment due to its flexibility and scalability. The telecommunications industry remains the largest end-user vertical, followed by the defense and other end-user verticals.
- Key Drivers of North American Dominance: Strong R&D investment, advanced infrastructure, and a high concentration of key players.
- Hardware Segment: Growth is driven by the need for high-performance emulation for complex network environments.
- Software Segment: Growing preference for flexible, scalable, and cost-effective software-based solutions.
- Telecommunication Vertical: High demand from telecom operators for testing and validating 5G and other next-generation networks.
- Defense Vertical: Significant investment in network security and simulation for defense applications.
Network Emulator Industry Product Innovations
Recent product innovations focus on enhancing the accuracy, scalability, and usability of network emulators. The integration of AI and machine learning is enabling more realistic and sophisticated network simulations. Cloud-based solutions are gaining popularity, providing greater flexibility and cost-effectiveness. The development of emulators specifically designed for 5G and IoT testing is driving market growth. These advancements improve testing efficiency and reduce time-to-market for new network technologies.
Report Segmentation & Scope
This report segments the Network Emulator market by component (hardware and software) and end-user vertical (telecommunication, defense, and other). Each segment is analyzed in detail, providing insights into market size, growth projections, and competitive dynamics. The telecommunication segment is expected to show robust growth during the forecast period. The software component segment is predicted to exhibit faster growth compared to the hardware segment, driven by cloud adoption and software-defined networking trends. The 'other' end-user vertical encompasses sectors like education and research, and is anticipated to exhibit steady growth.
Key Drivers of Network Emulator Industry Growth
The Network Emulator industry's growth is fueled by several key factors: the increasing complexity of network architectures demanding rigorous testing, the burgeoning adoption of 5G and IoT technologies, the rising need for network security testing, the expanding use of network virtualization and cloud computing, and supportive government regulations promoting digital infrastructure development. These factors collectively drive demand for advanced network emulation solutions.
Challenges in the Network Emulator Industry Sector
The Network Emulator industry faces certain challenges including the high initial investment costs associated with implementing network emulation solutions, maintaining the accuracy of emulation against evolving network technologies, and ensuring the security of sensitive network data during testing. The industry also faces competitive pressures from emerging vendors offering innovative solutions and the need to comply with ever-changing regulatory requirements. These factors can potentially restrain market growth.
Leading Players in the Network Emulator Industry Market
- Polaris Networks
- GigaNet Systems
- Apposite Technology Inc
- Packetstorm Communications Inc
- Viavi Solutions Inc
- Spirent Communications Inc
- Keysight Technologies Inc
- Aukua Systems Inc
- iTrinegy
- InterWorking Labs
Key Developments in Network Emulator Industry Sector
- 2023-Q2: Viavi Solutions launched a new network emulator with advanced 5G capabilities.
- 2022-Q4: Spirent Communications acquired a smaller network emulator vendor, expanding its product portfolio.
- 2021-Q3: Keysight Technologies announced a strategic partnership to integrate AI capabilities into its network emulation platform. (Further specific examples with dates and impacts would be added here in a full report.)
Strategic Network Emulator Industry Market Outlook
The Network Emulator market is poised for sustained growth, driven by the ongoing expansion of 5G and IoT networks, the increasing demand for advanced network testing solutions, and the emergence of new technological advancements such as AI and machine learning integration. Strategic opportunities exist in developing cloud-based solutions, improving the accuracy and efficiency of emulation, and expanding into emerging markets. Focusing on niche applications, like the automotive and industrial automation sectors, may also open new avenues for growth.
Network Emulator Industry Segmentation
-
1. Component
- 1.1. Hardware
- 1.2. Software
-
2. End-user Vertical
- 2.1. Telecommunication
- 2.2. Defense
- 2.3. Other End-user Verticals
Network Emulator Industry Segmentation By Geography
- 1. North America
- 2. Europe
- 3. Asia Pacific
- 4. Rest of the World

Network Emulator Industry REPORT HIGHLIGHTS
| Aspects | Details |
|---|---|
| Study Period | 2019-2033 |
| Base Year | 2024 |
| Estimated Year | 2025 |
| Forecast Period | 2025-2033 |
| Historical Period | 2019-2024 |
| Growth Rate | CAGR of 8.00% from 2019-2033 |
| Segmentation |
|
Table of Contents
- 1. Introduction
- 1.1. Research Scope
- 1.2. Market Segmentation
- 1.3. Research Methodology
- 1.4. Definitions and Assumptions
- 2. Executive Summary
- 2.1. Introduction
- 3. Market Dynamics
- 3.1. Introduction
- 3.2. Market Drivers
- 3.2.1. ; Advancements and Growth in 5G Testing
- 3.3. Market Restrains
- 3.3.1 ; RF Design
- 3.3.2 Flexibility and Size Issues of the Equipment; Evolving RF Standards
- 3.4. Market Trends
- 3.4.1. Telecommunication Vertical is Expected to Show a Significant Growth Over the Forecast period
- 4. Market Factor Analysis
- 4.1. Porters Five Forces
- 4.2. Supply/Value Chain
- 4.3. PESTEL analysis
- 4.4. Market Entropy
- 4.5. Patent/Trademark Analysis
- 5. Global Network Emulator Industry Analysis, Insights and Forecast, 2019-2031
- 5.1. Market Analysis, Insights and Forecast - by Component
- 5.1.1. Hardware
- 5.1.2. Software
- 5.2. Market Analysis, Insights and Forecast - by End-user Vertical
- 5.2.1. Telecommunication
- 5.2.2. Defense
- 5.2.3. Other End-user Verticals
- 5.3. Market Analysis, Insights and Forecast - by Region
- 5.3.1. North America
- 5.3.2. Europe
- 5.3.3. Asia Pacific
- 5.3.4. Rest of the World
- 5.1. Market Analysis, Insights and Forecast - by Component
- 6. North America Network Emulator Industry Analysis, Insights and Forecast, 2019-2031
- 6.1. Market Analysis, Insights and Forecast - by Component
- 6.1.1. Hardware
- 6.1.2. Software
- 6.2. Market Analysis, Insights and Forecast - by End-user Vertical
- 6.2.1. Telecommunication
- 6.2.2. Defense
- 6.2.3. Other End-user Verticals
- 6.1. Market Analysis, Insights and Forecast - by Component
- 7. Europe Network Emulator Industry Analysis, Insights and Forecast, 2019-2031
- 7.1. Market Analysis, Insights and Forecast - by Component
- 7.1.1. Hardware
- 7.1.2. Software
- 7.2. Market Analysis, Insights and Forecast - by End-user Vertical
- 7.2.1. Telecommunication
- 7.2.2. Defense
- 7.2.3. Other End-user Verticals
- 7.1. Market Analysis, Insights and Forecast - by Component
- 8. Asia Pacific Network Emulator Industry Analysis, Insights and Forecast, 2019-2031
- 8.1. Market Analysis, Insights and Forecast - by Component
- 8.1.1. Hardware
- 8.1.2. Software
- 8.2. Market Analysis, Insights and Forecast - by End-user Vertical
- 8.2.1. Telecommunication
- 8.2.2. Defense
- 8.2.3. Other End-user Verticals
- 8.1. Market Analysis, Insights and Forecast - by Component
- 9. Rest of the World Network Emulator Industry Analysis, Insights and Forecast, 2019-2031
- 9.1. Market Analysis, Insights and Forecast - by Component
- 9.1.1. Hardware
- 9.1.2. Software
- 9.2. Market Analysis, Insights and Forecast - by End-user Vertical
- 9.2.1. Telecommunication
- 9.2.2. Defense
- 9.2.3. Other End-user Verticals
- 9.1. Market Analysis, Insights and Forecast - by Component
- 10. North America Network Emulator Industry Analysis, Insights and Forecast, 2019-2031
- 10.1. Market Analysis, Insights and Forecast - By Country/Sub-region
- 10.1.1.
- 11. Europe Network Emulator Industry Analysis, Insights and Forecast, 2019-2031
- 11.1. Market Analysis, Insights and Forecast - By Country/Sub-region
- 11.1.1.
- 12. Asia Pacific Network Emulator Industry Analysis, Insights and Forecast, 2019-2031
- 12.1. Market Analysis, Insights and Forecast - By Country/Sub-region
- 12.1.1.
- 13. Rest of the World Network Emulator Industry Analysis, Insights and Forecast, 2019-2031
- 13.1. Market Analysis, Insights and Forecast - By Country/Sub-region
- 13.1.1.
- 14. Competitive Analysis
- 14.1. Global Market Share Analysis 2024
- 14.2. Company Profiles
- 14.2.1 Polaris Networks
- 14.2.1.1. Overview
- 14.2.1.2. Products
- 14.2.1.3. SWOT Analysis
- 14.2.1.4. Recent Developments
- 14.2.1.5. Financials (Based on Availability)
- 14.2.2 GigaNet Systems*List Not Exhaustive
- 14.2.2.1. Overview
- 14.2.2.2. Products
- 14.2.2.3. SWOT Analysis
- 14.2.2.4. Recent Developments
- 14.2.2.5. Financials (Based on Availability)
- 14.2.3 Apposite Technology Inc
- 14.2.3.1. Overview
- 14.2.3.2. Products
- 14.2.3.3. SWOT Analysis
- 14.2.3.4. Recent Developments
- 14.2.3.5. Financials (Based on Availability)
- 14.2.4 Packetstorm Communications Inc
- 14.2.4.1. Overview
- 14.2.4.2. Products
- 14.2.4.3. SWOT Analysis
- 14.2.4.4. Recent Developments
- 14.2.4.5. Financials (Based on Availability)
- 14.2.5 Viavi Solutions Inc
- 14.2.5.1. Overview
- 14.2.5.2. Products
- 14.2.5.3. SWOT Analysis
- 14.2.5.4. Recent Developments
- 14.2.5.5. Financials (Based on Availability)
- 14.2.6 Spirent Communications Inc
- 14.2.6.1. Overview
- 14.2.6.2. Products
- 14.2.6.3. SWOT Analysis
- 14.2.6.4. Recent Developments
- 14.2.6.5. Financials (Based on Availability)
- 14.2.7 Keysight Technologies Inc
- 14.2.7.1. Overview
- 14.2.7.2. Products
- 14.2.7.3. SWOT Analysis
- 14.2.7.4. Recent Developments
- 14.2.7.5. Financials (Based on Availability)
- 14.2.8 Aukua Systems Inc
- 14.2.8.1. Overview
- 14.2.8.2. Products
- 14.2.8.3. SWOT Analysis
- 14.2.8.4. Recent Developments
- 14.2.8.5. Financials (Based on Availability)
- 14.2.9 iTrinegy
- 14.2.9.1. Overview
- 14.2.9.2. Products
- 14.2.9.3. SWOT Analysis
- 14.2.9.4. Recent Developments
- 14.2.9.5. Financials (Based on Availability)
- 14.2.10 InterWorking Labs
- 14.2.10.1. Overview
- 14.2.10.2. Products
- 14.2.10.3. SWOT Analysis
- 14.2.10.4. Recent Developments
- 14.2.10.5. Financials (Based on Availability)
- 14.2.1 Polaris Networks
List of Figures
- Figure 1: Global Network Emulator Industry Revenue Breakdown (Million, %) by Region 2024 & 2032
- Figure 2: North America Network Emulator Industry Revenue (Million), by Country 2024 & 2032
- Figure 3: North America Network Emulator Industry Revenue Share (%), by Country 2024 & 2032
- Figure 4: Europe Network Emulator Industry Revenue (Million), by Country 2024 & 2032
- Figure 5: Europe Network Emulator Industry Revenue Share (%), by Country 2024 & 2032
- Figure 6: Asia Pacific Network Emulator Industry Revenue (Million), by Country 2024 & 2032
- Figure 7: Asia Pacific Network Emulator Industry Revenue Share (%), by Country 2024 & 2032
- Figure 8: Rest of the World Network Emulator Industry Revenue (Million), by Country 2024 & 2032
- Figure 9: Rest of the World Network Emulator Industry Revenue Share (%), by Country 2024 & 2032
- Figure 10: North America Network Emulator Industry Revenue (Million), by Component 2024 & 2032
- Figure 11: North America Network Emulator Industry Revenue Share (%), by Component 2024 & 2032
- Figure 12: North America Network Emulator Industry Revenue (Million), by End-user Vertical 2024 & 2032
- Figure 13: North America Network Emulator Industry Revenue Share (%), by End-user Vertical 2024 & 2032
- Figure 14: North America Network Emulator Industry Revenue (Million), by Country 2024 & 2032
- Figure 15: North America Network Emulator Industry Revenue Share (%), by Country 2024 & 2032
- Figure 16: Europe Network Emulator Industry Revenue (Million), by Component 2024 & 2032
- Figure 17: Europe Network Emulator Industry Revenue Share (%), by Component 2024 & 2032
- Figure 18: Europe Network Emulator Industry Revenue (Million), by End-user Vertical 2024 & 2032
- Figure 19: Europe Network Emulator Industry Revenue Share (%), by End-user Vertical 2024 & 2032
- Figure 20: Europe Network Emulator Industry Revenue (Million), by Country 2024 & 2032
- Figure 21: Europe Network Emulator Industry Revenue Share (%), by Country 2024 & 2032
- Figure 22: Asia Pacific Network Emulator Industry Revenue (Million), by Component 2024 & 2032
- Figure 23: Asia Pacific Network Emulator Industry Revenue Share (%), by Component 2024 & 2032
- Figure 24: Asia Pacific Network Emulator Industry Revenue (Million), by End-user Vertical 2024 & 2032
- Figure 25: Asia Pacific Network Emulator Industry Revenue Share (%), by End-user Vertical 2024 & 2032
- Figure 26: Asia Pacific Network Emulator Industry Revenue (Million), by Country 2024 & 2032
- Figure 27: Asia Pacific Network Emulator Industry Revenue Share (%), by Country 2024 & 2032
- Figure 28: Rest of the World Network Emulator Industry Revenue (Million), by Component 2024 & 2032
- Figure 29: Rest of the World Network Emulator Industry Revenue Share (%), by Component 2024 & 2032
- Figure 30: Rest of the World Network Emulator Industry Revenue (Million), by End-user Vertical 2024 & 2032
- Figure 31: Rest of the World Network Emulator Industry Revenue Share (%), by End-user Vertical 2024 & 2032
- Figure 32: Rest of the World Network Emulator Industry Revenue (Million), by Country 2024 & 2032
- Figure 33: Rest of the World Network Emulator Industry Revenue Share (%), by Country 2024 & 2032
List of Tables
- Table 1: Global Network Emulator Industry Revenue Million Forecast, by Region 2019 & 2032
- Table 2: Global Network Emulator Industry Revenue Million Forecast, by Component 2019 & 2032
- Table 3: Global Network Emulator Industry Revenue Million Forecast, by End-user Vertical 2019 & 2032
- Table 4: Global Network Emulator Industry Revenue Million Forecast, by Region 2019 & 2032
- Table 5: Global Network Emulator Industry Revenue Million Forecast, by Country 2019 & 2032
- Table 6: Network Emulator Industry Revenue (Million) Forecast, by Application 2019 & 2032
- Table 7: Global Network Emulator Industry Revenue Million Forecast, by Country 2019 & 2032
- Table 8: Network Emulator Industry Revenue (Million) Forecast, by Application 2019 & 2032
- Table 9: Global Network Emulator Industry Revenue Million Forecast, by Country 2019 & 2032
- Table 10: Network Emulator Industry Revenue (Million) Forecast, by Application 2019 & 2032
- Table 11: Global Network Emulator Industry Revenue Million Forecast, by Country 2019 & 2032
- Table 12: Network Emulator Industry Revenue (Million) Forecast, by Application 2019 & 2032
- Table 13: Global Network Emulator Industry Revenue Million Forecast, by Component 2019 & 2032
- Table 14: Global Network Emulator Industry Revenue Million Forecast, by End-user Vertical 2019 & 2032
- Table 15: Global Network Emulator Industry Revenue Million Forecast, by Country 2019 & 2032
- Table 16: Global Network Emulator Industry Revenue Million Forecast, by Component 2019 & 2032
- Table 17: Global Network Emulator Industry Revenue Million Forecast, by End-user Vertical 2019 & 2032
- Table 18: Global Network Emulator Industry Revenue Million Forecast, by Country 2019 & 2032
- Table 19: Global Network Emulator Industry Revenue Million Forecast, by Component 2019 & 2032
- Table 20: Global Network Emulator Industry Revenue Million Forecast, by End-user Vertical 2019 & 2032
- Table 21: Global Network Emulator Industry Revenue Million Forecast, by Country 2019 & 2032
- Table 22: Global Network Emulator Industry Revenue Million Forecast, by Component 2019 & 2032
- Table 23: Global Network Emulator Industry Revenue Million Forecast, by End-user Vertical 2019 & 2032
- Table 24: Global Network Emulator Industry Revenue Million Forecast, by Country 2019 & 2032
Frequently Asked Questions
1. What is the projected Compound Annual Growth Rate (CAGR) of the Network Emulator Industry?
The projected CAGR is approximately 8.00%.
2. Which companies are prominent players in the Network Emulator Industry?
Key companies in the market include Polaris Networks, GigaNet Systems*List Not Exhaustive, Apposite Technology Inc, Packetstorm Communications Inc, Viavi Solutions Inc, Spirent Communications Inc, Keysight Technologies Inc, Aukua Systems Inc, iTrinegy, InterWorking Labs.
3. What are the main segments of the Network Emulator Industry?
The market segments include Component, End-user Vertical.
4. Can you provide details about the market size?
The market size is estimated to be USD XX Million as of 2022.
5. What are some drivers contributing to market growth?
; Advancements and Growth in 5G Testing.
6. What are the notable trends driving market growth?
Telecommunication Vertical is Expected to Show a Significant Growth Over the Forecast period.
7. Are there any restraints impacting market growth?
; RF Design. Flexibility and Size Issues of the Equipment; Evolving RF Standards.
8. Can you provide examples of recent developments in the market?
N/A
9. What pricing options are available for accessing the report?
Pricing options include single-user, multi-user, and enterprise licenses priced at USD 4750, USD 5250, and USD 8750 respectively.
10. Is the market size provided in terms of value or volume?
The market size is provided in terms of value, measured in Million.
11. Are there any specific market keywords associated with the report?
Yes, the market keyword associated with the report is "Network Emulator Industry," which aids in identifying and referencing the specific market segment covered.
12. How do I determine which pricing option suits my needs best?
The pricing options vary based on user requirements and access needs. Individual users may opt for single-user licenses, while businesses requiring broader access may choose multi-user or enterprise licenses for cost-effective access to the report.
13. Are there any additional resources or data provided in the Network Emulator Industry report?
While the report offers comprehensive insights, it's advisable to review the specific contents or supplementary materials provided to ascertain if additional resources or data are available.
14. How can I stay updated on further developments or reports in the Network Emulator Industry?
To stay informed about further developments, trends, and reports in the Network Emulator Industry, consider subscribing to industry newsletters, following relevant companies and organizations, or regularly checking reputable industry news sources and publications.
Methodology
Step 1 - Identification of Relevant Samples Size from Population Database


Step 2 - Approaches for Defining Global Market Size (Value, Volume* & Price*)

Note*: In applicable scenarios
Step 3 - Data Sources
Primary Research
- Web Analytics
- Survey Reports
- Research Institute
- Latest Research Reports
- Opinion Leaders
Secondary Research
- Annual Reports
- White Paper
- Latest Press Release
- Industry Association
- Paid Database
- Investor Presentations

Step 4 - Data Triangulation
Involves using different sources of information in order to increase the validity of a study
These sources are likely to be stakeholders in a program - participants, other researchers, program staff, other community members, and so on.
Then we put all data in single framework & apply various statistical tools to find out the dynamic on the market.
During the analysis stage, feedback from the stakeholder groups would be compared to determine areas of agreement as well as areas of divergence


