
Key Insights
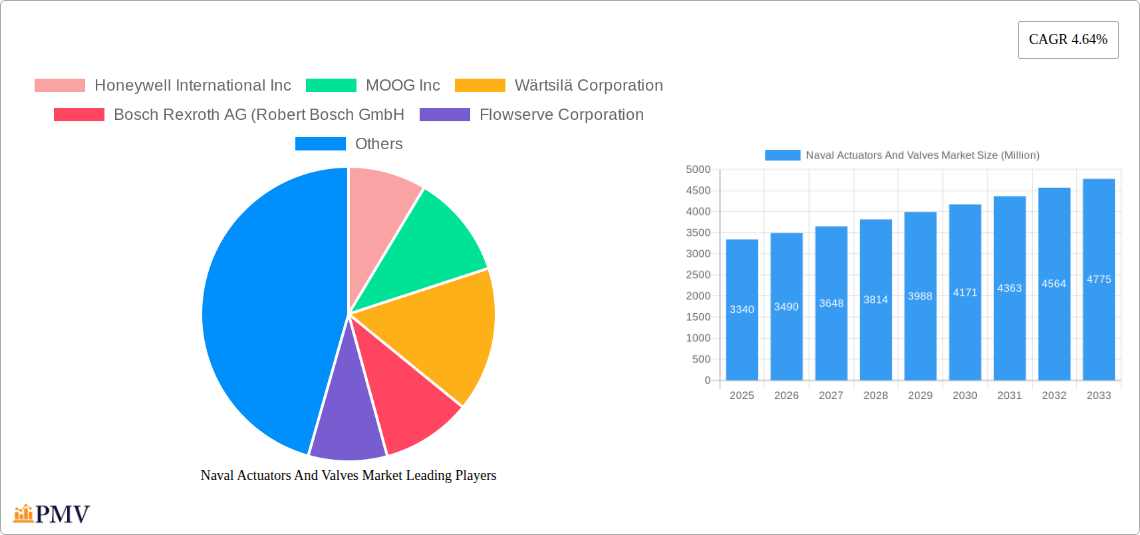
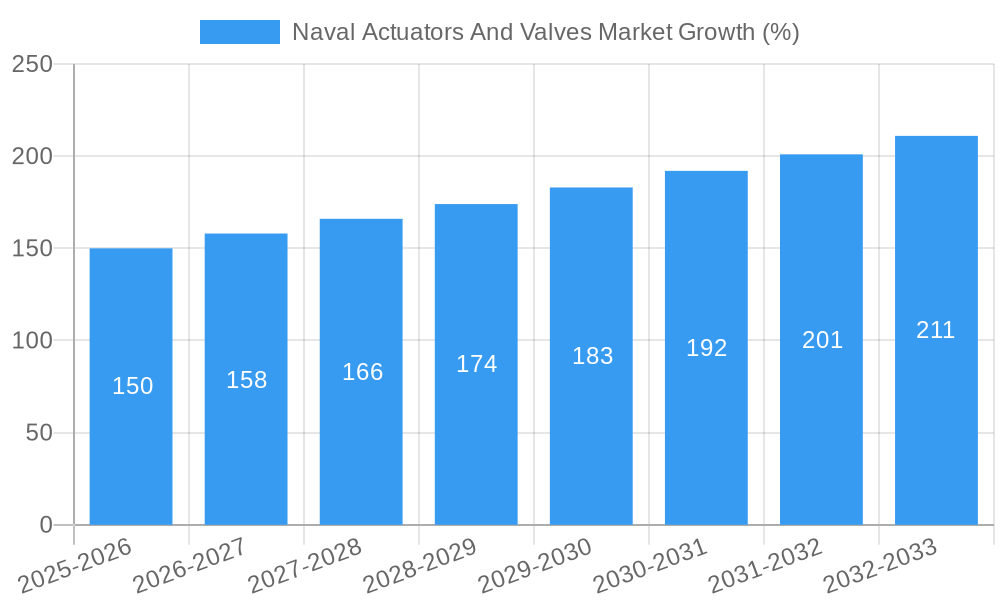
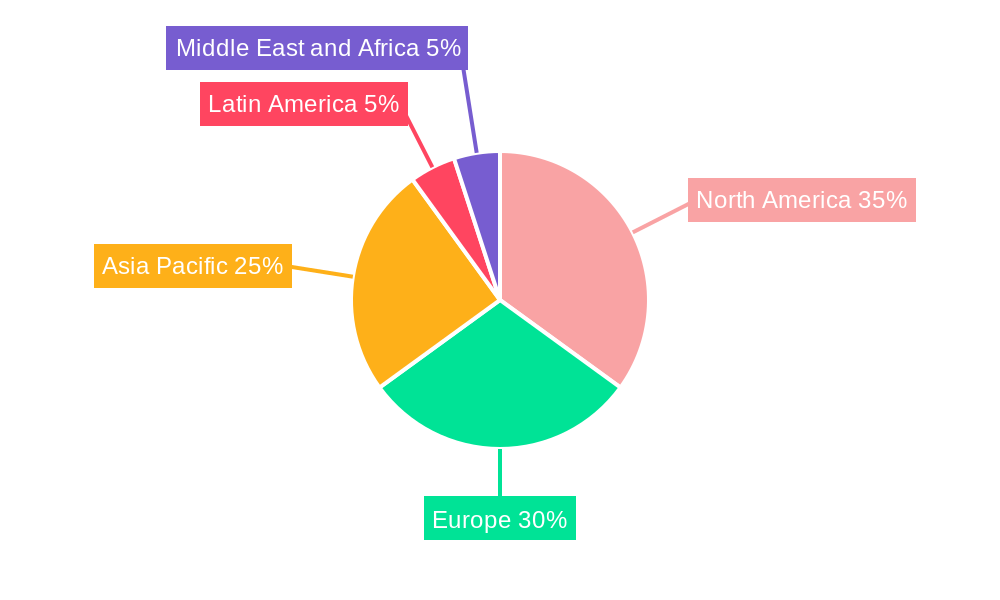
The Naval Actuators and Valves market, valued at $3.34 billion in 2025, is projected to experience robust growth, driven by increasing naval modernization programs globally and a rising demand for advanced automation systems in naval vessels. The market's Compound Annual Growth Rate (CAGR) of 4.64% from 2025 to 2033 reflects a steady expansion fueled by technological advancements in actuator types (mechanical, hydraulic, pneumatic, electrical, and hybrid) and material choices (aluminum, stainless steel, and alloy-based). Key trends include the integration of sophisticated control systems, enhancing efficiency and operational reliability, and a growing focus on miniaturization and lightweight designs for improved vessel maneuverability and fuel efficiency. However, the market faces challenges such as stringent regulatory compliance requirements and high initial investment costs associated with advanced actuator and valve technologies. The segment breakdown reveals a diverse landscape, with the defense sector dominating, while commercial applications show potential for growth as maritime technologies evolve. North America and Europe are expected to maintain significant market share due to established naval industries and ongoing modernization initiatives. Asia-Pacific is poised for significant growth driven by increasing naval spending in countries like China and India. Major players like Honeywell, Moog, and Wärtsilä are leading the innovation and technological advancements, driving competition and shaping the market landscape.
The competitive landscape features established players and specialized manufacturers, highlighting the need for strategic partnerships and technological differentiation to thrive. Future growth will depend on continued innovation in materials and actuator types, alongside the development of robust, reliable systems that can withstand harsh maritime environments. The focus on enhancing operational efficiency, reducing maintenance costs, and improving safety will be key factors driving demand in the coming years. Specific material and actuator type adoption rates will vary regionally, influenced by specific naval modernization priorities and technological preferences. The market's evolution will likely involve increasing integration of digital technologies such as remote diagnostics and predictive maintenance, further enhancing the operational efficiency and reliability of naval vessels.
Naval Actuators and Valves Market: A Comprehensive Report (2019-2033)
This in-depth report provides a comprehensive analysis of the global Naval Actuators and Valves market, offering invaluable insights for stakeholders across the industry. Covering the period from 2019 to 2033, with a focus on 2025 as the base and estimated year, this report meticulously examines market dynamics, competitive landscapes, and future growth projections. The study period spans the historical period (2019-2024), base year (2025), and forecast period (2025-2033), providing a complete picture of market evolution.
Naval Actuators And Valves Market Market Structure & Competitive Dynamics
This section delves into the intricate structure of the naval actuators and valves market, analyzing market concentration, innovation ecosystems, and regulatory frameworks. The competitive landscape is intensely scrutinized, encompassing an examination of M&A activities, product substitutes, and evolving end-user trends. The report quantifies market share for key players, revealing the dominance hierarchy within this specialized sector. Data on recent M&A deals, including their values (in Millions), provides context for strategic shifts and consolidation within the market. For example, the market concentration is currently estimated at xx%, with the top 5 players holding a combined xx% market share in 2024. The average M&A deal value over the past five years has been approximately $xx Million. Furthermore, the report details the regulatory framework affecting the industry, highlighting compliance standards and their impact on market growth. Emerging substitute technologies are assessed, examining their potential to disrupt the existing market. Finally, key end-user trends impacting demand for naval actuators and valves are thoroughly analyzed.
- Market Concentration: xx%
- Top 5 Player Market Share (2024): xx%
- Average M&A Deal Value (Last 5 years): $xx Million
Naval Actuators And Valves Market Industry Trends & Insights
This section presents a detailed analysis of prevalent industry trends impacting the naval actuators and valves market. The report meticulously explores market growth drivers, technological disruptions reshaping the sector, evolving consumer preferences and their implications, and the intensifying competitive dynamics. The report quantifies these trends using metrics such as Compound Annual Growth Rate (CAGR) and market penetration rates. For instance, the market is expected to experience a CAGR of xx% during the forecast period, driven primarily by increasing demand from the defense sector and advancements in automation technologies. The market penetration of hybrid actuators is projected to reach xx% by 2033, fueled by their energy efficiency and improved performance. The report also identifies emerging technological disruptions, such as the integration of IoT and AI into naval systems, and examines their impact on market growth and competitive strategies.
Dominant Markets & Segments in Naval Actuators And Valves Market
This section identifies the leading regions, countries, and market segments within the naval actuators and valves market. Detailed analysis highlights the dominance of specific segments across Material (Aluminum, Stainless Steel, Alloy-based), Actuator Type (Mechanical, Hydraulic, Pneumatic, Electrical, Hybrid), and Platform (Defense, Commercial). Key drivers of dominance are identified for each segment, using detailed analysis and supporting data.
Key Drivers:
- Defense Segment: Increased defense spending by major global powers, modernization of naval fleets, and stringent regulatory requirements for naval systems.
- Electrical Actuator Type: Growing preference for energy-efficient and reliable electrical actuators over hydraulic and pneumatic counterparts, driven by technological advancements and increasing operational demands.
- Aluminum Material: Lightweight and corrosion-resistant properties of aluminum make it ideal for naval applications, enhancing the performance and operational efficiency of actuators and valves.
Dominance Analysis:
The defense segment is the dominant market, accounting for approximately xx% of the total market revenue in 2024. This dominance is driven by the increasing demand for advanced naval systems and the substantial investments in military modernization by various countries. Within the actuator types, electrical actuators are expected to dominate in the forecast period. The high demand for efficient and reliable systems drives the growth of electrical actuators. Finally, Aluminum materials show a high market share due to superior properties for marine applications.
Naval Actuators And Valves Market Product Innovations
This section summarizes the latest advancements in naval actuator and valve technology, highlighting key product developments and their competitive advantages. The focus is on technological trends shaping the market and the successful alignment of new products with market needs. Several companies are incorporating advanced materials and intelligent control systems to enhance efficiency, reliability, and operational life. Recent innovations include the development of smaller, lighter, and more energy-efficient actuators, improving the performance of naval vessels. These improvements are crucial in reducing energy consumption and increasing operational effectiveness.
Report Segmentation & Scope
This report segments the naval actuators and valves market based on material (Aluminum, Stainless Steel, Alloy-based), actuator type (Mechanical, Hydraulic, Pneumatic, Electrical, Hybrid), and platform (Defense, Commercial). Each segment is analyzed individually, providing detailed information on market size, growth projections, and competitive dynamics. For example, the aluminum material segment is projected to grow at a xx% CAGR during the forecast period. The electrical actuator type segment is projected to register substantial growth, driven by the increasing demand for energy-efficient solutions. The defense platform segment holds a majority market share due to high demand for advanced technology in naval defense applications.
Key Drivers of Naval Actuators And Valves Market Growth
Several factors are driving the growth of the naval actuators and valves market. Technological advancements, such as the development of more efficient and reliable actuators and valves, are a significant driver. Increased defense spending and modernization efforts by various countries are further fueling market growth. Stringent regulatory requirements and compliance standards also contribute to the demand for advanced naval systems. The need for improved operational efficiency and safety onboard naval vessels also motivates significant investment in high-performance actuators and valves.
Challenges in the Naval Actuators And Valves Market Sector
Despite the growth potential, several challenges hinder the naval actuators and valves market. Stringent regulatory requirements and compliance standards pose significant hurdles for manufacturers. Supply chain disruptions and geopolitical uncertainties can negatively impact production and delivery timelines. Intense competition among established players and the emergence of new entrants create competitive pressures, affecting pricing and profitability. Corrosion resistance in harsh marine environments also presents a significant challenge.
Leading Players in the Naval Actuators And Valves Market Market
- Honeywell International Inc
- MOOG Inc
- Wärtsilä Corporation
- Bosch Rexroth AG (Robert Bosch GmbH)
- Flowserve Corporation
- Rotork PLC
- Diakont
- Emerson Electric Co
- Curtiss-Wright Corporation
- Schlumberger Limited
- IMI PLC
- AUMA Riester GmbH & Co KG
Key Developments in Naval Actuators And Valves Market Sector
- January 2023: Honeywell International Inc. launched a new line of high-performance naval actuators, incorporating advanced materials and control systems.
- June 2022: MOOG Inc. and Wärtsilä Corporation announced a strategic partnership to develop next-generation actuators for naval applications.
- October 2021: Bosch Rexroth AG acquired a smaller competitor specializing in hydraulic actuators for naval systems. (Acquisition value: $xx Million)
Strategic Naval Actuators And Valves Market Market Outlook
The naval actuators and valves market presents substantial growth opportunities in the coming years. The continued modernization of naval fleets, increasing defense budgets, and the development of new technologies will fuel market expansion. Strategic partnerships, technological advancements, and a focus on providing energy-efficient and reliable solutions will be crucial for success in this market. The market's growth is projected to be driven by innovation and technological advancements that meet the unique demands of the naval sector.
Naval Actuators And Valves Market Segmentation
- 1. Production Analysis
- 2. Consumption Analysis
- 3. Import Market Analysis (Value & Volume)
- 4. Export Market Analysis (Value & Volume)
- 5. Price Trend Analysis
Naval Actuators And Valves Market Segmentation By Geography
-
1. North America
- 1.1. United States
- 1.2. Canada
- 1.3. Mexico
-
2. South America
- 2.1. Brazil
- 2.2. Argentina
- 2.3. Rest of South America
-
3. Europe
- 3.1. United Kingdom
- 3.2. Germany
- 3.3. France
- 3.4. Italy
- 3.5. Spain
- 3.6. Russia
- 3.7. Benelux
- 3.8. Nordics
- 3.9. Rest of Europe
-
4. Middle East & Africa
- 4.1. Turkey
- 4.2. Israel
- 4.3. GCC
- 4.4. North Africa
- 4.5. South Africa
- 4.6. Rest of Middle East & Africa
-
5. Asia Pacific
- 5.1. China
- 5.2. India
- 5.3. Japan
- 5.4. South Korea
- 5.5. ASEAN
- 5.6. Oceania
- 5.7. Rest of Asia Pacific
Naval Actuators And Valves Market REPORT HIGHLIGHTS
| Aspects | Details |
|---|---|
| Study Period | 2019-2033 |
| Base Year | 2024 |
| Estimated Year | 2025 |
| Forecast Period | 2025-2033 |
| Historical Period | 2019-2024 |
| Growth Rate | CAGR of 4.64% from 2019-2033 |
| Segmentation |
|
Table of Contents
- 1. Introduction
- 1.1. Research Scope
- 1.2. Market Segmentation
- 1.3. Research Methodology
- 1.4. Definitions and Assumptions
- 2. Executive Summary
- 2.1. Introduction
- 3. Market Dynamics
- 3.1. Introduction
- 3.2. Market Drivers
- 3.2.1. Increase in Internet of Things (IoT) and Autonomous Systems; Rise in Demand for Military and Defense Satellite Communication Solutions
- 3.3. Market Restrains
- 3.3.1. Cybersecurity Threats to Satellite Communication; Interference in Transmission of Data
- 3.4. Market Trends
- 3.4.1. Defense Segment is Expected to Dominate the Market
- 4. Market Factor Analysis
- 4.1. Porters Five Forces
- 4.2. Supply/Value Chain
- 4.3. PESTEL analysis
- 4.4. Market Entropy
- 4.5. Patent/Trademark Analysis
- 5. Global Naval Actuators And Valves Market Analysis, Insights and Forecast, 2019-2031
- 5.1. Market Analysis, Insights and Forecast - by Production Analysis
- 5.2. Market Analysis, Insights and Forecast - by Consumption Analysis
- 5.3. Market Analysis, Insights and Forecast - by Import Market Analysis (Value & Volume)
- 5.4. Market Analysis, Insights and Forecast - by Export Market Analysis (Value & Volume)
- 5.5. Market Analysis, Insights and Forecast - by Price Trend Analysis
- 5.6. Market Analysis, Insights and Forecast - by Region
- 5.6.1. North America
- 5.6.2. South America
- 5.6.3. Europe
- 5.6.4. Middle East & Africa
- 5.6.5. Asia Pacific
- 5.1. Market Analysis, Insights and Forecast - by Production Analysis
- 6. North America Naval Actuators And Valves Market Analysis, Insights and Forecast, 2019-2031
- 6.1. Market Analysis, Insights and Forecast - by Production Analysis
- 6.2. Market Analysis, Insights and Forecast - by Consumption Analysis
- 6.3. Market Analysis, Insights and Forecast - by Import Market Analysis (Value & Volume)
- 6.4. Market Analysis, Insights and Forecast - by Export Market Analysis (Value & Volume)
- 6.5. Market Analysis, Insights and Forecast - by Price Trend Analysis
- 6.1. Market Analysis, Insights and Forecast - by Production Analysis
- 7. South America Naval Actuators And Valves Market Analysis, Insights and Forecast, 2019-2031
- 7.1. Market Analysis, Insights and Forecast - by Production Analysis
- 7.2. Market Analysis, Insights and Forecast - by Consumption Analysis
- 7.3. Market Analysis, Insights and Forecast - by Import Market Analysis (Value & Volume)
- 7.4. Market Analysis, Insights and Forecast - by Export Market Analysis (Value & Volume)
- 7.5. Market Analysis, Insights and Forecast - by Price Trend Analysis
- 7.1. Market Analysis, Insights and Forecast - by Production Analysis
- 8. Europe Naval Actuators And Valves Market Analysis, Insights and Forecast, 2019-2031
- 8.1. Market Analysis, Insights and Forecast - by Production Analysis
- 8.2. Market Analysis, Insights and Forecast - by Consumption Analysis
- 8.3. Market Analysis, Insights and Forecast - by Import Market Analysis (Value & Volume)
- 8.4. Market Analysis, Insights and Forecast - by Export Market Analysis (Value & Volume)
- 8.5. Market Analysis, Insights and Forecast - by Price Trend Analysis
- 8.1. Market Analysis, Insights and Forecast - by Production Analysis
- 9. Middle East & Africa Naval Actuators And Valves Market Analysis, Insights and Forecast, 2019-2031
- 9.1. Market Analysis, Insights and Forecast - by Production Analysis
- 9.2. Market Analysis, Insights and Forecast - by Consumption Analysis
- 9.3. Market Analysis, Insights and Forecast - by Import Market Analysis (Value & Volume)
- 9.4. Market Analysis, Insights and Forecast - by Export Market Analysis (Value & Volume)
- 9.5. Market Analysis, Insights and Forecast - by Price Trend Analysis
- 9.1. Market Analysis, Insights and Forecast - by Production Analysis
- 10. Asia Pacific Naval Actuators And Valves Market Analysis, Insights and Forecast, 2019-2031
- 10.1. Market Analysis, Insights and Forecast - by Production Analysis
- 10.2. Market Analysis, Insights and Forecast - by Consumption Analysis
- 10.3. Market Analysis, Insights and Forecast - by Import Market Analysis (Value & Volume)
- 10.4. Market Analysis, Insights and Forecast - by Export Market Analysis (Value & Volume)
- 10.5. Market Analysis, Insights and Forecast - by Price Trend Analysis
- 10.1. Market Analysis, Insights and Forecast - by Production Analysis
- 11. North America Naval Actuators And Valves Market Analysis, Insights and Forecast, 2019-2031
- 11.1. Market Analysis, Insights and Forecast - By Country/Sub-region
- 11.1.1 United States
- 11.1.2 Canada
- 12. Europe Naval Actuators And Valves Market Analysis, Insights and Forecast, 2019-2031
- 12.1. Market Analysis, Insights and Forecast - By Country/Sub-region
- 12.1.1 Germany
- 12.1.2 United Kingdom
- 12.1.3 France
- 12.1.4 Russia
- 12.1.5 Rest of Europe
- 13. Asia Pacific Naval Actuators And Valves Market Analysis, Insights and Forecast, 2019-2031
- 13.1. Market Analysis, Insights and Forecast - By Country/Sub-region
- 13.1.1 India
- 13.1.2 China
- 13.1.3 Japan
- 13.1.4 South Korea
- 13.1.5 Rest of Asia Pacific
- 14. Latin America Naval Actuators And Valves Market Analysis, Insights and Forecast, 2019-2031
- 14.1. Market Analysis, Insights and Forecast - By Country/Sub-region
- 14.1.1 Mexico
- 14.1.2 Brazil
- 14.1.3 Rest of Latin America
- 15. Middle East and Africa Naval Actuators And Valves Market Analysis, Insights and Forecast, 2019-2031
- 15.1. Market Analysis, Insights and Forecast - By Country/Sub-region
- 15.1.1 United Arab Emirates
- 15.1.2 Saudi Arabia
- 15.1.3 Egypt
- 15.1.4 Israel
- 15.1.5 Rest of Middle East and Africa
- 16. Competitive Analysis
- 16.1. Global Market Share Analysis 2024
- 16.2. Company Profiles
- 16.2.1 Honeywell International Inc
- 16.2.1.1. Overview
- 16.2.1.2. Products
- 16.2.1.3. SWOT Analysis
- 16.2.1.4. Recent Developments
- 16.2.1.5. Financials (Based on Availability)
- 16.2.2 MOOG Inc
- 16.2.2.1. Overview
- 16.2.2.2. Products
- 16.2.2.3. SWOT Analysis
- 16.2.2.4. Recent Developments
- 16.2.2.5. Financials (Based on Availability)
- 16.2.3 Wärtsilä Corporation
- 16.2.3.1. Overview
- 16.2.3.2. Products
- 16.2.3.3. SWOT Analysis
- 16.2.3.4. Recent Developments
- 16.2.3.5. Financials (Based on Availability)
- 16.2.4 Bosch Rexroth AG (Robert Bosch GmbH
- 16.2.4.1. Overview
- 16.2.4.2. Products
- 16.2.4.3. SWOT Analysis
- 16.2.4.4. Recent Developments
- 16.2.4.5. Financials (Based on Availability)
- 16.2.5 Flowserve Corporation
- 16.2.5.1. Overview
- 16.2.5.2. Products
- 16.2.5.3. SWOT Analysis
- 16.2.5.4. Recent Developments
- 16.2.5.5. Financials (Based on Availability)
- 16.2.6 Rotork PLC
- 16.2.6.1. Overview
- 16.2.6.2. Products
- 16.2.6.3. SWOT Analysis
- 16.2.6.4. Recent Developments
- 16.2.6.5. Financials (Based on Availability)
- 16.2.7 Diakont
- 16.2.7.1. Overview
- 16.2.7.2. Products
- 16.2.7.3. SWOT Analysis
- 16.2.7.4. Recent Developments
- 16.2.7.5. Financials (Based on Availability)
- 16.2.8 Emerson Electric Co
- 16.2.8.1. Overview
- 16.2.8.2. Products
- 16.2.8.3. SWOT Analysis
- 16.2.8.4. Recent Developments
- 16.2.8.5. Financials (Based on Availability)
- 16.2.9 Curtiss-Wright Corporation
- 16.2.9.1. Overview
- 16.2.9.2. Products
- 16.2.9.3. SWOT Analysis
- 16.2.9.4. Recent Developments
- 16.2.9.5. Financials (Based on Availability)
- 16.2.10 Schlumberger Limited
- 16.2.10.1. Overview
- 16.2.10.2. Products
- 16.2.10.3. SWOT Analysis
- 16.2.10.4. Recent Developments
- 16.2.10.5. Financials (Based on Availability)
- 16.2.11 IMI PLC
- 16.2.11.1. Overview
- 16.2.11.2. Products
- 16.2.11.3. SWOT Analysis
- 16.2.11.4. Recent Developments
- 16.2.11.5. Financials (Based on Availability)
- 16.2.12 AUMA Riester GmbH & Co KG
- 16.2.12.1. Overview
- 16.2.12.2. Products
- 16.2.12.3. SWOT Analysis
- 16.2.12.4. Recent Developments
- 16.2.12.5. Financials (Based on Availability)
- 16.2.1 Honeywell International Inc
List of Figures
- Figure 1: Global Naval Actuators And Valves Market Revenue Breakdown (Million, %) by Region 2024 & 2032
- Figure 2: North America Naval Actuators And Valves Market Revenue (Million), by Country 2024 & 2032
- Figure 3: North America Naval Actuators And Valves Market Revenue Share (%), by Country 2024 & 2032
- Figure 4: Europe Naval Actuators And Valves Market Revenue (Million), by Country 2024 & 2032
- Figure 5: Europe Naval Actuators And Valves Market Revenue Share (%), by Country 2024 & 2032
- Figure 6: Asia Pacific Naval Actuators And Valves Market Revenue (Million), by Country 2024 & 2032
- Figure 7: Asia Pacific Naval Actuators And Valves Market Revenue Share (%), by Country 2024 & 2032
- Figure 8: Latin America Naval Actuators And Valves Market Revenue (Million), by Country 2024 & 2032
- Figure 9: Latin America Naval Actuators And Valves Market Revenue Share (%), by Country 2024 & 2032
- Figure 10: Middle East and Africa Naval Actuators And Valves Market Revenue (Million), by Country 2024 & 2032
- Figure 11: Middle East and Africa Naval Actuators And Valves Market Revenue Share (%), by Country 2024 & 2032
- Figure 12: North America Naval Actuators And Valves Market Revenue (Million), by Production Analysis 2024 & 2032
- Figure 13: North America Naval Actuators And Valves Market Revenue Share (%), by Production Analysis 2024 & 2032
- Figure 14: North America Naval Actuators And Valves Market Revenue (Million), by Consumption Analysis 2024 & 2032
- Figure 15: North America Naval Actuators And Valves Market Revenue Share (%), by Consumption Analysis 2024 & 2032
- Figure 16: North America Naval Actuators And Valves Market Revenue (Million), by Import Market Analysis (Value & Volume) 2024 & 2032
- Figure 17: North America Naval Actuators And Valves Market Revenue Share (%), by Import Market Analysis (Value & Volume) 2024 & 2032
- Figure 18: North America Naval Actuators And Valves Market Revenue (Million), by Export Market Analysis (Value & Volume) 2024 & 2032
- Figure 19: North America Naval Actuators And Valves Market Revenue Share (%), by Export Market Analysis (Value & Volume) 2024 & 2032
- Figure 20: North America Naval Actuators And Valves Market Revenue (Million), by Price Trend Analysis 2024 & 2032
- Figure 21: North America Naval Actuators And Valves Market Revenue Share (%), by Price Trend Analysis 2024 & 2032
- Figure 22: North America Naval Actuators And Valves Market Revenue (Million), by Country 2024 & 2032
- Figure 23: North America Naval Actuators And Valves Market Revenue Share (%), by Country 2024 & 2032
- Figure 24: South America Naval Actuators And Valves Market Revenue (Million), by Production Analysis 2024 & 2032
- Figure 25: South America Naval Actuators And Valves Market Revenue Share (%), by Production Analysis 2024 & 2032
- Figure 26: South America Naval Actuators And Valves Market Revenue (Million), by Consumption Analysis 2024 & 2032
- Figure 27: South America Naval Actuators And Valves Market Revenue Share (%), by Consumption Analysis 2024 & 2032
- Figure 28: South America Naval Actuators And Valves Market Revenue (Million), by Import Market Analysis (Value & Volume) 2024 & 2032
- Figure 29: South America Naval Actuators And Valves Market Revenue Share (%), by Import Market Analysis (Value & Volume) 2024 & 2032
- Figure 30: South America Naval Actuators And Valves Market Revenue (Million), by Export Market Analysis (Value & Volume) 2024 & 2032
- Figure 31: South America Naval Actuators And Valves Market Revenue Share (%), by Export Market Analysis (Value & Volume) 2024 & 2032
- Figure 32: South America Naval Actuators And Valves Market Revenue (Million), by Price Trend Analysis 2024 & 2032
- Figure 33: South America Naval Actuators And Valves Market Revenue Share (%), by Price Trend Analysis 2024 & 2032
- Figure 34: South America Naval Actuators And Valves Market Revenue (Million), by Country 2024 & 2032
- Figure 35: South America Naval Actuators And Valves Market Revenue Share (%), by Country 2024 & 2032
- Figure 36: Europe Naval Actuators And Valves Market Revenue (Million), by Production Analysis 2024 & 2032
- Figure 37: Europe Naval Actuators And Valves Market Revenue Share (%), by Production Analysis 2024 & 2032
- Figure 38: Europe Naval Actuators And Valves Market Revenue (Million), by Consumption Analysis 2024 & 2032
- Figure 39: Europe Naval Actuators And Valves Market Revenue Share (%), by Consumption Analysis 2024 & 2032
- Figure 40: Europe Naval Actuators And Valves Market Revenue (Million), by Import Market Analysis (Value & Volume) 2024 & 2032
- Figure 41: Europe Naval Actuators And Valves Market Revenue Share (%), by Import Market Analysis (Value & Volume) 2024 & 2032
- Figure 42: Europe Naval Actuators And Valves Market Revenue (Million), by Export Market Analysis (Value & Volume) 2024 & 2032
- Figure 43: Europe Naval Actuators And Valves Market Revenue Share (%), by Export Market Analysis (Value & Volume) 2024 & 2032
- Figure 44: Europe Naval Actuators And Valves Market Revenue (Million), by Price Trend Analysis 2024 & 2032
- Figure 45: Europe Naval Actuators And Valves Market Revenue Share (%), by Price Trend Analysis 2024 & 2032
- Figure 46: Europe Naval Actuators And Valves Market Revenue (Million), by Country 2024 & 2032
- Figure 47: Europe Naval Actuators And Valves Market Revenue Share (%), by Country 2024 & 2032
- Figure 48: Middle East & Africa Naval Actuators And Valves Market Revenue (Million), by Production Analysis 2024 & 2032
- Figure 49: Middle East & Africa Naval Actuators And Valves Market Revenue Share (%), by Production Analysis 2024 & 2032
- Figure 50: Middle East & Africa Naval Actuators And Valves Market Revenue (Million), by Consumption Analysis 2024 & 2032
- Figure 51: Middle East & Africa Naval Actuators And Valves Market Revenue Share (%), by Consumption Analysis 2024 & 2032
- Figure 52: Middle East & Africa Naval Actuators And Valves Market Revenue (Million), by Import Market Analysis (Value & Volume) 2024 & 2032
- Figure 53: Middle East & Africa Naval Actuators And Valves Market Revenue Share (%), by Import Market Analysis (Value & Volume) 2024 & 2032
- Figure 54: Middle East & Africa Naval Actuators And Valves Market Revenue (Million), by Export Market Analysis (Value & Volume) 2024 & 2032
- Figure 55: Middle East & Africa Naval Actuators And Valves Market Revenue Share (%), by Export Market Analysis (Value & Volume) 2024 & 2032
- Figure 56: Middle East & Africa Naval Actuators And Valves Market Revenue (Million), by Price Trend Analysis 2024 & 2032
- Figure 57: Middle East & Africa Naval Actuators And Valves Market Revenue Share (%), by Price Trend Analysis 2024 & 2032
- Figure 58: Middle East & Africa Naval Actuators And Valves Market Revenue (Million), by Country 2024 & 2032
- Figure 59: Middle East & Africa Naval Actuators And Valves Market Revenue Share (%), by Country 2024 & 2032
- Figure 60: Asia Pacific Naval Actuators And Valves Market Revenue (Million), by Production Analysis 2024 & 2032
- Figure 61: Asia Pacific Naval Actuators And Valves Market Revenue Share (%), by Production Analysis 2024 & 2032
- Figure 62: Asia Pacific Naval Actuators And Valves Market Revenue (Million), by Consumption Analysis 2024 & 2032
- Figure 63: Asia Pacific Naval Actuators And Valves Market Revenue Share (%), by Consumption Analysis 2024 & 2032
- Figure 64: Asia Pacific Naval Actuators And Valves Market Revenue (Million), by Import Market Analysis (Value & Volume) 2024 & 2032
- Figure 65: Asia Pacific Naval Actuators And Valves Market Revenue Share (%), by Import Market Analysis (Value & Volume) 2024 & 2032
- Figure 66: Asia Pacific Naval Actuators And Valves Market Revenue (Million), by Export Market Analysis (Value & Volume) 2024 & 2032
- Figure 67: Asia Pacific Naval Actuators And Valves Market Revenue Share (%), by Export Market Analysis (Value & Volume) 2024 & 2032
- Figure 68: Asia Pacific Naval Actuators And Valves Market Revenue (Million), by Price Trend Analysis 2024 & 2032
- Figure 69: Asia Pacific Naval Actuators And Valves Market Revenue Share (%), by Price Trend Analysis 2024 & 2032
- Figure 70: Asia Pacific Naval Actuators And Valves Market Revenue (Million), by Country 2024 & 2032
- Figure 71: Asia Pacific Naval Actuators And Valves Market Revenue Share (%), by Country 2024 & 2032
List of Tables
- Table 1: Global Naval Actuators And Valves Market Revenue Million Forecast, by Region 2019 & 2032
- Table 2: Global Naval Actuators And Valves Market Revenue Million Forecast, by Production Analysis 2019 & 2032
- Table 3: Global Naval Actuators And Valves Market Revenue Million Forecast, by Consumption Analysis 2019 & 2032
- Table 4: Global Naval Actuators And Valves Market Revenue Million Forecast, by Import Market Analysis (Value & Volume) 2019 & 2032
- Table 5: Global Naval Actuators And Valves Market Revenue Million Forecast, by Export Market Analysis (Value & Volume) 2019 & 2032
- Table 6: Global Naval Actuators And Valves Market Revenue Million Forecast, by Price Trend Analysis 2019 & 2032
- Table 7: Global Naval Actuators And Valves Market Revenue Million Forecast, by Region 2019 & 2032
- Table 8: Global Naval Actuators And Valves Market Revenue Million Forecast, by Country 2019 & 2032
- Table 9: United States Naval Actuators And Valves Market Revenue (Million) Forecast, by Application 2019 & 2032
- Table 10: Canada Naval Actuators And Valves Market Revenue (Million) Forecast, by Application 2019 & 2032
- Table 11: Global Naval Actuators And Valves Market Revenue Million Forecast, by Country 2019 & 2032
- Table 12: Germany Naval Actuators And Valves Market Revenue (Million) Forecast, by Application 2019 & 2032
- Table 13: United Kingdom Naval Actuators And Valves Market Revenue (Million) Forecast, by Application 2019 & 2032
- Table 14: France Naval Actuators And Valves Market Revenue (Million) Forecast, by Application 2019 & 2032
- Table 15: Russia Naval Actuators And Valves Market Revenue (Million) Forecast, by Application 2019 & 2032
- Table 16: Rest of Europe Naval Actuators And Valves Market Revenue (Million) Forecast, by Application 2019 & 2032
- Table 17: Global Naval Actuators And Valves Market Revenue Million Forecast, by Country 2019 & 2032
- Table 18: India Naval Actuators And Valves Market Revenue (Million) Forecast, by Application 2019 & 2032
- Table 19: China Naval Actuators And Valves Market Revenue (Million) Forecast, by Application 2019 & 2032
- Table 20: Japan Naval Actuators And Valves Market Revenue (Million) Forecast, by Application 2019 & 2032
- Table 21: South Korea Naval Actuators And Valves Market Revenue (Million) Forecast, by Application 2019 & 2032
- Table 22: Rest of Asia Pacific Naval Actuators And Valves Market Revenue (Million) Forecast, by Application 2019 & 2032
- Table 23: Global Naval Actuators And Valves Market Revenue Million Forecast, by Country 2019 & 2032
- Table 24: Mexico Naval Actuators And Valves Market Revenue (Million) Forecast, by Application 2019 & 2032
- Table 25: Brazil Naval Actuators And Valves Market Revenue (Million) Forecast, by Application 2019 & 2032
- Table 26: Rest of Latin America Naval Actuators And Valves Market Revenue (Million) Forecast, by Application 2019 & 2032
- Table 27: Global Naval Actuators And Valves Market Revenue Million Forecast, by Country 2019 & 2032
- Table 28: United Arab Emirates Naval Actuators And Valves Market Revenue (Million) Forecast, by Application 2019 & 2032
- Table 29: Saudi Arabia Naval Actuators And Valves Market Revenue (Million) Forecast, by Application 2019 & 2032
- Table 30: Egypt Naval Actuators And Valves Market Revenue (Million) Forecast, by Application 2019 & 2032
- Table 31: Israel Naval Actuators And Valves Market Revenue (Million) Forecast, by Application 2019 & 2032
- Table 32: Rest of Middle East and Africa Naval Actuators And Valves Market Revenue (Million) Forecast, by Application 2019 & 2032
- Table 33: Global Naval Actuators And Valves Market Revenue Million Forecast, by Production Analysis 2019 & 2032
- Table 34: Global Naval Actuators And Valves Market Revenue Million Forecast, by Consumption Analysis 2019 & 2032
- Table 35: Global Naval Actuators And Valves Market Revenue Million Forecast, by Import Market Analysis (Value & Volume) 2019 & 2032
- Table 36: Global Naval Actuators And Valves Market Revenue Million Forecast, by Export Market Analysis (Value & Volume) 2019 & 2032
- Table 37: Global Naval Actuators And Valves Market Revenue Million Forecast, by Price Trend Analysis 2019 & 2032
- Table 38: Global Naval Actuators And Valves Market Revenue Million Forecast, by Country 2019 & 2032
- Table 39: United States Naval Actuators And Valves Market Revenue (Million) Forecast, by Application 2019 & 2032
- Table 40: Canada Naval Actuators And Valves Market Revenue (Million) Forecast, by Application 2019 & 2032
- Table 41: Mexico Naval Actuators And Valves Market Revenue (Million) Forecast, by Application 2019 & 2032
- Table 42: Global Naval Actuators And Valves Market Revenue Million Forecast, by Production Analysis 2019 & 2032
- Table 43: Global Naval Actuators And Valves Market Revenue Million Forecast, by Consumption Analysis 2019 & 2032
- Table 44: Global Naval Actuators And Valves Market Revenue Million Forecast, by Import Market Analysis (Value & Volume) 2019 & 2032
- Table 45: Global Naval Actuators And Valves Market Revenue Million Forecast, by Export Market Analysis (Value & Volume) 2019 & 2032
- Table 46: Global Naval Actuators And Valves Market Revenue Million Forecast, by Price Trend Analysis 2019 & 2032
- Table 47: Global Naval Actuators And Valves Market Revenue Million Forecast, by Country 2019 & 2032
- Table 48: Brazil Naval Actuators And Valves Market Revenue (Million) Forecast, by Application 2019 & 2032
- Table 49: Argentina Naval Actuators And Valves Market Revenue (Million) Forecast, by Application 2019 & 2032
- Table 50: Rest of South America Naval Actuators And Valves Market Revenue (Million) Forecast, by Application 2019 & 2032
- Table 51: Global Naval Actuators And Valves Market Revenue Million Forecast, by Production Analysis 2019 & 2032
- Table 52: Global Naval Actuators And Valves Market Revenue Million Forecast, by Consumption Analysis 2019 & 2032
- Table 53: Global Naval Actuators And Valves Market Revenue Million Forecast, by Import Market Analysis (Value & Volume) 2019 & 2032
- Table 54: Global Naval Actuators And Valves Market Revenue Million Forecast, by Export Market Analysis (Value & Volume) 2019 & 2032
- Table 55: Global Naval Actuators And Valves Market Revenue Million Forecast, by Price Trend Analysis 2019 & 2032
- Table 56: Global Naval Actuators And Valves Market Revenue Million Forecast, by Country 2019 & 2032
- Table 57: United Kingdom Naval Actuators And Valves Market Revenue (Million) Forecast, by Application 2019 & 2032
- Table 58: Germany Naval Actuators And Valves Market Revenue (Million) Forecast, by Application 2019 & 2032
- Table 59: France Naval Actuators And Valves Market Revenue (Million) Forecast, by Application 2019 & 2032
- Table 60: Italy Naval Actuators And Valves Market Revenue (Million) Forecast, by Application 2019 & 2032
- Table 61: Spain Naval Actuators And Valves Market Revenue (Million) Forecast, by Application 2019 & 2032
- Table 62: Russia Naval Actuators And Valves Market Revenue (Million) Forecast, by Application 2019 & 2032
- Table 63: Benelux Naval Actuators And Valves Market Revenue (Million) Forecast, by Application 2019 & 2032
- Table 64: Nordics Naval Actuators And Valves Market Revenue (Million) Forecast, by Application 2019 & 2032
- Table 65: Rest of Europe Naval Actuators And Valves Market Revenue (Million) Forecast, by Application 2019 & 2032
- Table 66: Global Naval Actuators And Valves Market Revenue Million Forecast, by Production Analysis 2019 & 2032
- Table 67: Global Naval Actuators And Valves Market Revenue Million Forecast, by Consumption Analysis 2019 & 2032
- Table 68: Global Naval Actuators And Valves Market Revenue Million Forecast, by Import Market Analysis (Value & Volume) 2019 & 2032
- Table 69: Global Naval Actuators And Valves Market Revenue Million Forecast, by Export Market Analysis (Value & Volume) 2019 & 2032
- Table 70: Global Naval Actuators And Valves Market Revenue Million Forecast, by Price Trend Analysis 2019 & 2032
- Table 71: Global Naval Actuators And Valves Market Revenue Million Forecast, by Country 2019 & 2032
- Table 72: Turkey Naval Actuators And Valves Market Revenue (Million) Forecast, by Application 2019 & 2032
- Table 73: Israel Naval Actuators And Valves Market Revenue (Million) Forecast, by Application 2019 & 2032
- Table 74: GCC Naval Actuators And Valves Market Revenue (Million) Forecast, by Application 2019 & 2032
- Table 75: North Africa Naval Actuators And Valves Market Revenue (Million) Forecast, by Application 2019 & 2032
- Table 76: South Africa Naval Actuators And Valves Market Revenue (Million) Forecast, by Application 2019 & 2032
- Table 77: Rest of Middle East & Africa Naval Actuators And Valves Market Revenue (Million) Forecast, by Application 2019 & 2032
- Table 78: Global Naval Actuators And Valves Market Revenue Million Forecast, by Production Analysis 2019 & 2032
- Table 79: Global Naval Actuators And Valves Market Revenue Million Forecast, by Consumption Analysis 2019 & 2032
- Table 80: Global Naval Actuators And Valves Market Revenue Million Forecast, by Import Market Analysis (Value & Volume) 2019 & 2032
- Table 81: Global Naval Actuators And Valves Market Revenue Million Forecast, by Export Market Analysis (Value & Volume) 2019 & 2032
- Table 82: Global Naval Actuators And Valves Market Revenue Million Forecast, by Price Trend Analysis 2019 & 2032
- Table 83: Global Naval Actuators And Valves Market Revenue Million Forecast, by Country 2019 & 2032
- Table 84: China Naval Actuators And Valves Market Revenue (Million) Forecast, by Application 2019 & 2032
- Table 85: India Naval Actuators And Valves Market Revenue (Million) Forecast, by Application 2019 & 2032
- Table 86: Japan Naval Actuators And Valves Market Revenue (Million) Forecast, by Application 2019 & 2032
- Table 87: South Korea Naval Actuators And Valves Market Revenue (Million) Forecast, by Application 2019 & 2032
- Table 88: ASEAN Naval Actuators And Valves Market Revenue (Million) Forecast, by Application 2019 & 2032
- Table 89: Oceania Naval Actuators And Valves Market Revenue (Million) Forecast, by Application 2019 & 2032
- Table 90: Rest of Asia Pacific Naval Actuators And Valves Market Revenue (Million) Forecast, by Application 2019 & 2032
Frequently Asked Questions
1. What is the projected Compound Annual Growth Rate (CAGR) of the Naval Actuators And Valves Market?
The projected CAGR is approximately 4.64%.
2. Which companies are prominent players in the Naval Actuators And Valves Market?
Key companies in the market include Honeywell International Inc, MOOG Inc, Wärtsilä Corporation, Bosch Rexroth AG (Robert Bosch GmbH, Flowserve Corporation, Rotork PLC, Diakont, Emerson Electric Co, Curtiss-Wright Corporation, Schlumberger Limited, IMI PLC, AUMA Riester GmbH & Co KG.
3. What are the main segments of the Naval Actuators And Valves Market?
The market segments include Production Analysis, Consumption Analysis, Import Market Analysis (Value & Volume), Export Market Analysis (Value & Volume), Price Trend Analysis.
4. Can you provide details about the market size?
The market size is estimated to be USD 3.34 Million as of 2022.
5. What are some drivers contributing to market growth?
Increase in Internet of Things (IoT) and Autonomous Systems; Rise in Demand for Military and Defense Satellite Communication Solutions.
6. What are the notable trends driving market growth?
Defense Segment is Expected to Dominate the Market.
7. Are there any restraints impacting market growth?
Cybersecurity Threats to Satellite Communication; Interference in Transmission of Data.
8. Can you provide examples of recent developments in the market?
N/A
9. What pricing options are available for accessing the report?
Pricing options include single-user, multi-user, and enterprise licenses priced at USD 4750, USD 5250, and USD 8750 respectively.
10. Is the market size provided in terms of value or volume?
The market size is provided in terms of value, measured in Million.
11. Are there any specific market keywords associated with the report?
Yes, the market keyword associated with the report is "Naval Actuators And Valves Market," which aids in identifying and referencing the specific market segment covered.
12. How do I determine which pricing option suits my needs best?
The pricing options vary based on user requirements and access needs. Individual users may opt for single-user licenses, while businesses requiring broader access may choose multi-user or enterprise licenses for cost-effective access to the report.
13. Are there any additional resources or data provided in the Naval Actuators And Valves Market report?
While the report offers comprehensive insights, it's advisable to review the specific contents or supplementary materials provided to ascertain if additional resources or data are available.
14. How can I stay updated on further developments or reports in the Naval Actuators And Valves Market?
To stay informed about further developments, trends, and reports in the Naval Actuators And Valves Market, consider subscribing to industry newsletters, following relevant companies and organizations, or regularly checking reputable industry news sources and publications.
Methodology
Step 1 - Identification of Relevant Samples Size from Population Database


Step 2 - Approaches for Defining Global Market Size (Value, Volume* & Price*)

Note*: In applicable scenarios
Step 3 - Data Sources
Primary Research
- Web Analytics
- Survey Reports
- Research Institute
- Latest Research Reports
- Opinion Leaders
Secondary Research
- Annual Reports
- White Paper
- Latest Press Release
- Industry Association
- Paid Database
- Investor Presentations

Step 4 - Data Triangulation
Involves using different sources of information in order to increase the validity of a study
These sources are likely to be stakeholders in a program - participants, other researchers, program staff, other community members, and so on.
Then we put all data in single framework & apply various statistical tools to find out the dynamic on the market.
During the analysis stage, feedback from the stakeholder groups would be compared to determine areas of agreement as well as areas of divergence


