
Key Insights
The global natural specialty sweeteners market is experiencing robust growth, projected to reach a substantial size driven by increasing health consciousness and demand for reduced-sugar options. The market's 5.50% CAGR from 2019-2033 indicates consistent expansion. Key drivers include the rising prevalence of diabetes and other metabolic disorders, coupled with a growing preference for natural and clean-label food and beverage products. Consumer awareness regarding the adverse health effects of artificial sweeteners is further bolstering the market's trajectory. This trend is reflected across various segments, including high-intensity sweeteners (HIS) like stevia and monk fruit, which are witnessing particularly strong growth due to their intense sweetness and minimal caloric content. Application segments such as dairy, bakery, and beverages are significant contributors, as manufacturers incorporate these sweeteners into their products to cater to health-conscious consumers. While challenges remain – such as price volatility of certain raw materials and the potential for inconsistent sweetness levels in some natural sweeteners – ongoing research and development efforts are continuously improving product quality and affordability, ensuring long-term market growth. Major players like Cargill, PureCircle, and ADM are actively investing in research, expanding production capacity, and developing innovative product formulations to meet the evolving demands of this dynamic market.
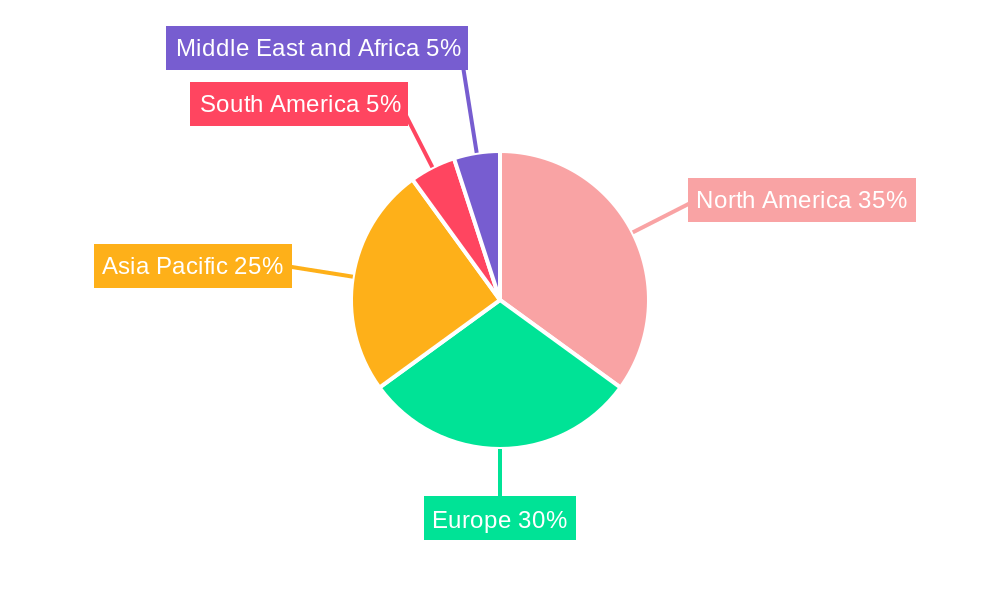
The geographical distribution of the market reveals strong performance in North America and Europe, driven by high consumer awareness and established regulatory frameworks. However, Asia-Pacific is expected to exhibit significant growth potential in the coming years due to rising disposable incomes, changing dietary habits, and a growing middle class with increased purchasing power. The market segmentation by product type (starch sweeteners and sugar alcohols) reflects the diverse range of options available to manufacturers, each with its own unique characteristics and applications. This segmentation provides a nuanced understanding of the market landscape, allowing for targeted strategies and more accurate market forecasting. The competitive landscape is characterized by a mix of large multinational corporations and smaller specialized firms, indicating a dynamic and innovative market.
Natural Specialty Sweeteners Market: A Comprehensive Report (2019-2033)
This comprehensive report provides an in-depth analysis of the global Natural Specialty Sweeteners Market, offering valuable insights for stakeholders across the value chain. Covering the period from 2019 to 2033, with a base year of 2025 and a forecast period of 2025-2033, this report meticulously examines market dynamics, competitive landscapes, and future growth potential. The market is projected to reach xx Million by 2033, exhibiting a CAGR of xx% during the forecast period.
Natural Specialty Sweeteners Market Market Structure & Competitive Dynamics
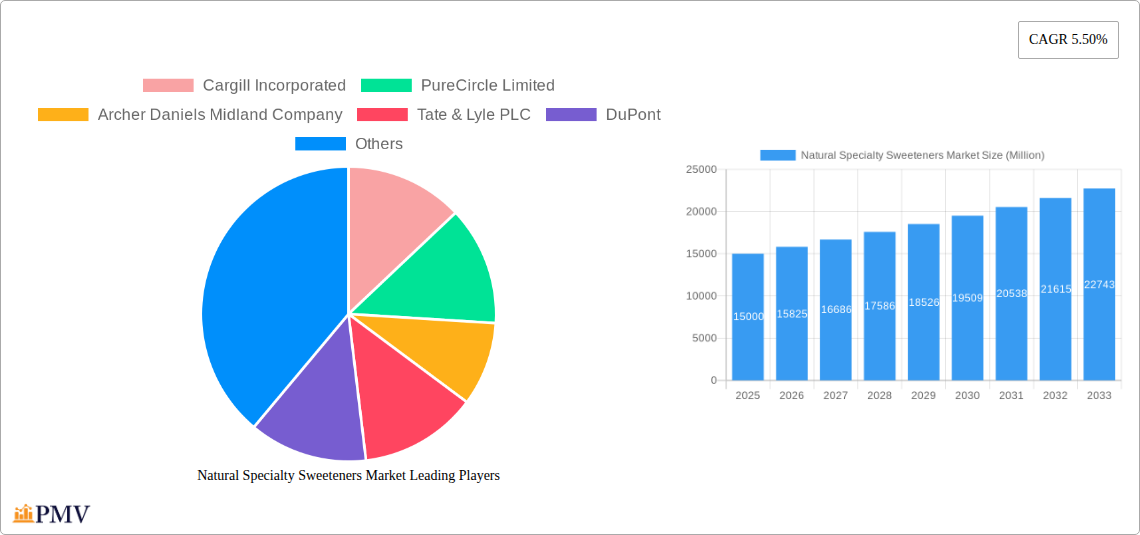
The Natural Specialty Sweeteners market is characterized by a moderately concentrated structure, with key players such as Cargill Incorporated, Cargill Incorporated, PureCircle Limited, PureCircle Limited, Archer Daniels Midland Company, Archer Daniels Midland Company, Tate & Lyle PLC, Tate & Lyle PLC, DuPont, Ingredion Incorporated, Ingredion Incorporated, Stevia First Corporation, and NutraSweet Company holding significant market share. However, the market also accommodates several smaller, niche players, particularly in the high-intensity sweetener segment. Market share analysis reveals that the top five players collectively account for approximately 60% of the global market, indicating a moderately consolidated structure.
Innovation plays a crucial role, with companies investing heavily in research and development to introduce novel sweeteners with improved taste profiles and functionalities. Stringent regulatory frameworks, especially concerning labeling and health claims, significantly influence market dynamics. The market also witnesses considerable M&A activity, with larger companies acquiring smaller players to expand their product portfolios and enhance their market reach. Recent M&A deals have totaled approximately xx Million in value, primarily driven by the desire to consolidate market share and access new technologies. Product substitutes, such as artificial sweeteners, pose a competitive challenge, though consumer preference for natural ingredients is driving market growth. End-user trends, particularly the increasing demand for healthier food and beverage options, are fueling market expansion across various applications.
Natural Specialty Sweeteners Market Industry Trends & Insights
The Natural Specialty Sweeteners market is experiencing robust growth, driven by several key factors. The rising prevalence of health consciousness among consumers is a primary driver, leading to increased demand for healthier alternatives to traditional sugar. The growing awareness of the negative health impacts of excessive sugar consumption further strengthens this trend. Technological advancements in sweetener production and extraction processes are enhancing the quality, consistency, and affordability of natural specialty sweeteners. This has expanded their applications across various food and beverage categories.
Consumer preferences are shifting towards products with clean labels and minimal processed ingredients. This preference directly benefits natural specialty sweeteners, creating substantial market growth opportunities. Competitive dynamics are intense, with established players continuously innovating and smaller companies disrupting the market with novel products and business models. The market's CAGR is estimated at xx%, reflecting the strong growth trajectory fueled by changing consumer preferences and technological advancements. Market penetration in key regions such as North America and Europe is already significant, while emerging markets in Asia-Pacific present high growth potential.
Dominant Markets & Segments in Natural Specialty Sweeteners Market
The North American region currently holds the largest market share in the Natural Specialty Sweeteners market, driven by factors such as high consumer disposable income, strong health consciousness, and the robust presence of key players. Within the segments, the High-Intensity Sweeteners (HIS) segment exhibits the highest growth rate due to increasing consumer demand for calorie reduction in food and beverage products. The confectionery and beverage applications dominate market share, attributable to extensive product development and consumer preference. Starch sweeteners and sugar alcohols hold a significant portion of the market, representing a stable and established product category.
Key Drivers in North America:
- Strong consumer preference for natural and healthier products.
- High levels of disposable income facilitating premium product purchases.
- Well-established distribution networks supporting market reach.
- Favorable government regulations promoting natural food products.
Key Drivers in Europe:
- Increasing health awareness and dietary changes among consumers.
- Growing demand for functional foods and beverages.
- Stringent regulatory standards driving innovation and quality.
- Established supply chains ensuring product availability.
Dominant Application Segment: Beverages maintain the highest market share, owing to the versatility and functionality of natural sweeteners in enhancing taste and texture while complying with healthier product trends.
Dominant Product Type Segment: Starch sweeteners are the most significant segment due to their wide applicability and cost-effectiveness in various food and beverage applications.
Natural Specialty Sweeteners Market Product Innovations
Recent innovations in the Natural Specialty Sweeteners market have focused on enhancing taste profiles, improving functionalities, and reducing production costs. Companies are developing new extraction and refining techniques to create sweeteners with superior sweetness, reduced aftertaste, and enhanced stability. This includes the use of advanced enzymatic processes and novel extraction methods to achieve higher yields and purity. Furthermore, there is a strong focus on creating sweeteners that are suitable for various applications, including those requiring high-temperature processing or specific functional properties. The development of novel blends and combinations of different natural sweeteners addresses various consumer needs and specific product requirements, offering competitive advantages in terms of taste and cost.
Report Segmentation & Scope
This report segments the Natural Specialty Sweeteners market in several key ways:
By Product Type: Starch Sweeteners and Sugar Alcohols (Market size xx Million in 2025, projected growth xx% during forecast period). This segment is characterized by established production processes and relatively stable market share.
By Application: Dairy, Bakery, Soups, Sauces and Dressings, Confectionery, Beverages, Others (Market size xx Million in 2025, projected growth xx% during forecast period). This segment showcases a diversified market with various growth opportunities depending on consumer trends and product innovations.
By Others: High Intensity Sweeteners (HIS) (Market size xx Million in 2025, projected growth xx% during forecast period). This segment is highly dynamic, driven by ongoing R&D and the rising demand for low-calorie sweeteners.
Each segment includes an analysis of its market size, growth projections, key players, and competitive dynamics.
Key Drivers of Natural Specialty Sweeteners Market Growth
Several factors fuel the growth of the Natural Specialty Sweeteners market. The increasing consumer preference for natural and healthy products is a primary driver, leading to the substitution of traditional sugar with natural alternatives. Technological advancements in sweetener production and extraction are improving the quality and affordability of these products, expanding market reach. Favorable regulatory policies in several regions promote the use of natural ingredients, further enhancing market growth. The growing demand for functional foods and beverages, featuring health-enhancing ingredients, significantly contributes to the market's expansion.
Challenges in the Natural Specialty Sweeteners Market Sector
Despite its robust growth potential, the Natural Specialty Sweeteners market faces some challenges. Fluctuations in raw material prices, particularly agricultural commodities, can affect production costs and profitability. Maintaining consistent product quality and purity can be challenging, demanding robust quality control measures across the supply chain. Competition from artificial sweeteners, which are often cheaper, poses a significant threat. Stringent regulatory frameworks, though beneficial for consumer safety, may increase compliance costs for companies.
Leading Players in the Natural Specialty Sweeteners Market Market
- Cargill Incorporated
- PureCircle Limited
- Archer Daniels Midland Company
- Tate & Lyle PLC
- DuPont
- Ingredion Incorporated
- Stevia First Corporation
- NutraSweet Company
- List Not Exhaustive
Key Developments in Natural Specialty Sweeteners Market Sector
- 2023 Q3: Cargill Incorporated launched a new line of organic stevia-based sweeteners.
- 2022 Q4: PureCircle Limited announced a strategic partnership to expand its distribution network in Asia.
- 2021 Q2: Archer Daniels Midland Company invested in a new facility for the production of natural sweeteners.
- Further developments will be included in the full report.
Strategic Natural Specialty Sweeteners Market Market Outlook
The Natural Specialty Sweeteners market presents a promising outlook, driven by long-term trends toward health-conscious consumption and technological innovation. Strategic opportunities exist in developing novel sweetener blends, expanding into emerging markets, and investing in research and development to improve product quality and cost-effectiveness. Focusing on sustainable sourcing practices and transparent labeling can further enhance market competitiveness and brand image. The market is poised for sustained growth, offering significant opportunities for existing and new players.
Natural Specialty Sweeteners Market Segmentation
-
1. Product Type
-
1.1. Starch Sweeteners and Sugar Alcohols
- 1.1.1. Dextrose
- 1.1.2. High Fructose Corn Syrup (HFCS)
- 1.1.3. Maltodextrin
- 1.1.4. Sorbitol
- 1.1.5. Xylitol
- 1.1.6. Others
-
1.2. High Intensity Sweeteners (HIS)
- 1.2.1. Sucralose
- 1.2.2. Aspartame
- 1.2.3. Saccharin
- 1.2.4. Cyclamate
- 1.2.5. Ace-K
- 1.2.6. Neotame
- 1.2.7. Stevia
-
1.1. Starch Sweeteners and Sugar Alcohols
-
2. Application
- 2.1. Dairy
- 2.2. Bakery
- 2.3. Soups, Sauces and Dressings
- 2.4. Confectionery
- 2.5. Beverages
- 2.6. Others
Natural Specialty Sweeteners Market Segmentation By Geography
-
1. North America
- 1.1. United States
- 1.2. Canada
- 1.3. Mexico
- 1.4. Rest of North America
-
2. Europe
- 2.1. Spain
- 2.2. United Kingdom
- 2.3. Germany
- 2.4. France
- 2.5. Italy
- 2.6. Russia
- 2.7. Rest of Europe
-
3. Asia Pacific
- 3.1. China
- 3.2. Japan
- 3.3. India
- 3.4. Australia
- 3.5. Rest of Asia Pacific
-
4. South America
- 4.1. Brazil
- 4.2. Argentina
- 4.3. Rest of South America
-
5. Middle East and Africa
- 5.1. South Africa
- 5.2. United Arab Emirates
- 5.3. Rest of Middle East and Africa
Natural Specialty Sweeteners Market REPORT HIGHLIGHTS
| Aspects | Details |
|---|---|
| Study Period | 2019-2033 |
| Base Year | 2024 |
| Estimated Year | 2025 |
| Forecast Period | 2025-2033 |
| Historical Period | 2019-2024 |
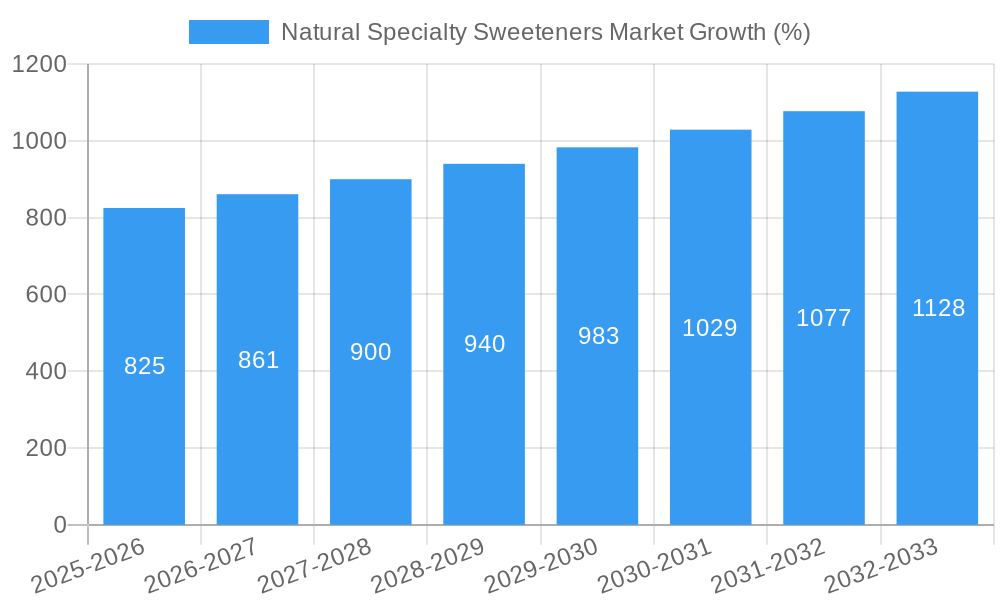
| Growth Rate | CAGR of 5.50% from 2019-2033 |
| Segmentation |
|
Table of Contents
- 1. Introduction
- 1.1. Research Scope
- 1.2. Market Segmentation
- 1.3. Research Methodology
- 1.4. Definitions and Assumptions
- 2. Executive Summary
- 2.1. Introduction
- 3. Market Dynamics
- 3.1. Introduction
- 3.2. Market Drivers
- 3.2.1. Shift towards Natural Sweeteners
- 3.3. Market Restrains
- 3.3.1. Health Concerns Related to Sweetener Consumption
- 3.4. Market Trends
- 3.4.1. Robust Demands From End-user Industries
- 4. Market Factor Analysis
- 4.1. Porters Five Forces
- 4.2. Supply/Value Chain
- 4.3. PESTEL analysis
- 4.4. Market Entropy
- 4.5. Patent/Trademark Analysis
- 5. Global Natural Specialty Sweeteners Market Analysis, Insights and Forecast, 2019-2031
- 5.1. Market Analysis, Insights and Forecast - by Product Type
- 5.1.1. Starch Sweeteners and Sugar Alcohols
- 5.1.1.1. Dextrose
- 5.1.1.2. High Fructose Corn Syrup (HFCS)
- 5.1.1.3. Maltodextrin
- 5.1.1.4. Sorbitol
- 5.1.1.5. Xylitol
- 5.1.1.6. Others
- 5.1.2. High Intensity Sweeteners (HIS)
- 5.1.2.1. Sucralose
- 5.1.2.2. Aspartame
- 5.1.2.3. Saccharin
- 5.1.2.4. Cyclamate
- 5.1.2.5. Ace-K
- 5.1.2.6. Neotame
- 5.1.2.7. Stevia
- 5.1.1. Starch Sweeteners and Sugar Alcohols
- 5.2. Market Analysis, Insights and Forecast - by Application
- 5.2.1. Dairy
- 5.2.2. Bakery
- 5.2.3. Soups, Sauces and Dressings
- 5.2.4. Confectionery
- 5.2.5. Beverages
- 5.2.6. Others
- 5.3. Market Analysis, Insights and Forecast - by Region
- 5.3.1. North America
- 5.3.2. Europe
- 5.3.3. Asia Pacific
- 5.3.4. South America
- 5.3.5. Middle East and Africa
- 5.1. Market Analysis, Insights and Forecast - by Product Type
- 6. North America Natural Specialty Sweeteners Market Analysis, Insights and Forecast, 2019-2031
- 6.1. Market Analysis, Insights and Forecast - by Product Type
- 6.1.1. Starch Sweeteners and Sugar Alcohols
- 6.1.1.1. Dextrose
- 6.1.1.2. High Fructose Corn Syrup (HFCS)
- 6.1.1.3. Maltodextrin
- 6.1.1.4. Sorbitol
- 6.1.1.5. Xylitol
- 6.1.1.6. Others
- 6.1.2. High Intensity Sweeteners (HIS)
- 6.1.2.1. Sucralose
- 6.1.2.2. Aspartame
- 6.1.2.3. Saccharin
- 6.1.2.4. Cyclamate
- 6.1.2.5. Ace-K
- 6.1.2.6. Neotame
- 6.1.2.7. Stevia
- 6.1.1. Starch Sweeteners and Sugar Alcohols
- 6.2. Market Analysis, Insights and Forecast - by Application
- 6.2.1. Dairy
- 6.2.2. Bakery
- 6.2.3. Soups, Sauces and Dressings
- 6.2.4. Confectionery
- 6.2.5. Beverages
- 6.2.6. Others
- 6.1. Market Analysis, Insights and Forecast - by Product Type
- 7. Europe Natural Specialty Sweeteners Market Analysis, Insights and Forecast, 2019-2031
- 7.1. Market Analysis, Insights and Forecast - by Product Type
- 7.1.1. Starch Sweeteners and Sugar Alcohols
- 7.1.1.1. Dextrose
- 7.1.1.2. High Fructose Corn Syrup (HFCS)
- 7.1.1.3. Maltodextrin
- 7.1.1.4. Sorbitol
- 7.1.1.5. Xylitol
- 7.1.1.6. Others
- 7.1.2. High Intensity Sweeteners (HIS)
- 7.1.2.1. Sucralose
- 7.1.2.2. Aspartame
- 7.1.2.3. Saccharin
- 7.1.2.4. Cyclamate
- 7.1.2.5. Ace-K
- 7.1.2.6. Neotame
- 7.1.2.7. Stevia
- 7.1.1. Starch Sweeteners and Sugar Alcohols
- 7.2. Market Analysis, Insights and Forecast - by Application
- 7.2.1. Dairy
- 7.2.2. Bakery
- 7.2.3. Soups, Sauces and Dressings
- 7.2.4. Confectionery
- 7.2.5. Beverages
- 7.2.6. Others
- 7.1. Market Analysis, Insights and Forecast - by Product Type
- 8. Asia Pacific Natural Specialty Sweeteners Market Analysis, Insights and Forecast, 2019-2031
- 8.1. Market Analysis, Insights and Forecast - by Product Type
- 8.1.1. Starch Sweeteners and Sugar Alcohols
- 8.1.1.1. Dextrose
- 8.1.1.2. High Fructose Corn Syrup (HFCS)
- 8.1.1.3. Maltodextrin
- 8.1.1.4. Sorbitol
- 8.1.1.5. Xylitol
- 8.1.1.6. Others
- 8.1.2. High Intensity Sweeteners (HIS)
- 8.1.2.1. Sucralose
- 8.1.2.2. Aspartame
- 8.1.2.3. Saccharin
- 8.1.2.4. Cyclamate
- 8.1.2.5. Ace-K
- 8.1.2.6. Neotame
- 8.1.2.7. Stevia
- 8.1.1. Starch Sweeteners and Sugar Alcohols
- 8.2. Market Analysis, Insights and Forecast - by Application
- 8.2.1. Dairy
- 8.2.2. Bakery
- 8.2.3. Soups, Sauces and Dressings
- 8.2.4. Confectionery
- 8.2.5. Beverages
- 8.2.6. Others
- 8.1. Market Analysis, Insights and Forecast - by Product Type
- 9. South America Natural Specialty Sweeteners Market Analysis, Insights and Forecast, 2019-2031
- 9.1. Market Analysis, Insights and Forecast - by Product Type
- 9.1.1. Starch Sweeteners and Sugar Alcohols
- 9.1.1.1. Dextrose
- 9.1.1.2. High Fructose Corn Syrup (HFCS)
- 9.1.1.3. Maltodextrin
- 9.1.1.4. Sorbitol
- 9.1.1.5. Xylitol
- 9.1.1.6. Others
- 9.1.2. High Intensity Sweeteners (HIS)
- 9.1.2.1. Sucralose
- 9.1.2.2. Aspartame
- 9.1.2.3. Saccharin
- 9.1.2.4. Cyclamate
- 9.1.2.5. Ace-K
- 9.1.2.6. Neotame
- 9.1.2.7. Stevia
- 9.1.1. Starch Sweeteners and Sugar Alcohols
- 9.2. Market Analysis, Insights and Forecast - by Application
- 9.2.1. Dairy
- 9.2.2. Bakery
- 9.2.3. Soups, Sauces and Dressings
- 9.2.4. Confectionery
- 9.2.5. Beverages
- 9.2.6. Others
- 9.1. Market Analysis, Insights and Forecast - by Product Type
- 10. Middle East and Africa Natural Specialty Sweeteners Market Analysis, Insights and Forecast, 2019-2031
- 10.1. Market Analysis, Insights and Forecast - by Product Type
- 10.1.1. Starch Sweeteners and Sugar Alcohols
- 10.1.1.1. Dextrose
- 10.1.1.2. High Fructose Corn Syrup (HFCS)
- 10.1.1.3. Maltodextrin
- 10.1.1.4. Sorbitol
- 10.1.1.5. Xylitol
- 10.1.1.6. Others
- 10.1.2. High Intensity Sweeteners (HIS)
- 10.1.2.1. Sucralose
- 10.1.2.2. Aspartame
- 10.1.2.3. Saccharin
- 10.1.2.4. Cyclamate
- 10.1.2.5. Ace-K
- 10.1.2.6. Neotame
- 10.1.2.7. Stevia
- 10.1.1. Starch Sweeteners and Sugar Alcohols
- 10.2. Market Analysis, Insights and Forecast - by Application
- 10.2.1. Dairy
- 10.2.2. Bakery
- 10.2.3. Soups, Sauces and Dressings
- 10.2.4. Confectionery
- 10.2.5. Beverages
- 10.2.6. Others
- 10.1. Market Analysis, Insights and Forecast - by Product Type
- 11. North America Natural Specialty Sweeteners Market Analysis, Insights and Forecast, 2019-2031
- 11.1. Market Analysis, Insights and Forecast - By Country/Sub-region
- 11.1.1 United States
- 11.1.2 Canada
- 11.1.3 Mexico
- 11.1.4 Rest of North America
- 12. Europe Natural Specialty Sweeteners Market Analysis, Insights and Forecast, 2019-2031
- 12.1. Market Analysis, Insights and Forecast - By Country/Sub-region
- 12.1.1 Spain
- 12.1.2 United Kingdom
- 12.1.3 Germany
- 12.1.4 France
- 12.1.5 Italy
- 12.1.6 Russia
- 12.1.7 Rest of Europe
- 13. Asia Pacific Natural Specialty Sweeteners Market Analysis, Insights and Forecast, 2019-2031
- 13.1. Market Analysis, Insights and Forecast - By Country/Sub-region
- 13.1.1 China
- 13.1.2 Japan
- 13.1.3 India
- 13.1.4 Australia
- 13.1.5 Rest of Asia Pacific
- 14. South America Natural Specialty Sweeteners Market Analysis, Insights and Forecast, 2019-2031
- 14.1. Market Analysis, Insights and Forecast - By Country/Sub-region
- 14.1.1 Brazil
- 14.1.2 Argentina
- 14.1.3 Rest of South America
- 15. Middle East and Africa Natural Specialty Sweeteners Market Analysis, Insights and Forecast, 2019-2031
- 15.1. Market Analysis, Insights and Forecast - By Country/Sub-region
- 15.1.1 South Africa
- 15.1.2 United Arab Emirates
- 15.1.3 Rest of Middle East and Africa
- 16. Competitive Analysis
- 16.1. Global Market Share Analysis 2024
- 16.2. Company Profiles
- 16.2.1 Cargill Incorporated
- 16.2.1.1. Overview
- 16.2.1.2. Products
- 16.2.1.3. SWOT Analysis
- 16.2.1.4. Recent Developments
- 16.2.1.5. Financials (Based on Availability)
- 16.2.2 PureCircle Limited
- 16.2.2.1. Overview
- 16.2.2.2. Products
- 16.2.2.3. SWOT Analysis
- 16.2.2.4. Recent Developments
- 16.2.2.5. Financials (Based on Availability)
- 16.2.3 Archer Daniels Midland Company
- 16.2.3.1. Overview
- 16.2.3.2. Products
- 16.2.3.3. SWOT Analysis
- 16.2.3.4. Recent Developments
- 16.2.3.5. Financials (Based on Availability)
- 16.2.4 Tate & Lyle PLC
- 16.2.4.1. Overview
- 16.2.4.2. Products
- 16.2.4.3. SWOT Analysis
- 16.2.4.4. Recent Developments
- 16.2.4.5. Financials (Based on Availability)
- 16.2.5 DuPont
- 16.2.5.1. Overview
- 16.2.5.2. Products
- 16.2.5.3. SWOT Analysis
- 16.2.5.4. Recent Developments
- 16.2.5.5. Financials (Based on Availability)
- 16.2.6 Ingredion Incorporated
- 16.2.6.1. Overview
- 16.2.6.2. Products
- 16.2.6.3. SWOT Analysis
- 16.2.6.4. Recent Developments
- 16.2.6.5. Financials (Based on Availability)
- 16.2.7 Stevia First Corporation
- 16.2.7.1. Overview
- 16.2.7.2. Products
- 16.2.7.3. SWOT Analysis
- 16.2.7.4. Recent Developments
- 16.2.7.5. Financials (Based on Availability)
- 16.2.8 NutraSweet Company*List Not Exhaustive
- 16.2.8.1. Overview
- 16.2.8.2. Products
- 16.2.8.3. SWOT Analysis
- 16.2.8.4. Recent Developments
- 16.2.8.5. Financials (Based on Availability)
- 16.2.1 Cargill Incorporated
List of Figures
- Figure 1: Global Natural Specialty Sweeteners Market Revenue Breakdown (Million, %) by Region 2024 & 2032
- Figure 2: Global Natural Specialty Sweeteners Market Volume Breakdown (K Tons, %) by Region 2024 & 2032
- Figure 3: North America Natural Specialty Sweeteners Market Revenue (Million), by Country 2024 & 2032
- Figure 4: North America Natural Specialty Sweeteners Market Volume (K Tons), by Country 2024 & 2032
- Figure 5: North America Natural Specialty Sweeteners Market Revenue Share (%), by Country 2024 & 2032
- Figure 6: North America Natural Specialty Sweeteners Market Volume Share (%), by Country 2024 & 2032
- Figure 7: Europe Natural Specialty Sweeteners Market Revenue (Million), by Country 2024 & 2032
- Figure 8: Europe Natural Specialty Sweeteners Market Volume (K Tons), by Country 2024 & 2032
- Figure 9: Europe Natural Specialty Sweeteners Market Revenue Share (%), by Country 2024 & 2032
- Figure 10: Europe Natural Specialty Sweeteners Market Volume Share (%), by Country 2024 & 2032
- Figure 11: Asia Pacific Natural Specialty Sweeteners Market Revenue (Million), by Country 2024 & 2032
- Figure 12: Asia Pacific Natural Specialty Sweeteners Market Volume (K Tons), by Country 2024 & 2032
- Figure 13: Asia Pacific Natural Specialty Sweeteners Market Revenue Share (%), by Country 2024 & 2032
- Figure 14: Asia Pacific Natural Specialty Sweeteners Market Volume Share (%), by Country 2024 & 2032
- Figure 15: South America Natural Specialty Sweeteners Market Revenue (Million), by Country 2024 & 2032
- Figure 16: South America Natural Specialty Sweeteners Market Volume (K Tons), by Country 2024 & 2032
- Figure 17: South America Natural Specialty Sweeteners Market Revenue Share (%), by Country 2024 & 2032
- Figure 18: South America Natural Specialty Sweeteners Market Volume Share (%), by Country 2024 & 2032
- Figure 19: Middle East and Africa Natural Specialty Sweeteners Market Revenue (Million), by Country 2024 & 2032
- Figure 20: Middle East and Africa Natural Specialty Sweeteners Market Volume (K Tons), by Country 2024 & 2032
- Figure 21: Middle East and Africa Natural Specialty Sweeteners Market Revenue Share (%), by Country 2024 & 2032
- Figure 22: Middle East and Africa Natural Specialty Sweeteners Market Volume Share (%), by Country 2024 & 2032
- Figure 23: North America Natural Specialty Sweeteners Market Revenue (Million), by Product Type 2024 & 2032
- Figure 24: North America Natural Specialty Sweeteners Market Volume (K Tons), by Product Type 2024 & 2032
- Figure 25: North America Natural Specialty Sweeteners Market Revenue Share (%), by Product Type 2024 & 2032
- Figure 26: North America Natural Specialty Sweeteners Market Volume Share (%), by Product Type 2024 & 2032
- Figure 27: North America Natural Specialty Sweeteners Market Revenue (Million), by Application 2024 & 2032
- Figure 28: North America Natural Specialty Sweeteners Market Volume (K Tons), by Application 2024 & 2032
- Figure 29: North America Natural Specialty Sweeteners Market Revenue Share (%), by Application 2024 & 2032
- Figure 30: North America Natural Specialty Sweeteners Market Volume Share (%), by Application 2024 & 2032
- Figure 31: North America Natural Specialty Sweeteners Market Revenue (Million), by Country 2024 & 2032
- Figure 32: North America Natural Specialty Sweeteners Market Volume (K Tons), by Country 2024 & 2032
- Figure 33: North America Natural Specialty Sweeteners Market Revenue Share (%), by Country 2024 & 2032
- Figure 34: North America Natural Specialty Sweeteners Market Volume Share (%), by Country 2024 & 2032
- Figure 35: Europe Natural Specialty Sweeteners Market Revenue (Million), by Product Type 2024 & 2032
- Figure 36: Europe Natural Specialty Sweeteners Market Volume (K Tons), by Product Type 2024 & 2032
- Figure 37: Europe Natural Specialty Sweeteners Market Revenue Share (%), by Product Type 2024 & 2032
- Figure 38: Europe Natural Specialty Sweeteners Market Volume Share (%), by Product Type 2024 & 2032
- Figure 39: Europe Natural Specialty Sweeteners Market Revenue (Million), by Application 2024 & 2032
- Figure 40: Europe Natural Specialty Sweeteners Market Volume (K Tons), by Application 2024 & 2032
- Figure 41: Europe Natural Specialty Sweeteners Market Revenue Share (%), by Application 2024 & 2032
- Figure 42: Europe Natural Specialty Sweeteners Market Volume Share (%), by Application 2024 & 2032
- Figure 43: Europe Natural Specialty Sweeteners Market Revenue (Million), by Country 2024 & 2032
- Figure 44: Europe Natural Specialty Sweeteners Market Volume (K Tons), by Country 2024 & 2032
- Figure 45: Europe Natural Specialty Sweeteners Market Revenue Share (%), by Country 2024 & 2032
- Figure 46: Europe Natural Specialty Sweeteners Market Volume Share (%), by Country 2024 & 2032
- Figure 47: Asia Pacific Natural Specialty Sweeteners Market Revenue (Million), by Product Type 2024 & 2032
- Figure 48: Asia Pacific Natural Specialty Sweeteners Market Volume (K Tons), by Product Type 2024 & 2032
- Figure 49: Asia Pacific Natural Specialty Sweeteners Market Revenue Share (%), by Product Type 2024 & 2032
- Figure 50: Asia Pacific Natural Specialty Sweeteners Market Volume Share (%), by Product Type 2024 & 2032
- Figure 51: Asia Pacific Natural Specialty Sweeteners Market Revenue (Million), by Application 2024 & 2032
- Figure 52: Asia Pacific Natural Specialty Sweeteners Market Volume (K Tons), by Application 2024 & 2032
- Figure 53: Asia Pacific Natural Specialty Sweeteners Market Revenue Share (%), by Application 2024 & 2032
- Figure 54: Asia Pacific Natural Specialty Sweeteners Market Volume Share (%), by Application 2024 & 2032
- Figure 55: Asia Pacific Natural Specialty Sweeteners Market Revenue (Million), by Country 2024 & 2032
- Figure 56: Asia Pacific Natural Specialty Sweeteners Market Volume (K Tons), by Country 2024 & 2032
- Figure 57: Asia Pacific Natural Specialty Sweeteners Market Revenue Share (%), by Country 2024 & 2032
- Figure 58: Asia Pacific Natural Specialty Sweeteners Market Volume Share (%), by Country 2024 & 2032
- Figure 59: South America Natural Specialty Sweeteners Market Revenue (Million), by Product Type 2024 & 2032
- Figure 60: South America Natural Specialty Sweeteners Market Volume (K Tons), by Product Type 2024 & 2032
- Figure 61: South America Natural Specialty Sweeteners Market Revenue Share (%), by Product Type 2024 & 2032
- Figure 62: South America Natural Specialty Sweeteners Market Volume Share (%), by Product Type 2024 & 2032
- Figure 63: South America Natural Specialty Sweeteners Market Revenue (Million), by Application 2024 & 2032
- Figure 64: South America Natural Specialty Sweeteners Market Volume (K Tons), by Application 2024 & 2032
- Figure 65: South America Natural Specialty Sweeteners Market Revenue Share (%), by Application 2024 & 2032
- Figure 66: South America Natural Specialty Sweeteners Market Volume Share (%), by Application 2024 & 2032
- Figure 67: South America Natural Specialty Sweeteners Market Revenue (Million), by Country 2024 & 2032
- Figure 68: South America Natural Specialty Sweeteners Market Volume (K Tons), by Country 2024 & 2032
- Figure 69: South America Natural Specialty Sweeteners Market Revenue Share (%), by Country 2024 & 2032
- Figure 70: South America Natural Specialty Sweeteners Market Volume Share (%), by Country 2024 & 2032
- Figure 71: Middle East and Africa Natural Specialty Sweeteners Market Revenue (Million), by Product Type 2024 & 2032
- Figure 72: Middle East and Africa Natural Specialty Sweeteners Market Volume (K Tons), by Product Type 2024 & 2032
- Figure 73: Middle East and Africa Natural Specialty Sweeteners Market Revenue Share (%), by Product Type 2024 & 2032
- Figure 74: Middle East and Africa Natural Specialty Sweeteners Market Volume Share (%), by Product Type 2024 & 2032
- Figure 75: Middle East and Africa Natural Specialty Sweeteners Market Revenue (Million), by Application 2024 & 2032
- Figure 76: Middle East and Africa Natural Specialty Sweeteners Market Volume (K Tons), by Application 2024 & 2032
- Figure 77: Middle East and Africa Natural Specialty Sweeteners Market Revenue Share (%), by Application 2024 & 2032
- Figure 78: Middle East and Africa Natural Specialty Sweeteners Market Volume Share (%), by Application 2024 & 2032
- Figure 79: Middle East and Africa Natural Specialty Sweeteners Market Revenue (Million), by Country 2024 & 2032
- Figure 80: Middle East and Africa Natural Specialty Sweeteners Market Volume (K Tons), by Country 2024 & 2032
- Figure 81: Middle East and Africa Natural Specialty Sweeteners Market Revenue Share (%), by Country 2024 & 2032
- Figure 82: Middle East and Africa Natural Specialty Sweeteners Market Volume Share (%), by Country 2024 & 2032
List of Tables
- Table 1: Global Natural Specialty Sweeteners Market Revenue Million Forecast, by Region 2019 & 2032
- Table 2: Global Natural Specialty Sweeteners Market Volume K Tons Forecast, by Region 2019 & 2032
- Table 3: Global Natural Specialty Sweeteners Market Revenue Million Forecast, by Product Type 2019 & 2032
- Table 4: Global Natural Specialty Sweeteners Market Volume K Tons Forecast, by Product Type 2019 & 2032
- Table 5: Global Natural Specialty Sweeteners Market Revenue Million Forecast, by Application 2019 & 2032
- Table 6: Global Natural Specialty Sweeteners Market Volume K Tons Forecast, by Application 2019 & 2032
- Table 7: Global Natural Specialty Sweeteners Market Revenue Million Forecast, by Region 2019 & 2032
- Table 8: Global Natural Specialty Sweeteners Market Volume K Tons Forecast, by Region 2019 & 2032
- Table 9: Global Natural Specialty Sweeteners Market Revenue Million Forecast, by Country 2019 & 2032
- Table 10: Global Natural Specialty Sweeteners Market Volume K Tons Forecast, by Country 2019 & 2032
- Table 11: United States Natural Specialty Sweeteners Market Revenue (Million) Forecast, by Application 2019 & 2032
- Table 12: United States Natural Specialty Sweeteners Market Volume (K Tons) Forecast, by Application 2019 & 2032
- Table 13: Canada Natural Specialty Sweeteners Market Revenue (Million) Forecast, by Application 2019 & 2032
- Table 14: Canada Natural Specialty Sweeteners Market Volume (K Tons) Forecast, by Application 2019 & 2032
- Table 15: Mexico Natural Specialty Sweeteners Market Revenue (Million) Forecast, by Application 2019 & 2032
- Table 16: Mexico Natural Specialty Sweeteners Market Volume (K Tons) Forecast, by Application 2019 & 2032
- Table 17: Rest of North America Natural Specialty Sweeteners Market Revenue (Million) Forecast, by Application 2019 & 2032
- Table 18: Rest of North America Natural Specialty Sweeteners Market Volume (K Tons) Forecast, by Application 2019 & 2032
- Table 19: Global Natural Specialty Sweeteners Market Revenue Million Forecast, by Country 2019 & 2032
- Table 20: Global Natural Specialty Sweeteners Market Volume K Tons Forecast, by Country 2019 & 2032
- Table 21: Spain Natural Specialty Sweeteners Market Revenue (Million) Forecast, by Application 2019 & 2032
- Table 22: Spain Natural Specialty Sweeteners Market Volume (K Tons) Forecast, by Application 2019 & 2032
- Table 23: United Kingdom Natural Specialty Sweeteners Market Revenue (Million) Forecast, by Application 2019 & 2032
- Table 24: United Kingdom Natural Specialty Sweeteners Market Volume (K Tons) Forecast, by Application 2019 & 2032
- Table 25: Germany Natural Specialty Sweeteners Market Revenue (Million) Forecast, by Application 2019 & 2032
- Table 26: Germany Natural Specialty Sweeteners Market Volume (K Tons) Forecast, by Application 2019 & 2032
- Table 27: France Natural Specialty Sweeteners Market Revenue (Million) Forecast, by Application 2019 & 2032
- Table 28: France Natural Specialty Sweeteners Market Volume (K Tons) Forecast, by Application 2019 & 2032
- Table 29: Italy Natural Specialty Sweeteners Market Revenue (Million) Forecast, by Application 2019 & 2032
- Table 30: Italy Natural Specialty Sweeteners Market Volume (K Tons) Forecast, by Application 2019 & 2032
- Table 31: Russia Natural Specialty Sweeteners Market Revenue (Million) Forecast, by Application 2019 & 2032
- Table 32: Russia Natural Specialty Sweeteners Market Volume (K Tons) Forecast, by Application 2019 & 2032
- Table 33: Rest of Europe Natural Specialty Sweeteners Market Revenue (Million) Forecast, by Application 2019 & 2032
- Table 34: Rest of Europe Natural Specialty Sweeteners Market Volume (K Tons) Forecast, by Application 2019 & 2032
- Table 35: Global Natural Specialty Sweeteners Market Revenue Million Forecast, by Country 2019 & 2032
- Table 36: Global Natural Specialty Sweeteners Market Volume K Tons Forecast, by Country 2019 & 2032
- Table 37: China Natural Specialty Sweeteners Market Revenue (Million) Forecast, by Application 2019 & 2032
- Table 38: China Natural Specialty Sweeteners Market Volume (K Tons) Forecast, by Application 2019 & 2032
- Table 39: Japan Natural Specialty Sweeteners Market Revenue (Million) Forecast, by Application 2019 & 2032
- Table 40: Japan Natural Specialty Sweeteners Market Volume (K Tons) Forecast, by Application 2019 & 2032
- Table 41: India Natural Specialty Sweeteners Market Revenue (Million) Forecast, by Application 2019 & 2032
- Table 42: India Natural Specialty Sweeteners Market Volume (K Tons) Forecast, by Application 2019 & 2032
- Table 43: Australia Natural Specialty Sweeteners Market Revenue (Million) Forecast, by Application 2019 & 2032
- Table 44: Australia Natural Specialty Sweeteners Market Volume (K Tons) Forecast, by Application 2019 & 2032
- Table 45: Rest of Asia Pacific Natural Specialty Sweeteners Market Revenue (Million) Forecast, by Application 2019 & 2032
- Table 46: Rest of Asia Pacific Natural Specialty Sweeteners Market Volume (K Tons) Forecast, by Application 2019 & 2032
- Table 47: Global Natural Specialty Sweeteners Market Revenue Million Forecast, by Country 2019 & 2032
- Table 48: Global Natural Specialty Sweeteners Market Volume K Tons Forecast, by Country 2019 & 2032
- Table 49: Brazil Natural Specialty Sweeteners Market Revenue (Million) Forecast, by Application 2019 & 2032
- Table 50: Brazil Natural Specialty Sweeteners Market Volume (K Tons) Forecast, by Application 2019 & 2032
- Table 51: Argentina Natural Specialty Sweeteners Market Revenue (Million) Forecast, by Application 2019 & 2032
- Table 52: Argentina Natural Specialty Sweeteners Market Volume (K Tons) Forecast, by Application 2019 & 2032
- Table 53: Rest of South America Natural Specialty Sweeteners Market Revenue (Million) Forecast, by Application 2019 & 2032
- Table 54: Rest of South America Natural Specialty Sweeteners Market Volume (K Tons) Forecast, by Application 2019 & 2032
- Table 55: Global Natural Specialty Sweeteners Market Revenue Million Forecast, by Country 2019 & 2032
- Table 56: Global Natural Specialty Sweeteners Market Volume K Tons Forecast, by Country 2019 & 2032
- Table 57: South Africa Natural Specialty Sweeteners Market Revenue (Million) Forecast, by Application 2019 & 2032
- Table 58: South Africa Natural Specialty Sweeteners Market Volume (K Tons) Forecast, by Application 2019 & 2032
- Table 59: United Arab Emirates Natural Specialty Sweeteners Market Revenue (Million) Forecast, by Application 2019 & 2032
- Table 60: United Arab Emirates Natural Specialty Sweeteners Market Volume (K Tons) Forecast, by Application 2019 & 2032
- Table 61: Rest of Middle East and Africa Natural Specialty Sweeteners Market Revenue (Million) Forecast, by Application 2019 & 2032
- Table 62: Rest of Middle East and Africa Natural Specialty Sweeteners Market Volume (K Tons) Forecast, by Application 2019 & 2032
- Table 63: Global Natural Specialty Sweeteners Market Revenue Million Forecast, by Product Type 2019 & 2032
- Table 64: Global Natural Specialty Sweeteners Market Volume K Tons Forecast, by Product Type 2019 & 2032
- Table 65: Global Natural Specialty Sweeteners Market Revenue Million Forecast, by Application 2019 & 2032
- Table 66: Global Natural Specialty Sweeteners Market Volume K Tons Forecast, by Application 2019 & 2032
- Table 67: Global Natural Specialty Sweeteners Market Revenue Million Forecast, by Country 2019 & 2032
- Table 68: Global Natural Specialty Sweeteners Market Volume K Tons Forecast, by Country 2019 & 2032
- Table 69: United States Natural Specialty Sweeteners Market Revenue (Million) Forecast, by Application 2019 & 2032
- Table 70: United States Natural Specialty Sweeteners Market Volume (K Tons) Forecast, by Application 2019 & 2032
- Table 71: Canada Natural Specialty Sweeteners Market Revenue (Million) Forecast, by Application 2019 & 2032
- Table 72: Canada Natural Specialty Sweeteners Market Volume (K Tons) Forecast, by Application 2019 & 2032
- Table 73: Mexico Natural Specialty Sweeteners Market Revenue (Million) Forecast, by Application 2019 & 2032
- Table 74: Mexico Natural Specialty Sweeteners Market Volume (K Tons) Forecast, by Application 2019 & 2032
- Table 75: Rest of North America Natural Specialty Sweeteners Market Revenue (Million) Forecast, by Application 2019 & 2032
- Table 76: Rest of North America Natural Specialty Sweeteners Market Volume (K Tons) Forecast, by Application 2019 & 2032
- Table 77: Global Natural Specialty Sweeteners Market Revenue Million Forecast, by Product Type 2019 & 2032
- Table 78: Global Natural Specialty Sweeteners Market Volume K Tons Forecast, by Product Type 2019 & 2032
- Table 79: Global Natural Specialty Sweeteners Market Revenue Million Forecast, by Application 2019 & 2032
- Table 80: Global Natural Specialty Sweeteners Market Volume K Tons Forecast, by Application 2019 & 2032
- Table 81: Global Natural Specialty Sweeteners Market Revenue Million Forecast, by Country 2019 & 2032
- Table 82: Global Natural Specialty Sweeteners Market Volume K Tons Forecast, by Country 2019 & 2032
- Table 83: Spain Natural Specialty Sweeteners Market Revenue (Million) Forecast, by Application 2019 & 2032
- Table 84: Spain Natural Specialty Sweeteners Market Volume (K Tons) Forecast, by Application 2019 & 2032
- Table 85: United Kingdom Natural Specialty Sweeteners Market Revenue (Million) Forecast, by Application 2019 & 2032
- Table 86: United Kingdom Natural Specialty Sweeteners Market Volume (K Tons) Forecast, by Application 2019 & 2032
- Table 87: Germany Natural Specialty Sweeteners Market Revenue (Million) Forecast, by Application 2019 & 2032
- Table 88: Germany Natural Specialty Sweeteners Market Volume (K Tons) Forecast, by Application 2019 & 2032
- Table 89: France Natural Specialty Sweeteners Market Revenue (Million) Forecast, by Application 2019 & 2032
- Table 90: France Natural Specialty Sweeteners Market Volume (K Tons) Forecast, by Application 2019 & 2032
- Table 91: Italy Natural Specialty Sweeteners Market Revenue (Million) Forecast, by Application 2019 & 2032
- Table 92: Italy Natural Specialty Sweeteners Market Volume (K Tons) Forecast, by Application 2019 & 2032
- Table 93: Russia Natural Specialty Sweeteners Market Revenue (Million) Forecast, by Application 2019 & 2032
- Table 94: Russia Natural Specialty Sweeteners Market Volume (K Tons) Forecast, by Application 2019 & 2032
- Table 95: Rest of Europe Natural Specialty Sweeteners Market Revenue (Million) Forecast, by Application 2019 & 2032
- Table 96: Rest of Europe Natural Specialty Sweeteners Market Volume (K Tons) Forecast, by Application 2019 & 2032
- Table 97: Global Natural Specialty Sweeteners Market Revenue Million Forecast, by Product Type 2019 & 2032
- Table 98: Global Natural Specialty Sweeteners Market Volume K Tons Forecast, by Product Type 2019 & 2032
- Table 99: Global Natural Specialty Sweeteners Market Revenue Million Forecast, by Application 2019 & 2032
- Table 100: Global Natural Specialty Sweeteners Market Volume K Tons Forecast, by Application 2019 & 2032
- Table 101: Global Natural Specialty Sweeteners Market Revenue Million Forecast, by Country 2019 & 2032
- Table 102: Global Natural Specialty Sweeteners Market Volume K Tons Forecast, by Country 2019 & 2032
- Table 103: China Natural Specialty Sweeteners Market Revenue (Million) Forecast, by Application 2019 & 2032
- Table 104: China Natural Specialty Sweeteners Market Volume (K Tons) Forecast, by Application 2019 & 2032
- Table 105: Japan Natural Specialty Sweeteners Market Revenue (Million) Forecast, by Application 2019 & 2032
- Table 106: Japan Natural Specialty Sweeteners Market Volume (K Tons) Forecast, by Application 2019 & 2032
- Table 107: India Natural Specialty Sweeteners Market Revenue (Million) Forecast, by Application 2019 & 2032
- Table 108: India Natural Specialty Sweeteners Market Volume (K Tons) Forecast, by Application 2019 & 2032
- Table 109: Australia Natural Specialty Sweeteners Market Revenue (Million) Forecast, by Application 2019 & 2032
- Table 110: Australia Natural Specialty Sweeteners Market Volume (K Tons) Forecast, by Application 2019 & 2032
- Table 111: Rest of Asia Pacific Natural Specialty Sweeteners Market Revenue (Million) Forecast, by Application 2019 & 2032
- Table 112: Rest of Asia Pacific Natural Specialty Sweeteners Market Volume (K Tons) Forecast, by Application 2019 & 2032
- Table 113: Global Natural Specialty Sweeteners Market Revenue Million Forecast, by Product Type 2019 & 2032
- Table 114: Global Natural Specialty Sweeteners Market Volume K Tons Forecast, by Product Type 2019 & 2032
- Table 115: Global Natural Specialty Sweeteners Market Revenue Million Forecast, by Application 2019 & 2032
- Table 116: Global Natural Specialty Sweeteners Market Volume K Tons Forecast, by Application 2019 & 2032
- Table 117: Global Natural Specialty Sweeteners Market Revenue Million Forecast, by Country 2019 & 2032
- Table 118: Global Natural Specialty Sweeteners Market Volume K Tons Forecast, by Country 2019 & 2032
- Table 119: Brazil Natural Specialty Sweeteners Market Revenue (Million) Forecast, by Application 2019 & 2032
- Table 120: Brazil Natural Specialty Sweeteners Market Volume (K Tons) Forecast, by Application 2019 & 2032
- Table 121: Argentina Natural Specialty Sweeteners Market Revenue (Million) Forecast, by Application 2019 & 2032
- Table 122: Argentina Natural Specialty Sweeteners Market Volume (K Tons) Forecast, by Application 2019 & 2032
- Table 123: Rest of South America Natural Specialty Sweeteners Market Revenue (Million) Forecast, by Application 2019 & 2032
- Table 124: Rest of South America Natural Specialty Sweeteners Market Volume (K Tons) Forecast, by Application 2019 & 2032
- Table 125: Global Natural Specialty Sweeteners Market Revenue Million Forecast, by Product Type 2019 & 2032
- Table 126: Global Natural Specialty Sweeteners Market Volume K Tons Forecast, by Product Type 2019 & 2032
- Table 127: Global Natural Specialty Sweeteners Market Revenue Million Forecast, by Application 2019 & 2032
- Table 128: Global Natural Specialty Sweeteners Market Volume K Tons Forecast, by Application 2019 & 2032
- Table 129: Global Natural Specialty Sweeteners Market Revenue Million Forecast, by Country 2019 & 2032
- Table 130: Global Natural Specialty Sweeteners Market Volume K Tons Forecast, by Country 2019 & 2032
- Table 131: South Africa Natural Specialty Sweeteners Market Revenue (Million) Forecast, by Application 2019 & 2032
- Table 132: South Africa Natural Specialty Sweeteners Market Volume (K Tons) Forecast, by Application 2019 & 2032
- Table 133: United Arab Emirates Natural Specialty Sweeteners Market Revenue (Million) Forecast, by Application 2019 & 2032
- Table 134: United Arab Emirates Natural Specialty Sweeteners Market Volume (K Tons) Forecast, by Application 2019 & 2032
- Table 135: Rest of Middle East and Africa Natural Specialty Sweeteners Market Revenue (Million) Forecast, by Application 2019 & 2032
- Table 136: Rest of Middle East and Africa Natural Specialty Sweeteners Market Volume (K Tons) Forecast, by Application 2019 & 2032
Frequently Asked Questions
1. What is the projected Compound Annual Growth Rate (CAGR) of the Natural Specialty Sweeteners Market?
The projected CAGR is approximately 5.50%.
2. Which companies are prominent players in the Natural Specialty Sweeteners Market?
Key companies in the market include Cargill Incorporated, PureCircle Limited, Archer Daniels Midland Company, Tate & Lyle PLC, DuPont, Ingredion Incorporated, Stevia First Corporation, NutraSweet Company*List Not Exhaustive.
3. What are the main segments of the Natural Specialty Sweeteners Market?
The market segments include Product Type, Application.
4. Can you provide details about the market size?
The market size is estimated to be USD XX Million as of 2022.
5. What are some drivers contributing to market growth?
Shift towards Natural Sweeteners.
6. What are the notable trends driving market growth?
Robust Demands From End-user Industries.
7. Are there any restraints impacting market growth?
Health Concerns Related to Sweetener Consumption.
8. Can you provide examples of recent developments in the market?
N/A
9. What pricing options are available for accessing the report?
Pricing options include single-user, multi-user, and enterprise licenses priced at USD 4750, USD 5250, and USD 8750 respectively.
10. Is the market size provided in terms of value or volume?
The market size is provided in terms of value, measured in Million and volume, measured in K Tons.
11. Are there any specific market keywords associated with the report?
Yes, the market keyword associated with the report is "Natural Specialty Sweeteners Market," which aids in identifying and referencing the specific market segment covered.
12. How do I determine which pricing option suits my needs best?
The pricing options vary based on user requirements and access needs. Individual users may opt for single-user licenses, while businesses requiring broader access may choose multi-user or enterprise licenses for cost-effective access to the report.
13. Are there any additional resources or data provided in the Natural Specialty Sweeteners Market report?
While the report offers comprehensive insights, it's advisable to review the specific contents or supplementary materials provided to ascertain if additional resources or data are available.
14. How can I stay updated on further developments or reports in the Natural Specialty Sweeteners Market?
To stay informed about further developments, trends, and reports in the Natural Specialty Sweeteners Market, consider subscribing to industry newsletters, following relevant companies and organizations, or regularly checking reputable industry news sources and publications.
Methodology
Step 1 - Identification of Relevant Samples Size from Population Database


Step 2 - Approaches for Defining Global Market Size (Value, Volume* & Price*)

Note*: In applicable scenarios
Step 3 - Data Sources
Primary Research
- Web Analytics
- Survey Reports
- Research Institute
- Latest Research Reports
- Opinion Leaders
Secondary Research
- Annual Reports
- White Paper
- Latest Press Release
- Industry Association
- Paid Database
- Investor Presentations

Step 4 - Data Triangulation
Involves using different sources of information in order to increase the validity of a study
These sources are likely to be stakeholders in a program - participants, other researchers, program staff, other community members, and so on.
Then we put all data in single framework & apply various statistical tools to find out the dynamic on the market.
During the analysis stage, feedback from the stakeholder groups would be compared to determine areas of agreement as well as areas of divergence


