
Key Insights
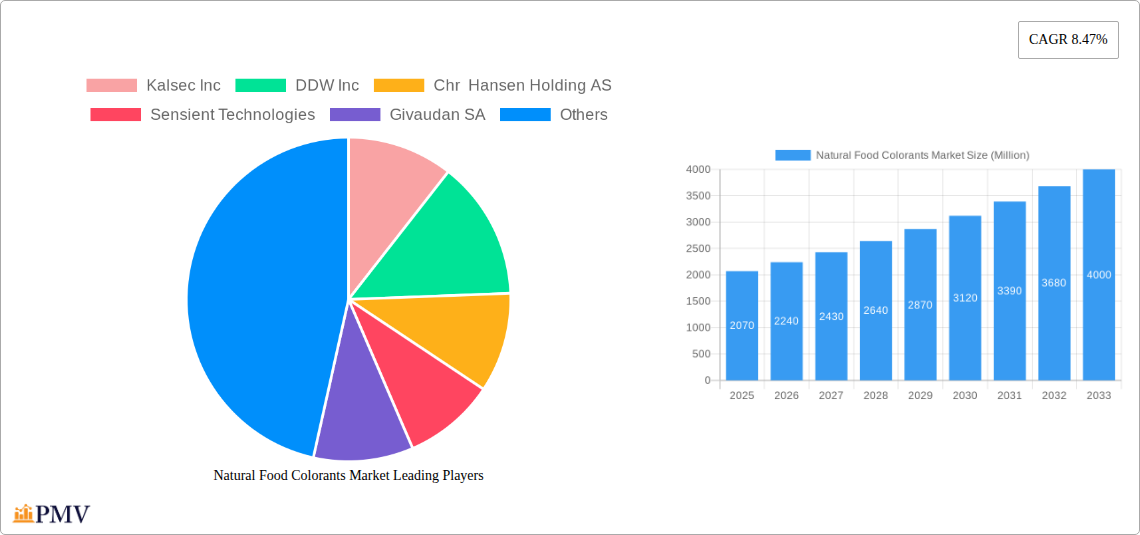
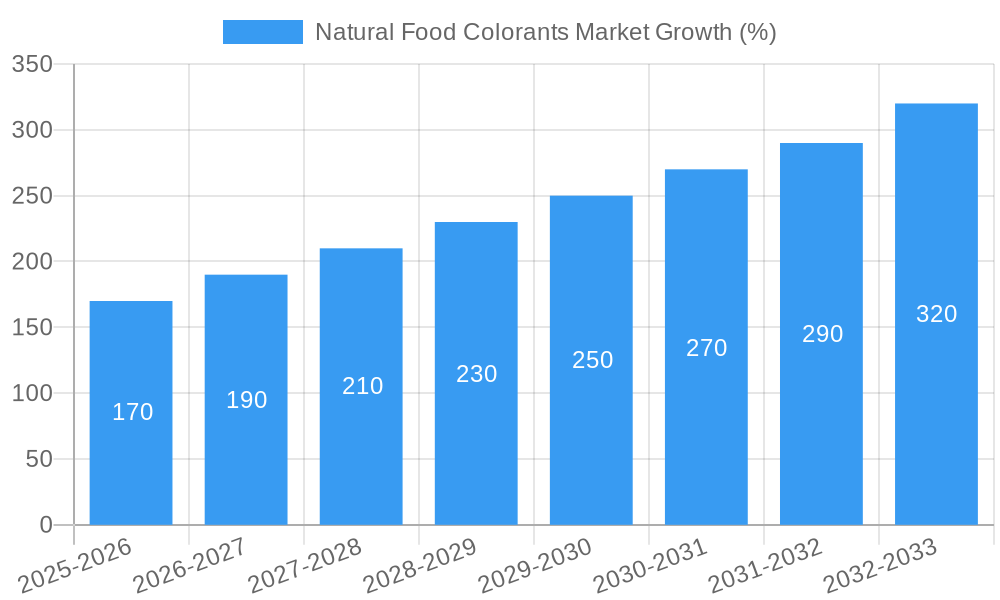
The global natural food colorants market, valued at $2.07 billion in 2025, is projected to experience robust growth, driven by a Compound Annual Growth Rate (CAGR) of 8.47% from 2025 to 2033. This expansion is fueled by several key factors. The increasing consumer preference for natural and clean-label products is a primary driver, with consumers actively seeking food and beverages free from artificial additives and synthetic colors. This trend is particularly strong in developed regions like North America and Europe, but is also gaining momentum in developing economies across Asia-Pacific and South America. Furthermore, the growing demand for functional foods and nutraceuticals, which often incorporate natural colorants for enhanced appeal and perceived health benefits, significantly contributes to market growth. The bakery and dairy industries are major application segments, while confectionery, beverages, and snacks represent substantial and rapidly growing markets for these colorants. However, challenges remain, including the higher cost of natural colorants compared to synthetic alternatives and the variability in their color stability and availability, creating potential restraints to market expansion. Technological advancements in extraction and processing techniques are addressing these limitations, improving the cost-effectiveness and performance of natural colorants and driving further market growth.
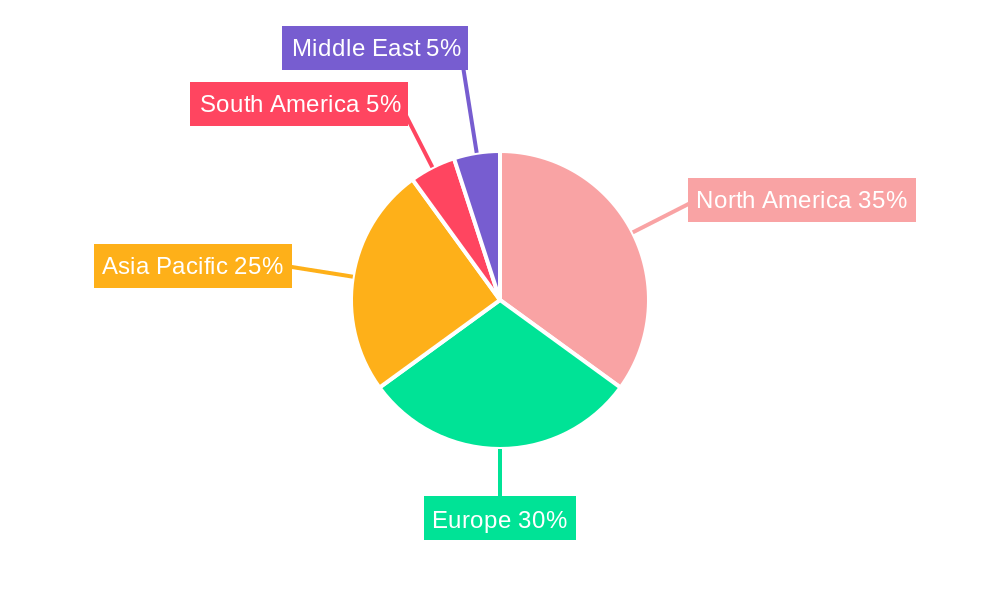
The market's segmentation reveals diverse application areas. Bakery products and dairy-based products continue to be dominant segments, driven by their widespread consumption. However, the "Other Products" category, encompassing beverages (alcoholic and non-alcoholic), confectionery, nutraceuticals, and snacks and cereals, shows significant growth potential. This segment is expected to outpace the growth of traditional segments due to the increasing innovation and demand for healthier and more visually appealing food and beverage options. Geographically, North America and Europe currently hold significant market shares, owing to high consumer awareness and established regulatory frameworks. However, the Asia-Pacific region is anticipated to witness the fastest growth, fueled by rising disposable incomes, changing lifestyles, and increasing demand for convenient and processed foods. Key players in this competitive market, including Kalsec Inc, DDW Inc, Chr Hansen Holding AS, and others, are actively investing in research and development to improve the quality, stability, and affordability of natural food colorants, contributing to market expansion.
Natural Food Colorants Market: A Comprehensive Report (2019-2033)
This in-depth report provides a comprehensive analysis of the Natural Food Colorants Market, covering market size, growth projections, competitive landscape, and key industry trends from 2019 to 2033. The study period spans 2019-2033, with 2025 serving as the base and estimated year. The forecast period is 2025-2033, and the historical period is 2019-2024. This report is essential for businesses, investors, and researchers seeking to understand and navigate this dynamic market. The market is projected to reach xx Million by 2033, exhibiting a CAGR of xx% during the forecast period.
Natural Food Colorants Market Market Structure & Competitive Dynamics
The Natural Food Colorants market exhibits a moderately consolidated structure, with several key players holding significant market share. Market concentration is influenced by factors such as R&D capabilities, brand recognition, and global distribution networks. Key players engage in strategic alliances, mergers and acquisitions (M&A), and product innovation to maintain their competitive edge. The regulatory landscape, particularly concerning food safety and labeling requirements, plays a crucial role in shaping market dynamics. The increasing consumer demand for natural and clean-label products fuels the market’s growth, while the availability of synthetic food colorants presents a competitive challenge.
Key Market Dynamics:
- Market Concentration: The top 5 players account for approximately xx% of the global market share.
- Innovation Ecosystems: Significant investments in R&D drive the development of novel colorants and applications.
- Regulatory Frameworks: Stringent regulations regarding safety and labeling influence product development and market access.
- Product Substitutes: Synthetic food colorants pose a competitive threat, particularly in price-sensitive markets.
- End-User Trends: Growing consumer preference for natural and clean-label products is a significant growth driver.
- M&A Activities: Recent years have witnessed several significant M&A deals, with deal values ranging from xx Million to xx Million, signifying the increasing market consolidation. For example, Givaudan SA’s acquisition of Naturex in 2018 significantly expanded its presence in the natural ingredients sector.
Natural Food Colorants Market Industry Trends & Insights
The Natural Food Colorants market is experiencing robust growth, driven by the escalating demand for natural and clean-label food products. Consumers are increasingly aware of the potential health implications of artificial additives, prompting a shift towards natural alternatives. Technological advancements in extraction, processing, and formulation techniques have led to the development of more stable, versatile, and cost-effective natural colorants. This trend is further amplified by the stringent regulations governing the use of artificial colors in several regions. The market penetration of natural food colorants is expected to increase from xx% in 2025 to xx% by 2033, reflecting the rising consumer preference. Competitive dynamics are intensified by the emergence of new players and continuous innovation in colorant technology.
Dominant Markets & Segments in Natural Food Colorants Market
The global Natural Food Colorants market is geographically diverse, with significant regional variations in consumption patterns and regulatory frameworks. While exact market share data requires further research (the provided context does not offer it), a detailed analysis would reveal leading regions and countries based on factors such as consumer preferences, economic development, and regulatory environments.
- By Application:
- Bakery: The bakery segment holds a significant market share due to the wide use of colorants in enhancing the visual appeal of bread, cakes, and other baked goods. Key drivers include rising disposable incomes and changing consumer preferences for aesthetically pleasing products.
- Dairy-based Products: The dairy segment displays steady growth, driven by the increasing demand for colored yogurt, ice cream, and cheese.
- Beverages: The beverage industry is a significant consumer of natural colorants, used in enhancing the color and appearance of juices, soft drinks, and alcoholic beverages.
- Non-alcoholic Beverages: This sector's demand is fueled by the trend towards healthier and naturally colored drinks.
- Confectionery: The confectionery sector utilizes natural colorants extensively in candies, chocolates, and other sweets.
- Nutraceuticals: The nutraceuticals sector is witnessing rising demand for naturally colored functional food and beverage products.
- Snacks and Cereals: Natural colorants are increasingly used to enhance the visual appeal of snacks and cereals.
- Other Applications: This category includes various applications such as pet food, cosmetics, and pharmaceuticals.
Dominance Analysis: (Further research is needed to specify a dominant region/country and provide quantifiable data to support the claim. This section requires more detailed market information.)
Natural Food Colorants Market Product Innovations
Recent innovations in the Natural Food Colorants market focus on improving the stability, intensity, and versatility of natural colorants. Companies are developing colorants with enhanced heat and light stability, expanding their application range across various food products. Technological advancements in extraction and processing methods contribute to producing higher-quality colorants at competitive prices. These innovations cater to the growing consumer demand for clean-label and naturally derived products, providing competitive advantages to companies that embrace technological advancements.
Report Segmentation & Scope
The Natural Food Colorants market is segmented by application: Bakery, Dairy-based Products, Beverages, Non-alcoholic Beverages, Confectionery, Nutraceuticals, Snacks and Cereals, and Other Applications. Each segment’s growth projections, market size estimates, and competitive dynamics are analyzed based on available historical data and growth forecasts. The report offers granular insights into each application, including its present state, future growth estimations, key players, and significant trends, allowing businesses to identify lucrative opportunities. Specific numbers for growth projections and market sizes will be incorporated in the full report.
Key Drivers of Natural Food Colorants Market Growth
The Natural Food Colorants market's growth is driven by several factors, including the rising consumer preference for natural and clean-label products, the increasing awareness of the potential health risks associated with artificial food colors, and the stringent regulations governing the use of synthetic colorants in various regions. Technological advancements in extraction and processing techniques have also facilitated the development of more stable, versatile, and cost-effective natural colorants. The expanding food and beverage industry further fuels demand for natural colorants across multiple product categories.
Challenges in the Natural Food Colorants Market Sector
Despite the significant growth potential, the Natural Food Colorants market faces several challenges. The high cost of production compared to synthetic alternatives remains a hurdle for wider adoption. Variations in the color intensity and stability of natural colorants pose challenges in maintaining consistent product quality. Supply chain complexities and the seasonal availability of raw materials can affect the production capacity and pricing of natural colorants. Furthermore, meeting the stringent regulatory requirements for food safety and labeling adds to the production costs and complexities.
Leading Players in the Natural Food Colorants Market Market
- Kalsec Inc
- DDW Inc
- Chr. Hansen Holding AS
- Sensient Technologies
- Givaudan SA
- Koninklijke DSM NV
- Synthite Industries Private Ltd
- Symrise AG
- Archer Daniels Midland Company
*List Not Exhaustive
Key Developments in Natural Food Colorants Market Sector
- January 2021: GNT Group launched EXBERRY® Shade Pink - OD, a new pink coloring agent for fat-based applications.
- October 2020: Chr. Hansen Natural Colors opened an R&D center in Montpellier, France, focusing on green, blue, and brown hues.
- September 2018: Givaudan SA acquired Naturex, strengthening its portfolio of plant extracts and natural ingredients.
- April 2016: Sensient Technologies launched SupraRed™, a heat-stable natural red color for baking and dry grocery products.
Strategic Natural Food Colorants Market Market Outlook
The Natural Food Colorants market is poised for continued growth, driven by sustained consumer demand for clean-label products and ongoing technological advancements. Strategic opportunities lie in developing innovative color solutions tailored to specific food applications, improving color stability and consistency, and optimizing supply chain efficiencies. Companies focusing on sustainability and ethical sourcing of raw materials will gain a competitive advantage. The market's future hinges on adapting to evolving consumer preferences and regulatory landscapes.
Natural Food Colorants Market Segmentation
-
1. Application
- 1.1. Bakery
-
1.2. Dairy-based Products
- 1.2.1. Ice Cream
- 1.2.2. Other Products
-
1.3. Beverages
- 1.3.1. Alcoholic Beverages
- 1.3.2. Non-alcoholic Beverages
- 1.4. Confectionery
- 1.5. Nutraceuticals
- 1.6. Snacks and Cereals
- 1.7. Other Applications
Natural Food Colorants Market Segmentation By Geography
-
1. North America
- 1.1. United States
- 1.2. Canada
- 1.3. Mexico
- 1.4. Rest of North America
-
2. Europe
- 2.1. United Kingdom
- 2.2. Germany
- 2.3. Italy
- 2.4. Russia
- 2.5. Spain
- 2.6. France
- 2.7. Rest of Europe
-
3. Asia Pacific
- 3.1. China
- 3.2. Japan
- 3.3. India
- 3.4. Australia
- 3.5. Rest of Asia Pacific
-
4. South America
- 4.1. Brazil
- 4.2. Argentina
- 4.3. Rest of South America
- 5. Middle East
-
6. United Arab Emirates
- 6.1. Saudi Arabia
- 6.2. Egypt
- 6.3. South Africa
- 6.4. Rest of Middle East
Natural Food Colorants Market REPORT HIGHLIGHTS
| Aspects | Details |
|---|---|
| Study Period | 2019-2033 |
| Base Year | 2024 |
| Estimated Year | 2025 |
| Forecast Period | 2025-2033 |
| Historical Period | 2019-2024 |
| Growth Rate | CAGR of 8.47% from 2019-2033 |
| Segmentation |
|
Table of Contents
- 1. Introduction
- 1.1. Research Scope
- 1.2. Market Segmentation
- 1.3. Research Methodology
- 1.4. Definitions and Assumptions
- 2. Executive Summary
- 2.1. Introduction
- 3. Market Dynamics
- 3.1. Introduction
- 3.2. Market Drivers
- 3.2.1. Rising Health Consciousness among consumer
- 3.3. Market Restrains
- 3.3.1. High Cost of natural Ingredients
- 3.4. Market Trends
- 3.4.1. Brightening Spotlight on Coloring Foodstuff
- 4. Market Factor Analysis
- 4.1. Porters Five Forces
- 4.2. Supply/Value Chain
- 4.3. PESTEL analysis
- 4.4. Market Entropy
- 4.5. Patent/Trademark Analysis
- 5. Global Natural Food Colorants Market Analysis, Insights and Forecast, 2019-2031
- 5.1. Market Analysis, Insights and Forecast - by Application
- 5.1.1. Bakery
- 5.1.2. Dairy-based Products
- 5.1.2.1. Ice Cream
- 5.1.2.2. Other Products
- 5.1.3. Beverages
- 5.1.3.1. Alcoholic Beverages
- 5.1.3.2. Non-alcoholic Beverages
- 5.1.4. Confectionery
- 5.1.5. Nutraceuticals
- 5.1.6. Snacks and Cereals
- 5.1.7. Other Applications
- 5.2. Market Analysis, Insights and Forecast - by Region
- 5.2.1. North America
- 5.2.2. Europe
- 5.2.3. Asia Pacific
- 5.2.4. South America
- 5.2.5. Middle East
- 5.2.6. United Arab Emirates
- 5.1. Market Analysis, Insights and Forecast - by Application
- 6. North America Natural Food Colorants Market Analysis, Insights and Forecast, 2019-2031
- 6.1. Market Analysis, Insights and Forecast - by Application
- 6.1.1. Bakery
- 6.1.2. Dairy-based Products
- 6.1.2.1. Ice Cream
- 6.1.2.2. Other Products
- 6.1.3. Beverages
- 6.1.3.1. Alcoholic Beverages
- 6.1.3.2. Non-alcoholic Beverages
- 6.1.4. Confectionery
- 6.1.5. Nutraceuticals
- 6.1.6. Snacks and Cereals
- 6.1.7. Other Applications
- 6.1. Market Analysis, Insights and Forecast - by Application
- 7. Europe Natural Food Colorants Market Analysis, Insights and Forecast, 2019-2031
- 7.1. Market Analysis, Insights and Forecast - by Application
- 7.1.1. Bakery
- 7.1.2. Dairy-based Products
- 7.1.2.1. Ice Cream
- 7.1.2.2. Other Products
- 7.1.3. Beverages
- 7.1.3.1. Alcoholic Beverages
- 7.1.3.2. Non-alcoholic Beverages
- 7.1.4. Confectionery
- 7.1.5. Nutraceuticals
- 7.1.6. Snacks and Cereals
- 7.1.7. Other Applications
- 7.1. Market Analysis, Insights and Forecast - by Application
- 8. Asia Pacific Natural Food Colorants Market Analysis, Insights and Forecast, 2019-2031
- 8.1. Market Analysis, Insights and Forecast - by Application
- 8.1.1. Bakery
- 8.1.2. Dairy-based Products
- 8.1.2.1. Ice Cream
- 8.1.2.2. Other Products
- 8.1.3. Beverages
- 8.1.3.1. Alcoholic Beverages
- 8.1.3.2. Non-alcoholic Beverages
- 8.1.4. Confectionery
- 8.1.5. Nutraceuticals
- 8.1.6. Snacks and Cereals
- 8.1.7. Other Applications
- 8.1. Market Analysis, Insights and Forecast - by Application
- 9. South America Natural Food Colorants Market Analysis, Insights and Forecast, 2019-2031
- 9.1. Market Analysis, Insights and Forecast - by Application
- 9.1.1. Bakery
- 9.1.2. Dairy-based Products
- 9.1.2.1. Ice Cream
- 9.1.2.2. Other Products
- 9.1.3. Beverages
- 9.1.3.1. Alcoholic Beverages
- 9.1.3.2. Non-alcoholic Beverages
- 9.1.4. Confectionery
- 9.1.5. Nutraceuticals
- 9.1.6. Snacks and Cereals
- 9.1.7. Other Applications
- 9.1. Market Analysis, Insights and Forecast - by Application
- 10. Middle East Natural Food Colorants Market Analysis, Insights and Forecast, 2019-2031
- 10.1. Market Analysis, Insights and Forecast - by Application
- 10.1.1. Bakery
- 10.1.2. Dairy-based Products
- 10.1.2.1. Ice Cream
- 10.1.2.2. Other Products
- 10.1.3. Beverages
- 10.1.3.1. Alcoholic Beverages
- 10.1.3.2. Non-alcoholic Beverages
- 10.1.4. Confectionery
- 10.1.5. Nutraceuticals
- 10.1.6. Snacks and Cereals
- 10.1.7. Other Applications
- 10.1. Market Analysis, Insights and Forecast - by Application
- 11. United Arab Emirates Natural Food Colorants Market Analysis, Insights and Forecast, 2019-2031
- 11.1. Market Analysis, Insights and Forecast - by Application
- 11.1.1. Bakery
- 11.1.2. Dairy-based Products
- 11.1.2.1. Ice Cream
- 11.1.2.2. Other Products
- 11.1.3. Beverages
- 11.1.3.1. Alcoholic Beverages
- 11.1.3.2. Non-alcoholic Beverages
- 11.1.4. Confectionery
- 11.1.5. Nutraceuticals
- 11.1.6. Snacks and Cereals
- 11.1.7. Other Applications
- 11.1. Market Analysis, Insights and Forecast - by Application
- 12. North America Natural Food Colorants Market Analysis, Insights and Forecast, 2019-2031
- 12.1. Market Analysis, Insights and Forecast - By Country/Sub-region
- 12.1.1 United States
- 12.1.2 Canada
- 12.1.3 Mexico
- 12.1.4 Rest of North America
- 13. Europe Natural Food Colorants Market Analysis, Insights and Forecast, 2019-2031
- 13.1. Market Analysis, Insights and Forecast - By Country/Sub-region
- 13.1.1 United Kingdom
- 13.1.2 Germany
- 13.1.3 Italy
- 13.1.4 Russia
- 13.1.5 Spain
- 13.1.6 France
- 13.1.7 Rest of Europe
- 14. Asia Pacific Natural Food Colorants Market Analysis, Insights and Forecast, 2019-2031
- 14.1. Market Analysis, Insights and Forecast - By Country/Sub-region
- 14.1.1 China
- 14.1.2 Japan
- 14.1.3 India
- 14.1.4 Australia
- 14.1.5 Rest of Asia Pacific
- 15. South America Natural Food Colorants Market Analysis, Insights and Forecast, 2019-2031
- 15.1. Market Analysis, Insights and Forecast - By Country/Sub-region
- 15.1.1 Brazil
- 15.1.2 Argentina
- 15.1.3 Rest of South America
- 16. Middle East Natural Food Colorants Market Analysis, Insights and Forecast, 2019-2031
- 16.1. Market Analysis, Insights and Forecast - By Country/Sub-region
- 16.1.1.
- 17. United Arab Emirates Natural Food Colorants Market Analysis, Insights and Forecast, 2019-2031
- 17.1. Market Analysis, Insights and Forecast - By Country/Sub-region
- 17.1.1 Saudi Arabia
- 17.1.2 Egypt
- 17.1.3 South Africa
- 17.1.4 Rest of Middle East
- 18. Competitive Analysis
- 18.1. Global Market Share Analysis 2024
- 18.2. Company Profiles
- 18.2.1 Kalsec Inc
- 18.2.1.1. Overview
- 18.2.1.2. Products
- 18.2.1.3. SWOT Analysis
- 18.2.1.4. Recent Developments
- 18.2.1.5. Financials (Based on Availability)
- 18.2.2 DDW Inc
- 18.2.2.1. Overview
- 18.2.2.2. Products
- 18.2.2.3. SWOT Analysis
- 18.2.2.4. Recent Developments
- 18.2.2.5. Financials (Based on Availability)
- 18.2.3 Chr Hansen Holding AS
- 18.2.3.1. Overview
- 18.2.3.2. Products
- 18.2.3.3. SWOT Analysis
- 18.2.3.4. Recent Developments
- 18.2.3.5. Financials (Based on Availability)
- 18.2.4 Sensient Technologies
- 18.2.4.1. Overview
- 18.2.4.2. Products
- 18.2.4.3. SWOT Analysis
- 18.2.4.4. Recent Developments
- 18.2.4.5. Financials (Based on Availability)
- 18.2.5 Givaudan SA
- 18.2.5.1. Overview
- 18.2.5.2. Products
- 18.2.5.3. SWOT Analysis
- 18.2.5.4. Recent Developments
- 18.2.5.5. Financials (Based on Availability)
- 18.2.6 Koninklijke DSM NV
- 18.2.6.1. Overview
- 18.2.6.2. Products
- 18.2.6.3. SWOT Analysis
- 18.2.6.4. Recent Developments
- 18.2.6.5. Financials (Based on Availability)
- 18.2.7 Synthite Industries Private Ltd
- 18.2.7.1. Overview
- 18.2.7.2. Products
- 18.2.7.3. SWOT Analysis
- 18.2.7.4. Recent Developments
- 18.2.7.5. Financials (Based on Availability)
- 18.2.8 Symrise AG
- 18.2.8.1. Overview
- 18.2.8.2. Products
- 18.2.8.3. SWOT Analysis
- 18.2.8.4. Recent Developments
- 18.2.8.5. Financials (Based on Availability)
- 18.2.9 Archer Daniels Midland Company*List Not Exhaustive
- 18.2.9.1. Overview
- 18.2.9.2. Products
- 18.2.9.3. SWOT Analysis
- 18.2.9.4. Recent Developments
- 18.2.9.5. Financials (Based on Availability)
- 18.2.1 Kalsec Inc
List of Figures
- Figure 1: Global Natural Food Colorants Market Revenue Breakdown (Million, %) by Region 2024 & 2032
- Figure 2: North America Natural Food Colorants Market Revenue (Million), by Country 2024 & 2032
- Figure 3: North America Natural Food Colorants Market Revenue Share (%), by Country 2024 & 2032
- Figure 4: Europe Natural Food Colorants Market Revenue (Million), by Country 2024 & 2032
- Figure 5: Europe Natural Food Colorants Market Revenue Share (%), by Country 2024 & 2032
- Figure 6: Asia Pacific Natural Food Colorants Market Revenue (Million), by Country 2024 & 2032
- Figure 7: Asia Pacific Natural Food Colorants Market Revenue Share (%), by Country 2024 & 2032
- Figure 8: South America Natural Food Colorants Market Revenue (Million), by Country 2024 & 2032
- Figure 9: South America Natural Food Colorants Market Revenue Share (%), by Country 2024 & 2032
- Figure 10: Middle East Natural Food Colorants Market Revenue (Million), by Country 2024 & 2032
- Figure 11: Middle East Natural Food Colorants Market Revenue Share (%), by Country 2024 & 2032
- Figure 12: United Arab Emirates Natural Food Colorants Market Revenue (Million), by Country 2024 & 2032
- Figure 13: United Arab Emirates Natural Food Colorants Market Revenue Share (%), by Country 2024 & 2032
- Figure 14: North America Natural Food Colorants Market Revenue (Million), by Application 2024 & 2032
- Figure 15: North America Natural Food Colorants Market Revenue Share (%), by Application 2024 & 2032
- Figure 16: North America Natural Food Colorants Market Revenue (Million), by Country 2024 & 2032
- Figure 17: North America Natural Food Colorants Market Revenue Share (%), by Country 2024 & 2032
- Figure 18: Europe Natural Food Colorants Market Revenue (Million), by Application 2024 & 2032
- Figure 19: Europe Natural Food Colorants Market Revenue Share (%), by Application 2024 & 2032
- Figure 20: Europe Natural Food Colorants Market Revenue (Million), by Country 2024 & 2032
- Figure 21: Europe Natural Food Colorants Market Revenue Share (%), by Country 2024 & 2032
- Figure 22: Asia Pacific Natural Food Colorants Market Revenue (Million), by Application 2024 & 2032
- Figure 23: Asia Pacific Natural Food Colorants Market Revenue Share (%), by Application 2024 & 2032
- Figure 24: Asia Pacific Natural Food Colorants Market Revenue (Million), by Country 2024 & 2032
- Figure 25: Asia Pacific Natural Food Colorants Market Revenue Share (%), by Country 2024 & 2032
- Figure 26: South America Natural Food Colorants Market Revenue (Million), by Application 2024 & 2032
- Figure 27: South America Natural Food Colorants Market Revenue Share (%), by Application 2024 & 2032
- Figure 28: South America Natural Food Colorants Market Revenue (Million), by Country 2024 & 2032
- Figure 29: South America Natural Food Colorants Market Revenue Share (%), by Country 2024 & 2032
- Figure 30: Middle East Natural Food Colorants Market Revenue (Million), by Application 2024 & 2032
- Figure 31: Middle East Natural Food Colorants Market Revenue Share (%), by Application 2024 & 2032
- Figure 32: Middle East Natural Food Colorants Market Revenue (Million), by Country 2024 & 2032
- Figure 33: Middle East Natural Food Colorants Market Revenue Share (%), by Country 2024 & 2032
- Figure 34: United Arab Emirates Natural Food Colorants Market Revenue (Million), by Application 2024 & 2032
- Figure 35: United Arab Emirates Natural Food Colorants Market Revenue Share (%), by Application 2024 & 2032
- Figure 36: United Arab Emirates Natural Food Colorants Market Revenue (Million), by Country 2024 & 2032
- Figure 37: United Arab Emirates Natural Food Colorants Market Revenue Share (%), by Country 2024 & 2032
List of Tables
- Table 1: Global Natural Food Colorants Market Revenue Million Forecast, by Region 2019 & 2032
- Table 2: Global Natural Food Colorants Market Revenue Million Forecast, by Application 2019 & 2032
- Table 3: Global Natural Food Colorants Market Revenue Million Forecast, by Region 2019 & 2032
- Table 4: Global Natural Food Colorants Market Revenue Million Forecast, by Country 2019 & 2032
- Table 5: United States Natural Food Colorants Market Revenue (Million) Forecast, by Application 2019 & 2032
- Table 6: Canada Natural Food Colorants Market Revenue (Million) Forecast, by Application 2019 & 2032
- Table 7: Mexico Natural Food Colorants Market Revenue (Million) Forecast, by Application 2019 & 2032
- Table 8: Rest of North America Natural Food Colorants Market Revenue (Million) Forecast, by Application 2019 & 2032
- Table 9: Global Natural Food Colorants Market Revenue Million Forecast, by Country 2019 & 2032
- Table 10: United Kingdom Natural Food Colorants Market Revenue (Million) Forecast, by Application 2019 & 2032
- Table 11: Germany Natural Food Colorants Market Revenue (Million) Forecast, by Application 2019 & 2032
- Table 12: Italy Natural Food Colorants Market Revenue (Million) Forecast, by Application 2019 & 2032
- Table 13: Russia Natural Food Colorants Market Revenue (Million) Forecast, by Application 2019 & 2032
- Table 14: Spain Natural Food Colorants Market Revenue (Million) Forecast, by Application 2019 & 2032
- Table 15: France Natural Food Colorants Market Revenue (Million) Forecast, by Application 2019 & 2032
- Table 16: Rest of Europe Natural Food Colorants Market Revenue (Million) Forecast, by Application 2019 & 2032
- Table 17: Global Natural Food Colorants Market Revenue Million Forecast, by Country 2019 & 2032
- Table 18: China Natural Food Colorants Market Revenue (Million) Forecast, by Application 2019 & 2032
- Table 19: Japan Natural Food Colorants Market Revenue (Million) Forecast, by Application 2019 & 2032
- Table 20: India Natural Food Colorants Market Revenue (Million) Forecast, by Application 2019 & 2032
- Table 21: Australia Natural Food Colorants Market Revenue (Million) Forecast, by Application 2019 & 2032
- Table 22: Rest of Asia Pacific Natural Food Colorants Market Revenue (Million) Forecast, by Application 2019 & 2032
- Table 23: Global Natural Food Colorants Market Revenue Million Forecast, by Country 2019 & 2032
- Table 24: Brazil Natural Food Colorants Market Revenue (Million) Forecast, by Application 2019 & 2032
- Table 25: Argentina Natural Food Colorants Market Revenue (Million) Forecast, by Application 2019 & 2032
- Table 26: Rest of South America Natural Food Colorants Market Revenue (Million) Forecast, by Application 2019 & 2032
- Table 27: Global Natural Food Colorants Market Revenue Million Forecast, by Country 2019 & 2032
- Table 28: Natural Food Colorants Market Revenue (Million) Forecast, by Application 2019 & 2032
- Table 29: Global Natural Food Colorants Market Revenue Million Forecast, by Country 2019 & 2032
- Table 30: Saudi Arabia Natural Food Colorants Market Revenue (Million) Forecast, by Application 2019 & 2032
- Table 31: Egypt Natural Food Colorants Market Revenue (Million) Forecast, by Application 2019 & 2032
- Table 32: South Africa Natural Food Colorants Market Revenue (Million) Forecast, by Application 2019 & 2032
- Table 33: Rest of Middle East Natural Food Colorants Market Revenue (Million) Forecast, by Application 2019 & 2032
- Table 34: Global Natural Food Colorants Market Revenue Million Forecast, by Application 2019 & 2032
- Table 35: Global Natural Food Colorants Market Revenue Million Forecast, by Country 2019 & 2032
- Table 36: United States Natural Food Colorants Market Revenue (Million) Forecast, by Application 2019 & 2032
- Table 37: Canada Natural Food Colorants Market Revenue (Million) Forecast, by Application 2019 & 2032
- Table 38: Mexico Natural Food Colorants Market Revenue (Million) Forecast, by Application 2019 & 2032
- Table 39: Rest of North America Natural Food Colorants Market Revenue (Million) Forecast, by Application 2019 & 2032
- Table 40: Global Natural Food Colorants Market Revenue Million Forecast, by Application 2019 & 2032
- Table 41: Global Natural Food Colorants Market Revenue Million Forecast, by Country 2019 & 2032
- Table 42: United Kingdom Natural Food Colorants Market Revenue (Million) Forecast, by Application 2019 & 2032
- Table 43: Germany Natural Food Colorants Market Revenue (Million) Forecast, by Application 2019 & 2032
- Table 44: Italy Natural Food Colorants Market Revenue (Million) Forecast, by Application 2019 & 2032
- Table 45: Russia Natural Food Colorants Market Revenue (Million) Forecast, by Application 2019 & 2032
- Table 46: Spain Natural Food Colorants Market Revenue (Million) Forecast, by Application 2019 & 2032
- Table 47: France Natural Food Colorants Market Revenue (Million) Forecast, by Application 2019 & 2032
- Table 48: Rest of Europe Natural Food Colorants Market Revenue (Million) Forecast, by Application 2019 & 2032
- Table 49: Global Natural Food Colorants Market Revenue Million Forecast, by Application 2019 & 2032
- Table 50: Global Natural Food Colorants Market Revenue Million Forecast, by Country 2019 & 2032
- Table 51: China Natural Food Colorants Market Revenue (Million) Forecast, by Application 2019 & 2032
- Table 52: Japan Natural Food Colorants Market Revenue (Million) Forecast, by Application 2019 & 2032
- Table 53: India Natural Food Colorants Market Revenue (Million) Forecast, by Application 2019 & 2032
- Table 54: Australia Natural Food Colorants Market Revenue (Million) Forecast, by Application 2019 & 2032
- Table 55: Rest of Asia Pacific Natural Food Colorants Market Revenue (Million) Forecast, by Application 2019 & 2032
- Table 56: Global Natural Food Colorants Market Revenue Million Forecast, by Application 2019 & 2032
- Table 57: Global Natural Food Colorants Market Revenue Million Forecast, by Country 2019 & 2032
- Table 58: Brazil Natural Food Colorants Market Revenue (Million) Forecast, by Application 2019 & 2032
- Table 59: Argentina Natural Food Colorants Market Revenue (Million) Forecast, by Application 2019 & 2032
- Table 60: Rest of South America Natural Food Colorants Market Revenue (Million) Forecast, by Application 2019 & 2032
- Table 61: Global Natural Food Colorants Market Revenue Million Forecast, by Application 2019 & 2032
- Table 62: Global Natural Food Colorants Market Revenue Million Forecast, by Country 2019 & 2032
- Table 63: Global Natural Food Colorants Market Revenue Million Forecast, by Application 2019 & 2032
- Table 64: Global Natural Food Colorants Market Revenue Million Forecast, by Country 2019 & 2032
- Table 65: Saudi Arabia Natural Food Colorants Market Revenue (Million) Forecast, by Application 2019 & 2032
- Table 66: Egypt Natural Food Colorants Market Revenue (Million) Forecast, by Application 2019 & 2032
- Table 67: South Africa Natural Food Colorants Market Revenue (Million) Forecast, by Application 2019 & 2032
- Table 68: Rest of Middle East Natural Food Colorants Market Revenue (Million) Forecast, by Application 2019 & 2032
Frequently Asked Questions
1. What is the projected Compound Annual Growth Rate (CAGR) of the Natural Food Colorants Market?
The projected CAGR is approximately 8.47%.
2. Which companies are prominent players in the Natural Food Colorants Market?
Key companies in the market include Kalsec Inc, DDW Inc, Chr Hansen Holding AS, Sensient Technologies, Givaudan SA, Koninklijke DSM NV, Synthite Industries Private Ltd, Symrise AG, Archer Daniels Midland Company*List Not Exhaustive.
3. What are the main segments of the Natural Food Colorants Market?
The market segments include Application.
4. Can you provide details about the market size?
The market size is estimated to be USD 2.07 Million as of 2022.
5. What are some drivers contributing to market growth?
Rising Health Consciousness among consumer.
6. What are the notable trends driving market growth?
Brightening Spotlight on Coloring Foodstuff.
7. Are there any restraints impacting market growth?
High Cost of natural Ingredients.
8. Can you provide examples of recent developments in the market?
In January 2021, GNT Group added a new pink shade coloring agent under its EXBERRY® brand with the name EXBERRY® Shade Pink - OD, which is developed for use in fat-based applications. It is also available in red, yellow, orange, blue, and green variants.
9. What pricing options are available for accessing the report?
Pricing options include single-user, multi-user, and enterprise licenses priced at USD 4750, USD 5250, and USD 8750 respectively.
10. Is the market size provided in terms of value or volume?
The market size is provided in terms of value, measured in Million.
11. Are there any specific market keywords associated with the report?
Yes, the market keyword associated with the report is "Natural Food Colorants Market," which aids in identifying and referencing the specific market segment covered.
12. How do I determine which pricing option suits my needs best?
The pricing options vary based on user requirements and access needs. Individual users may opt for single-user licenses, while businesses requiring broader access may choose multi-user or enterprise licenses for cost-effective access to the report.
13. Are there any additional resources or data provided in the Natural Food Colorants Market report?
While the report offers comprehensive insights, it's advisable to review the specific contents or supplementary materials provided to ascertain if additional resources or data are available.
14. How can I stay updated on further developments or reports in the Natural Food Colorants Market?
To stay informed about further developments, trends, and reports in the Natural Food Colorants Market, consider subscribing to industry newsletters, following relevant companies and organizations, or regularly checking reputable industry news sources and publications.
Methodology
Step 1 - Identification of Relevant Samples Size from Population Database


Step 2 - Approaches for Defining Global Market Size (Value, Volume* & Price*)

Note*: In applicable scenarios
Step 3 - Data Sources
Primary Research
- Web Analytics
- Survey Reports
- Research Institute
- Latest Research Reports
- Opinion Leaders
Secondary Research
- Annual Reports
- White Paper
- Latest Press Release
- Industry Association
- Paid Database
- Investor Presentations

Step 4 - Data Triangulation
Involves using different sources of information in order to increase the validity of a study
These sources are likely to be stakeholders in a program - participants, other researchers, program staff, other community members, and so on.
Then we put all data in single framework & apply various statistical tools to find out the dynamic on the market.
During the analysis stage, feedback from the stakeholder groups would be compared to determine areas of agreement as well as areas of divergence


