Military Radars Industry Navigating Dynamics Comprehensive Analysis and Forecasts 2025-2033

Military Radars Industry by Production Analysis, by Consumption Analysis, by Import Market Analysis (Value & Volume), by Export Market Analysis (Value & Volume), by Price Trend Analysis, by North America (United States, Canada, Mexico), by South America (Brazil, Argentina, Rest of South America), by Europe (United Kingdom, Germany, France, Italy, Spain, Russia, Benelux, Nordics, Rest of Europe), by Middle East & Africa (Turkey, Israel, GCC, North Africa, South Africa, Rest of Middle East & Africa), by Asia Pacific (China, India, Japan, South Korea, ASEAN, Oceania, Rest of Asia Pacific) Forecast 2025-2033

Jun 30 2025
Base Year: 2024

234 Pages
Main Logo

Military Radars Industry Navigating Dynamics Comprehensive Analysis and Forecasts 2025-2033


Home
Industries
Aerospace & Defense
sponsor image
sponsor image
sponsor image
sponsor image

Tailored for you

  • In-depth Analysis Tailored to Specified Regions or Segments
  • Company Profiles Customized to User Preferences
  • Comprehensive Insights Focused on Specific Segments or Regions
  • Customized Evaluation of Competitive Landscape to Meet Your Needs
  • Tailored Customization to Address Other Specific Requirements
Ask for customization


Key Insights

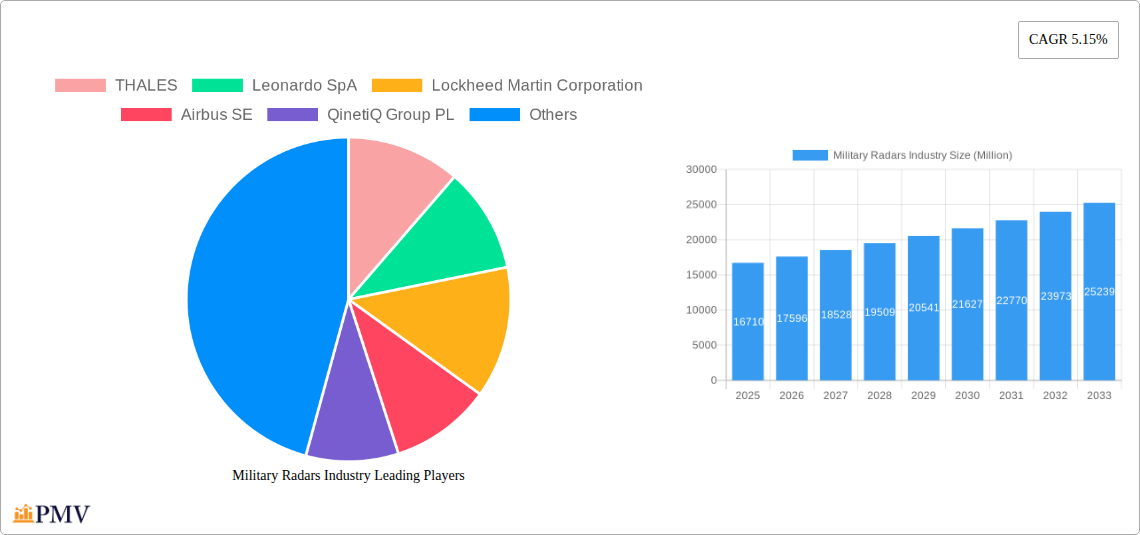
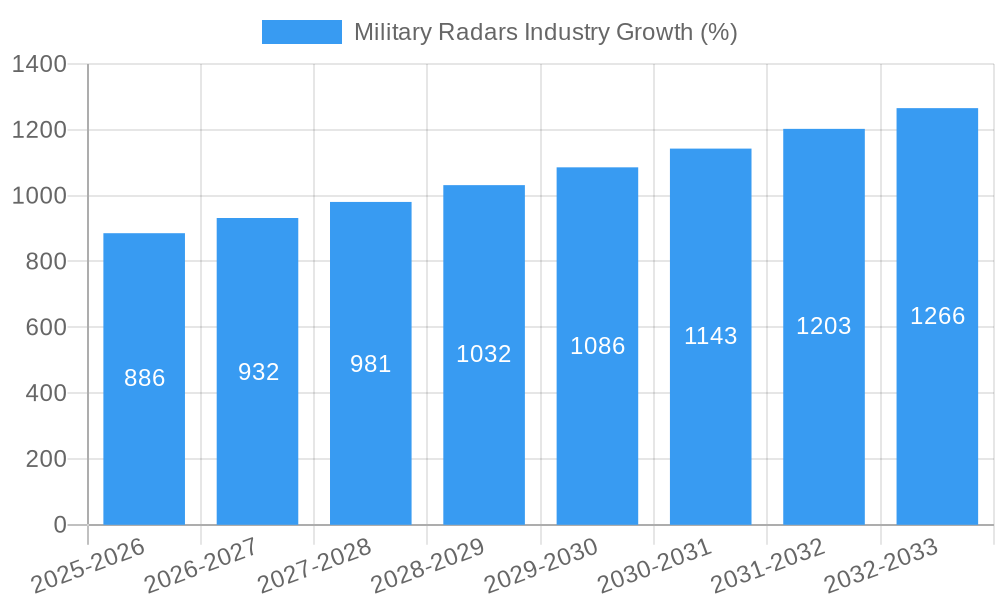
The Military Radars market, valued at $16.71 billion in 2025, is projected to experience robust growth, driven by escalating geopolitical tensions, modernization of defense forces globally, and the increasing demand for advanced surveillance and reconnaissance capabilities. The Compound Annual Growth Rate (CAGR) of 5.15% from 2025 to 2033 indicates a significant market expansion, reaching an estimated value exceeding $26 billion by 2033. Key growth drivers include the rising adoption of advanced radar technologies such as AESA (Active Electronically Scanned Array) radars offering enhanced performance and flexibility, and the increasing integration of radar systems with other defense platforms and systems for improved situational awareness. Technological advancements, such as AI-powered signal processing and improved target identification capabilities, further fuel market expansion. The market is segmented by platform (ground-based, naval, airborne, space) and application (air and missile defense, ISR, navigation and weapon guidance, space situational awareness), with air and missile defense and ISR segments holding significant market share. Competition among leading players like Thales, Leonardo SpA, and Lockheed Martin is intense, driving innovation and technological advancements.

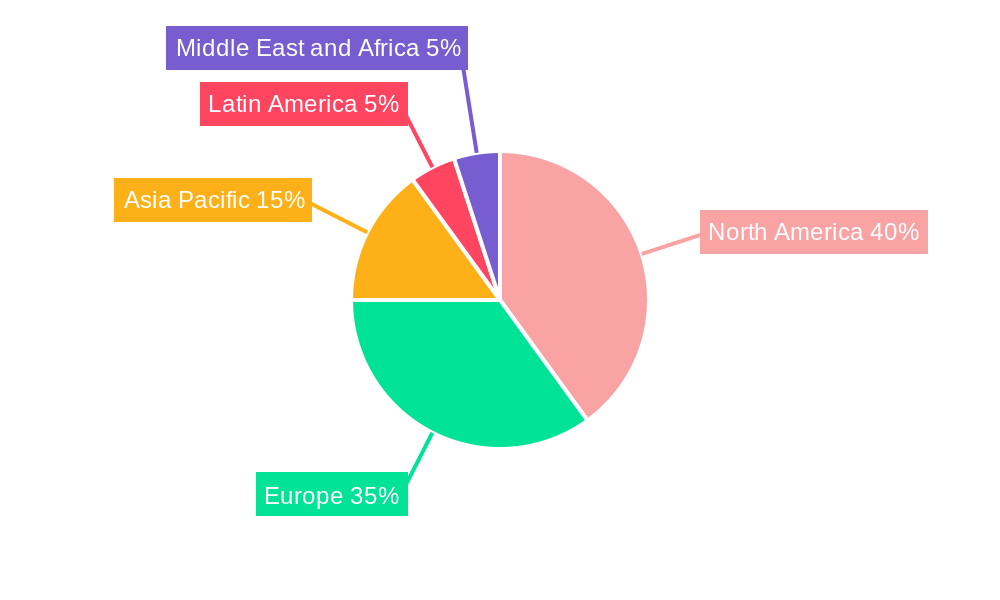
Market restraints include the high cost of research and development, along with the complex integration processes involved in deploying these sophisticated systems. However, the continuous technological advancements, coupled with rising defense budgets in several countries, are expected to offset these limitations and sustain the market's growth trajectory. Regional analysis shows North America and Europe dominating the market initially, but the Asia-Pacific region is expected to witness significant growth due to increased military spending and modernization efforts by several nations in the region. The segment of airborne and space-based military radars is predicted to experience higher growth rates compared to ground-based systems driven by increasing demand for real-time intelligence gathering and surveillance capabilities across wider geographical areas. This market presents lucrative opportunities for radar manufacturers, particularly those specializing in cutting-edge technologies and system integration capabilities.

Military Radars Industry Research Report - Market Size, Growth & Forecast

Military Radars Industry: A Comprehensive Market Analysis (2019-2033)

This in-depth report provides a comprehensive analysis of the Military Radars Industry, offering invaluable insights for stakeholders across the value chain. The study covers the period 2019-2033, with a focus on the 2025-2033 forecast period. The report leverages rigorous data analysis to project a robust market outlook, encompassing market sizing, segmentation, competitive dynamics, and future growth drivers.

Military Radars Industry Market Structure & Competitive Dynamics

The Military Radars market is characterized by a moderately concentrated structure, with a few major players holding significant market share. Key players like THALES, Leonardo SpA, Lockheed Martin Corporation, Airbus SE, and BAE Systems PLC dominate the landscape, driving innovation and shaping market trends. The industry exhibits a complex innovation ecosystem, with substantial R&D investments fueling the development of advanced radar technologies. Stringent regulatory frameworks, particularly concerning export controls and cybersecurity, influence market dynamics. The presence of product substitutes, such as alternative surveillance systems, introduces competitive pressure. End-user trends, including increasing demand for advanced capabilities in air and missile defense, ISR, and space situational awareness, are major growth drivers. M&A activities have played a crucial role in shaping the market structure. In the period 2019-2024, M&A deal values totaled approximately $xx Million, with a significant portion focused on acquiring specialized technologies and expanding market reach. The average market share of the top 5 players is estimated at 60%, indicating a moderately consolidated market.

  • Market Concentration: High, with a few major players dominating.
  • Innovation Ecosystem: Robust R&D investments driving technological advancements.
  • Regulatory Frameworks: Stringent export controls and cybersecurity regulations.
  • M&A Activity: Significant deal volume in the $xx Million range during 2019-2024, focused on technology acquisition and market expansion.

Military Radars Industry Industry Trends & Insights

The Military Radars market is experiencing robust growth, driven by escalating geopolitical tensions, the increasing need for enhanced national security, and the ongoing technological advancements in radar technology. The Compound Annual Growth Rate (CAGR) during the historical period (2019-2024) was approximately xx%, and is projected to be xx% during the forecast period (2025-2033). This growth is largely propelled by the rising adoption of advanced radar systems, including AESA (Active Electronically Scanned Array) technology and AI-powered radar systems, significantly enhancing situational awareness and targeting capabilities. Consumer preferences are shifting towards systems with higher resolution, greater range, and improved signal processing capabilities. Competitive dynamics are intensified by ongoing technological innovation and mergers and acquisitions, resulting in a continuous improvement in radar performance and features. Market penetration of AESA radars is increasing at a rapid pace, with a projected xx% penetration rate by 2033.

Military Radars Industry Growth

Dominant Markets & Segments in Military Radars Industry

The North American market currently dominates the Military Radars industry, driven by robust defense budgets and technological advancements. However, the Asia-Pacific region is projected to experience the highest growth rate during the forecast period due to increasing military modernization efforts.

  • Dominant Region: North America

  • Fastest-Growing Region: Asia-Pacific

  • Leading Segments:

    • Platform: Airborne radars hold the largest market share due to their widespread use in fighter jets, AWACS, and drones.
    • Application: Air and Missile Defense systems represent the highest demand, owing to escalating geopolitical risks and the necessity for robust defense systems.
    • Component: Antennas constitute the largest component market share due to their crucial role in radar functionality and technological advancements in AESA technology.

Key drivers for dominance include significant investments in defense modernization, technological innovation, and favorable government policies. The high demand for advanced radar systems in these segments is further fueled by the need for enhanced surveillance, target acquisition, and precision-guided munitions. Ground-based radar systems are expanding due to the growth of national air defense systems and border security initiatives.

Military Radars Industry Product Innovations

Recent advancements in Military Radar technology include the widespread adoption of AESA technology, offering improved performance, flexibility, and efficiency compared to traditional mechanically scanned arrays. The integration of AI and Machine Learning is enhancing signal processing capabilities, enabling better target identification, and reducing false alarms. Miniaturization efforts are leading to smaller, lighter, and more energy-efficient radar systems, suitable for integration into unmanned aerial vehicles (UAVs) and other platforms. These innovations significantly improve target detection accuracy, range, and overall system performance, providing a strong competitive advantage for manufacturers.

Report Segmentation & Scope

This report segments the Military Radars market based on Platform (Ground-based, Naval, Airborne, Space), Application (Air and Missile Defense, ISR, Navigation and Weapon Guidance, Space Situational Awareness, Other Applications), and Component (Antennas, Transmitters, Receivers, Power Amplifiers, Duplexers, Digital Signal Processors, Stabilization Systems, Graphical User Interfaces). Each segment's market size, growth projections, and competitive landscape are analyzed in detail. For example, the Airborne segment is expected to witness significant growth due to increased demand for advanced air defense systems and UAV deployment. The Air and Missile Defense application segment is projected to dominate due to rising geopolitical tensions and the need for enhanced security. The Antennas segment holds a large market share driven by technological developments in AESA technology and the demand for high-performance radar systems.

Key Drivers of Military Radars Industry Growth

Several factors drive the growth of the Military Radars industry. Firstly, increasing geopolitical instability and rising defense budgets globally are key drivers. Secondly, technological advancements, such as AESA and AI integration, are constantly enhancing radar capabilities and functionalities. Thirdly, the rising demand for ISR capabilities to combat terrorism and transnational crime fuels the growth. Finally, the expanding space domain and the need for space situational awareness are creating new market opportunities.

Challenges in the Military Radars Industry Sector

The Military Radars industry faces several challenges, including stringent regulatory hurdles related to export controls and technological advancements. Supply chain disruptions and the high cost of R&D and production can also negatively impact profitability and market growth. Moreover, intense competition from established players and new entrants requires continuous innovation and cost optimization. The combined impact of these factors may constrain market growth by an estimated xx% annually.

Leading Players in the Military Radars Industry Market

  • THALES
  • Leonardo SpA
  • Lockheed Martin Corporation
  • Airbus SE
  • QinetiQ Group PL
  • Teledyne Technologies Incorporated
  • BAE Systems PLC
  • RTX Corporation
  • HENSOLDT Holding Germany GmbH
  • Israel Aerospace Industries Ltd
  • Northrop Grumman Corporation
  • Saab AB

Key Developments in Military Radars Industry Sector

  • 2022-Q4: Lockheed Martin announces the successful testing of a new AESA radar system for a next-generation fighter jet.
  • 2023-Q1: Thales and Leonardo SpA jointly develop a next generation naval radar system.
  • 2023-Q2: Airbus SE unveils a new space-based radar system for enhanced space situational awareness. (Further developments to be added as they become available)

Strategic Military Radars Industry Market Outlook

The future of the Military Radars industry looks promising, with continued growth fueled by technological innovation, increased defense spending, and the expansion of new applications. The integration of AI and advanced signal processing will drive further improvements in radar performance and capabilities. Strategic opportunities exist in developing next-generation radar systems for UAVs, hypersonic missile defense, and advanced space-based surveillance. The market is poised for significant expansion, particularly in the Asia-Pacific and Middle East regions.

Military Radars Industry Segmentation

  • 1. Production Analysis
  • 2. Consumption Analysis
  • 3. Import Market Analysis (Value & Volume)
  • 4. Export Market Analysis (Value & Volume)
  • 5. Price Trend Analysis

Military Radars Industry Segmentation By Geography

  • 1. North America
    • 1.1. United States
    • 1.2. Canada
    • 1.3. Mexico
  • 2. South America
    • 2.1. Brazil
    • 2.2. Argentina
    • 2.3. Rest of South America
  • 3. Europe
    • 3.1. United Kingdom
    • 3.2. Germany
    • 3.3. France
    • 3.4. Italy
    • 3.5. Spain
    • 3.6. Russia
    • 3.7. Benelux
    • 3.8. Nordics
    • 3.9. Rest of Europe
  • 4. Middle East & Africa
    • 4.1. Turkey
    • 4.2. Israel
    • 4.3. GCC
    • 4.4. North Africa
    • 4.5. South Africa
    • 4.6. Rest of Middle East & Africa
  • 5. Asia Pacific
    • 5.1. China
    • 5.2. India
    • 5.3. Japan
    • 5.4. South Korea
    • 5.5. ASEAN
    • 5.6. Oceania
    • 5.7. Rest of Asia Pacific
Military Radars Industry Regional Share


Military Radars Industry REPORT HIGHLIGHTS

AspectsDetails
Study Period 2019-2033
Base Year 2024
Estimated Year 2025
Forecast Period2025-2033
Historical Period2019-2024
Growth RateCAGR of 5.15% from 2019-2033
Segmentation
    • By Production Analysis
    • By Consumption Analysis
    • By Import Market Analysis (Value & Volume)
    • By Export Market Analysis (Value & Volume)
    • By Price Trend Analysis
  • By Geography
    • North America
      • United States
      • Canada
      • Mexico
    • South America
      • Brazil
      • Argentina
      • Rest of South America
    • Europe
      • United Kingdom
      • Germany
      • France
      • Italy
      • Spain
      • Russia
      • Benelux
      • Nordics
      • Rest of Europe
    • Middle East & Africa
      • Turkey
      • Israel
      • GCC
      • North Africa
      • South Africa
      • Rest of Middle East & Africa
    • Asia Pacific
      • China
      • India
      • Japan
      • South Korea
      • ASEAN
      • Oceania
      • Rest of Asia Pacific


Table of Contents

  1. 1. Introduction
    • 1.1. Research Scope
    • 1.2. Market Segmentation
    • 1.3. Research Methodology
    • 1.4. Definitions and Assumptions
  2. 2. Executive Summary
    • 2.1. Introduction
  3. 3. Market Dynamics
    • 3.1. Introduction
      • 3.2. Market Drivers
        • 3.2.1. Increase in Internet of Things (IoT) and Autonomous Systems; Rise in Demand for Military and Defense Satellite Communication Solutions
      • 3.3. Market Restrains
        • 3.3.1. Cybersecurity Threats to Satellite Communication; Interference in Transmission of Data
      • 3.4. Market Trends
        • 3.4.1. Airborne Segment Expected to Register the Highest CAGR During the Forecast Period
  4. 4. Market Factor Analysis
    • 4.1. Porters Five Forces
    • 4.2. Supply/Value Chain
    • 4.3. PESTEL analysis
    • 4.4. Market Entropy
    • 4.5. Patent/Trademark Analysis
  5. 5. Global Military Radars Industry Analysis, Insights and Forecast, 2019-2031
    • 5.1. Market Analysis, Insights and Forecast - by Production Analysis
      • 5.2. Market Analysis, Insights and Forecast - by Consumption Analysis
        • 5.3. Market Analysis, Insights and Forecast - by Import Market Analysis (Value & Volume)
          • 5.4. Market Analysis, Insights and Forecast - by Export Market Analysis (Value & Volume)
            • 5.5. Market Analysis, Insights and Forecast - by Price Trend Analysis
              • 5.6. Market Analysis, Insights and Forecast - by Region
                • 5.6.1. North America
                • 5.6.2. South America
                • 5.6.3. Europe
                • 5.6.4. Middle East & Africa
                • 5.6.5. Asia Pacific
            • 6. North America Military Radars Industry Analysis, Insights and Forecast, 2019-2031
              • 6.1. Market Analysis, Insights and Forecast - by Production Analysis
                • 6.2. Market Analysis, Insights and Forecast - by Consumption Analysis
                  • 6.3. Market Analysis, Insights and Forecast - by Import Market Analysis (Value & Volume)
                    • 6.4. Market Analysis, Insights and Forecast - by Export Market Analysis (Value & Volume)
                      • 6.5. Market Analysis, Insights and Forecast - by Price Trend Analysis
                      • 7. South America Military Radars Industry Analysis, Insights and Forecast, 2019-2031
                        • 7.1. Market Analysis, Insights and Forecast - by Production Analysis
                          • 7.2. Market Analysis, Insights and Forecast - by Consumption Analysis
                            • 7.3. Market Analysis, Insights and Forecast - by Import Market Analysis (Value & Volume)
                              • 7.4. Market Analysis, Insights and Forecast - by Export Market Analysis (Value & Volume)
                                • 7.5. Market Analysis, Insights and Forecast - by Price Trend Analysis
                                • 8. Europe Military Radars Industry Analysis, Insights and Forecast, 2019-2031
                                  • 8.1. Market Analysis, Insights and Forecast - by Production Analysis
                                    • 8.2. Market Analysis, Insights and Forecast - by Consumption Analysis
                                      • 8.3. Market Analysis, Insights and Forecast - by Import Market Analysis (Value & Volume)
                                        • 8.4. Market Analysis, Insights and Forecast - by Export Market Analysis (Value & Volume)
                                          • 8.5. Market Analysis, Insights and Forecast - by Price Trend Analysis
                                          • 9. Middle East & Africa Military Radars Industry Analysis, Insights and Forecast, 2019-2031
                                            • 9.1. Market Analysis, Insights and Forecast - by Production Analysis
                                              • 9.2. Market Analysis, Insights and Forecast - by Consumption Analysis
                                                • 9.3. Market Analysis, Insights and Forecast - by Import Market Analysis (Value & Volume)
                                                  • 9.4. Market Analysis, Insights and Forecast - by Export Market Analysis (Value & Volume)
                                                    • 9.5. Market Analysis, Insights and Forecast - by Price Trend Analysis
                                                    • 10. Asia Pacific Military Radars Industry Analysis, Insights and Forecast, 2019-2031
                                                      • 10.1. Market Analysis, Insights and Forecast - by Production Analysis
                                                        • 10.2. Market Analysis, Insights and Forecast - by Consumption Analysis
                                                          • 10.3. Market Analysis, Insights and Forecast - by Import Market Analysis (Value & Volume)
                                                            • 10.4. Market Analysis, Insights and Forecast - by Export Market Analysis (Value & Volume)
                                                              • 10.5. Market Analysis, Insights and Forecast - by Price Trend Analysis
                                                              • 11. North America Military Radars Industry Analysis, Insights and Forecast, 2019-2031
                                                                  • 11.1. Market Analysis, Insights and Forecast - By Country/Sub-region
                                                                    • 11.1.1 United States
                                                                    • 11.1.2 Canada
                                                              • 12. Europe Military Radars Industry Analysis, Insights and Forecast, 2019-2031
                                                                  • 12.1. Market Analysis, Insights and Forecast - By Country/Sub-region
                                                                    • 12.1.1 United Kingdom
                                                                    • 12.1.2 Germany
                                                                    • 12.1.3 France
                                                                    • 12.1.4 Russia
                                                                    • 12.1.5 Rest of Europe
                                                              • 13. Asia Pacific Military Radars Industry Analysis, Insights and Forecast, 2019-2031
                                                                  • 13.1. Market Analysis, Insights and Forecast - By Country/Sub-region
                                                                    • 13.1.1 China
                                                                    • 13.1.2 India
                                                                    • 13.1.3 Japan
                                                                    • 13.1.4 South Korea
                                                                    • 13.1.5 Rest of Asia Pacific
                                                              • 14. Latin America Military Radars Industry Analysis, Insights and Forecast, 2019-2031
                                                                  • 14.1. Market Analysis, Insights and Forecast - By Country/Sub-region
                                                                    • 14.1.1 Brazil
                                                                    • 14.1.2 Rest of Latin America
                                                              • 15. Middle East and Africa Military Radars Industry Analysis, Insights and Forecast, 2019-2031
                                                                  • 15.1. Market Analysis, Insights and Forecast - By Country/Sub-region
                                                                    • 15.1.1 United Arab Emirates
                                                                    • 15.1.2 Saudi Arabia
                                                                    • 15.1.3 Egypt
                                                                    • 15.1.4 Rest of Middle East and Africa
                                                              • 16. Competitive Analysis
                                                                • 16.1. Global Market Share Analysis 2024
                                                                  • 16.2. Company Profiles
                                                                    • 16.2.1 THALES
                                                                      • 16.2.1.1. Overview
                                                                      • 16.2.1.2. Products
                                                                      • 16.2.1.3. SWOT Analysis
                                                                      • 16.2.1.4. Recent Developments
                                                                      • 16.2.1.5. Financials (Based on Availability)
                                                                    • 16.2.2 Leonardo SpA
                                                                      • 16.2.2.1. Overview
                                                                      • 16.2.2.2. Products
                                                                      • 16.2.2.3. SWOT Analysis
                                                                      • 16.2.2.4. Recent Developments
                                                                      • 16.2.2.5. Financials (Based on Availability)
                                                                    • 16.2.3 Lockheed Martin Corporation
                                                                      • 16.2.3.1. Overview
                                                                      • 16.2.3.2. Products
                                                                      • 16.2.3.3. SWOT Analysis
                                                                      • 16.2.3.4. Recent Developments
                                                                      • 16.2.3.5. Financials (Based on Availability)
                                                                    • 16.2.4 Airbus SE
                                                                      • 16.2.4.1. Overview
                                                                      • 16.2.4.2. Products
                                                                      • 16.2.4.3. SWOT Analysis
                                                                      • 16.2.4.4. Recent Developments
                                                                      • 16.2.4.5. Financials (Based on Availability)
                                                                    • 16.2.5 QinetiQ Group PL
                                                                      • 16.2.5.1. Overview
                                                                      • 16.2.5.2. Products
                                                                      • 16.2.5.3. SWOT Analysis
                                                                      • 16.2.5.4. Recent Developments
                                                                      • 16.2.5.5. Financials (Based on Availability)
                                                                    • 16.2.6 Teledyne Technologies Incorporated
                                                                      • 16.2.6.1. Overview
                                                                      • 16.2.6.2. Products
                                                                      • 16.2.6.3. SWOT Analysis
                                                                      • 16.2.6.4. Recent Developments
                                                                      • 16.2.6.5. Financials (Based on Availability)
                                                                    • 16.2.7 BAE Systems PLC
                                                                      • 16.2.7.1. Overview
                                                                      • 16.2.7.2. Products
                                                                      • 16.2.7.3. SWOT Analysis
                                                                      • 16.2.7.4. Recent Developments
                                                                      • 16.2.7.5. Financials (Based on Availability)
                                                                    • 16.2.8 RTX Corporation
                                                                      • 16.2.8.1. Overview
                                                                      • 16.2.8.2. Products
                                                                      • 16.2.8.3. SWOT Analysis
                                                                      • 16.2.8.4. Recent Developments
                                                                      • 16.2.8.5. Financials (Based on Availability)
                                                                    • 16.2.9 HENSOLDT Holding Germany GmbH
                                                                      • 16.2.9.1. Overview
                                                                      • 16.2.9.2. Products
                                                                      • 16.2.9.3. SWOT Analysis
                                                                      • 16.2.9.4. Recent Developments
                                                                      • 16.2.9.5. Financials (Based on Availability)
                                                                    • 16.2.10 Israel Aerospace Industries Ltd
                                                                      • 16.2.10.1. Overview
                                                                      • 16.2.10.2. Products
                                                                      • 16.2.10.3. SWOT Analysis
                                                                      • 16.2.10.4. Recent Developments
                                                                      • 16.2.10.5. Financials (Based on Availability)
                                                                    • 16.2.11 Northrop Grumman Corporation
                                                                      • 16.2.11.1. Overview
                                                                      • 16.2.11.2. Products
                                                                      • 16.2.11.3. SWOT Analysis
                                                                      • 16.2.11.4. Recent Developments
                                                                      • 16.2.11.5. Financials (Based on Availability)
                                                                    • 16.2.12 Saab AB
                                                                      • 16.2.12.1. Overview
                                                                      • 16.2.12.2. Products
                                                                      • 16.2.12.3. SWOT Analysis
                                                                      • 16.2.12.4. Recent Developments
                                                                      • 16.2.12.5. Financials (Based on Availability)

                                                              List of Figures

                                                              1. Figure 1: Global Military Radars Industry Revenue Breakdown (Million, %) by Region 2024 & 2032
                                                              2. Figure 2: North America Military Radars Industry Revenue (Million), by Country 2024 & 2032
                                                              3. Figure 3: North America Military Radars Industry Revenue Share (%), by Country 2024 & 2032
                                                              4. Figure 4: Europe Military Radars Industry Revenue (Million), by Country 2024 & 2032
                                                              5. Figure 5: Europe Military Radars Industry Revenue Share (%), by Country 2024 & 2032
                                                              6. Figure 6: Asia Pacific Military Radars Industry Revenue (Million), by Country 2024 & 2032
                                                              7. Figure 7: Asia Pacific Military Radars Industry Revenue Share (%), by Country 2024 & 2032
                                                              8. Figure 8: Latin America Military Radars Industry Revenue (Million), by Country 2024 & 2032
                                                              9. Figure 9: Latin America Military Radars Industry Revenue Share (%), by Country 2024 & 2032
                                                              10. Figure 10: Middle East and Africa Military Radars Industry Revenue (Million), by Country 2024 & 2032
                                                              11. Figure 11: Middle East and Africa Military Radars Industry Revenue Share (%), by Country 2024 & 2032
                                                              12. Figure 12: North America Military Radars Industry Revenue (Million), by Production Analysis 2024 & 2032
                                                              13. Figure 13: North America Military Radars Industry Revenue Share (%), by Production Analysis 2024 & 2032
                                                              14. Figure 14: North America Military Radars Industry Revenue (Million), by Consumption Analysis 2024 & 2032
                                                              15. Figure 15: North America Military Radars Industry Revenue Share (%), by Consumption Analysis 2024 & 2032
                                                              16. Figure 16: North America Military Radars Industry Revenue (Million), by Import Market Analysis (Value & Volume) 2024 & 2032
                                                              17. Figure 17: North America Military Radars Industry Revenue Share (%), by Import Market Analysis (Value & Volume) 2024 & 2032
                                                              18. Figure 18: North America Military Radars Industry Revenue (Million), by Export Market Analysis (Value & Volume) 2024 & 2032
                                                              19. Figure 19: North America Military Radars Industry Revenue Share (%), by Export Market Analysis (Value & Volume) 2024 & 2032
                                                              20. Figure 20: North America Military Radars Industry Revenue (Million), by Price Trend Analysis 2024 & 2032
                                                              21. Figure 21: North America Military Radars Industry Revenue Share (%), by Price Trend Analysis 2024 & 2032
                                                              22. Figure 22: North America Military Radars Industry Revenue (Million), by Country 2024 & 2032
                                                              23. Figure 23: North America Military Radars Industry Revenue Share (%), by Country 2024 & 2032
                                                              24. Figure 24: South America Military Radars Industry Revenue (Million), by Production Analysis 2024 & 2032
                                                              25. Figure 25: South America Military Radars Industry Revenue Share (%), by Production Analysis 2024 & 2032
                                                              26. Figure 26: South America Military Radars Industry Revenue (Million), by Consumption Analysis 2024 & 2032
                                                              27. Figure 27: South America Military Radars Industry Revenue Share (%), by Consumption Analysis 2024 & 2032
                                                              28. Figure 28: South America Military Radars Industry Revenue (Million), by Import Market Analysis (Value & Volume) 2024 & 2032
                                                              29. Figure 29: South America Military Radars Industry Revenue Share (%), by Import Market Analysis (Value & Volume) 2024 & 2032
                                                              30. Figure 30: South America Military Radars Industry Revenue (Million), by Export Market Analysis (Value & Volume) 2024 & 2032
                                                              31. Figure 31: South America Military Radars Industry Revenue Share (%), by Export Market Analysis (Value & Volume) 2024 & 2032
                                                              32. Figure 32: South America Military Radars Industry Revenue (Million), by Price Trend Analysis 2024 & 2032
                                                              33. Figure 33: South America Military Radars Industry Revenue Share (%), by Price Trend Analysis 2024 & 2032
                                                              34. Figure 34: South America Military Radars Industry Revenue (Million), by Country 2024 & 2032
                                                              35. Figure 35: South America Military Radars Industry Revenue Share (%), by Country 2024 & 2032
                                                              36. Figure 36: Europe Military Radars Industry Revenue (Million), by Production Analysis 2024 & 2032
                                                              37. Figure 37: Europe Military Radars Industry Revenue Share (%), by Production Analysis 2024 & 2032
                                                              38. Figure 38: Europe Military Radars Industry Revenue (Million), by Consumption Analysis 2024 & 2032
                                                              39. Figure 39: Europe Military Radars Industry Revenue Share (%), by Consumption Analysis 2024 & 2032
                                                              40. Figure 40: Europe Military Radars Industry Revenue (Million), by Import Market Analysis (Value & Volume) 2024 & 2032
                                                              41. Figure 41: Europe Military Radars Industry Revenue Share (%), by Import Market Analysis (Value & Volume) 2024 & 2032
                                                              42. Figure 42: Europe Military Radars Industry Revenue (Million), by Export Market Analysis (Value & Volume) 2024 & 2032
                                                              43. Figure 43: Europe Military Radars Industry Revenue Share (%), by Export Market Analysis (Value & Volume) 2024 & 2032
                                                              44. Figure 44: Europe Military Radars Industry Revenue (Million), by Price Trend Analysis 2024 & 2032
                                                              45. Figure 45: Europe Military Radars Industry Revenue Share (%), by Price Trend Analysis 2024 & 2032
                                                              46. Figure 46: Europe Military Radars Industry Revenue (Million), by Country 2024 & 2032
                                                              47. Figure 47: Europe Military Radars Industry Revenue Share (%), by Country 2024 & 2032
                                                              48. Figure 48: Middle East & Africa Military Radars Industry Revenue (Million), by Production Analysis 2024 & 2032
                                                              49. Figure 49: Middle East & Africa Military Radars Industry Revenue Share (%), by Production Analysis 2024 & 2032
                                                              50. Figure 50: Middle East & Africa Military Radars Industry Revenue (Million), by Consumption Analysis 2024 & 2032
                                                              51. Figure 51: Middle East & Africa Military Radars Industry Revenue Share (%), by Consumption Analysis 2024 & 2032
                                                              52. Figure 52: Middle East & Africa Military Radars Industry Revenue (Million), by Import Market Analysis (Value & Volume) 2024 & 2032
                                                              53. Figure 53: Middle East & Africa Military Radars Industry Revenue Share (%), by Import Market Analysis (Value & Volume) 2024 & 2032
                                                              54. Figure 54: Middle East & Africa Military Radars Industry Revenue (Million), by Export Market Analysis (Value & Volume) 2024 & 2032
                                                              55. Figure 55: Middle East & Africa Military Radars Industry Revenue Share (%), by Export Market Analysis (Value & Volume) 2024 & 2032
                                                              56. Figure 56: Middle East & Africa Military Radars Industry Revenue (Million), by Price Trend Analysis 2024 & 2032
                                                              57. Figure 57: Middle East & Africa Military Radars Industry Revenue Share (%), by Price Trend Analysis 2024 & 2032
                                                              58. Figure 58: Middle East & Africa Military Radars Industry Revenue (Million), by Country 2024 & 2032
                                                              59. Figure 59: Middle East & Africa Military Radars Industry Revenue Share (%), by Country 2024 & 2032
                                                              60. Figure 60: Asia Pacific Military Radars Industry Revenue (Million), by Production Analysis 2024 & 2032
                                                              61. Figure 61: Asia Pacific Military Radars Industry Revenue Share (%), by Production Analysis 2024 & 2032
                                                              62. Figure 62: Asia Pacific Military Radars Industry Revenue (Million), by Consumption Analysis 2024 & 2032
                                                              63. Figure 63: Asia Pacific Military Radars Industry Revenue Share (%), by Consumption Analysis 2024 & 2032
                                                              64. Figure 64: Asia Pacific Military Radars Industry Revenue (Million), by Import Market Analysis (Value & Volume) 2024 & 2032
                                                              65. Figure 65: Asia Pacific Military Radars Industry Revenue Share (%), by Import Market Analysis (Value & Volume) 2024 & 2032
                                                              66. Figure 66: Asia Pacific Military Radars Industry Revenue (Million), by Export Market Analysis (Value & Volume) 2024 & 2032
                                                              67. Figure 67: Asia Pacific Military Radars Industry Revenue Share (%), by Export Market Analysis (Value & Volume) 2024 & 2032
                                                              68. Figure 68: Asia Pacific Military Radars Industry Revenue (Million), by Price Trend Analysis 2024 & 2032
                                                              69. Figure 69: Asia Pacific Military Radars Industry Revenue Share (%), by Price Trend Analysis 2024 & 2032
                                                              70. Figure 70: Asia Pacific Military Radars Industry Revenue (Million), by Country 2024 & 2032
                                                              71. Figure 71: Asia Pacific Military Radars Industry Revenue Share (%), by Country 2024 & 2032

                                                              List of Tables

                                                              1. Table 1: Global Military Radars Industry Revenue Million Forecast, by Region 2019 & 2032
                                                              2. Table 2: Global Military Radars Industry Revenue Million Forecast, by Production Analysis 2019 & 2032
                                                              3. Table 3: Global Military Radars Industry Revenue Million Forecast, by Consumption Analysis 2019 & 2032
                                                              4. Table 4: Global Military Radars Industry Revenue Million Forecast, by Import Market Analysis (Value & Volume) 2019 & 2032
                                                              5. Table 5: Global Military Radars Industry Revenue Million Forecast, by Export Market Analysis (Value & Volume) 2019 & 2032
                                                              6. Table 6: Global Military Radars Industry Revenue Million Forecast, by Price Trend Analysis 2019 & 2032
                                                              7. Table 7: Global Military Radars Industry Revenue Million Forecast, by Region 2019 & 2032
                                                              8. Table 8: Global Military Radars Industry Revenue Million Forecast, by Country 2019 & 2032
                                                              9. Table 9: United States Military Radars Industry Revenue (Million) Forecast, by Application 2019 & 2032
                                                              10. Table 10: Canada Military Radars Industry Revenue (Million) Forecast, by Application 2019 & 2032
                                                              11. Table 11: Global Military Radars Industry Revenue Million Forecast, by Country 2019 & 2032
                                                              12. Table 12: United Kingdom Military Radars Industry Revenue (Million) Forecast, by Application 2019 & 2032
                                                              13. Table 13: Germany Military Radars Industry Revenue (Million) Forecast, by Application 2019 & 2032
                                                              14. Table 14: France Military Radars Industry Revenue (Million) Forecast, by Application 2019 & 2032
                                                              15. Table 15: Russia Military Radars Industry Revenue (Million) Forecast, by Application 2019 & 2032
                                                              16. Table 16: Rest of Europe Military Radars Industry Revenue (Million) Forecast, by Application 2019 & 2032
                                                              17. Table 17: Global Military Radars Industry Revenue Million Forecast, by Country 2019 & 2032
                                                              18. Table 18: China Military Radars Industry Revenue (Million) Forecast, by Application 2019 & 2032
                                                              19. Table 19: India Military Radars Industry Revenue (Million) Forecast, by Application 2019 & 2032
                                                              20. Table 20: Japan Military Radars Industry Revenue (Million) Forecast, by Application 2019 & 2032
                                                              21. Table 21: South Korea Military Radars Industry Revenue (Million) Forecast, by Application 2019 & 2032
                                                              22. Table 22: Rest of Asia Pacific Military Radars Industry Revenue (Million) Forecast, by Application 2019 & 2032
                                                              23. Table 23: Global Military Radars Industry Revenue Million Forecast, by Country 2019 & 2032
                                                              24. Table 24: Brazil Military Radars Industry Revenue (Million) Forecast, by Application 2019 & 2032
                                                              25. Table 25: Rest of Latin America Military Radars Industry Revenue (Million) Forecast, by Application 2019 & 2032
                                                              26. Table 26: Global Military Radars Industry Revenue Million Forecast, by Country 2019 & 2032
                                                              27. Table 27: United Arab Emirates Military Radars Industry Revenue (Million) Forecast, by Application 2019 & 2032
                                                              28. Table 28: Saudi Arabia Military Radars Industry Revenue (Million) Forecast, by Application 2019 & 2032
                                                              29. Table 29: Egypt Military Radars Industry Revenue (Million) Forecast, by Application 2019 & 2032
                                                              30. Table 30: Rest of Middle East and Africa Military Radars Industry Revenue (Million) Forecast, by Application 2019 & 2032
                                                              31. Table 31: Global Military Radars Industry Revenue Million Forecast, by Production Analysis 2019 & 2032
                                                              32. Table 32: Global Military Radars Industry Revenue Million Forecast, by Consumption Analysis 2019 & 2032
                                                              33. Table 33: Global Military Radars Industry Revenue Million Forecast, by Import Market Analysis (Value & Volume) 2019 & 2032
                                                              34. Table 34: Global Military Radars Industry Revenue Million Forecast, by Export Market Analysis (Value & Volume) 2019 & 2032
                                                              35. Table 35: Global Military Radars Industry Revenue Million Forecast, by Price Trend Analysis 2019 & 2032
                                                              36. Table 36: Global Military Radars Industry Revenue Million Forecast, by Country 2019 & 2032
                                                              37. Table 37: United States Military Radars Industry Revenue (Million) Forecast, by Application 2019 & 2032
                                                              38. Table 38: Canada Military Radars Industry Revenue (Million) Forecast, by Application 2019 & 2032
                                                              39. Table 39: Mexico Military Radars Industry Revenue (Million) Forecast, by Application 2019 & 2032
                                                              40. Table 40: Global Military Radars Industry Revenue Million Forecast, by Production Analysis 2019 & 2032
                                                              41. Table 41: Global Military Radars Industry Revenue Million Forecast, by Consumption Analysis 2019 & 2032
                                                              42. Table 42: Global Military Radars Industry Revenue Million Forecast, by Import Market Analysis (Value & Volume) 2019 & 2032
                                                              43. Table 43: Global Military Radars Industry Revenue Million Forecast, by Export Market Analysis (Value & Volume) 2019 & 2032
                                                              44. Table 44: Global Military Radars Industry Revenue Million Forecast, by Price Trend Analysis 2019 & 2032
                                                              45. Table 45: Global Military Radars Industry Revenue Million Forecast, by Country 2019 & 2032
                                                              46. Table 46: Brazil Military Radars Industry Revenue (Million) Forecast, by Application 2019 & 2032
                                                              47. Table 47: Argentina Military Radars Industry Revenue (Million) Forecast, by Application 2019 & 2032
                                                              48. Table 48: Rest of South America Military Radars Industry Revenue (Million) Forecast, by Application 2019 & 2032
                                                              49. Table 49: Global Military Radars Industry Revenue Million Forecast, by Production Analysis 2019 & 2032
                                                              50. Table 50: Global Military Radars Industry Revenue Million Forecast, by Consumption Analysis 2019 & 2032
                                                              51. Table 51: Global Military Radars Industry Revenue Million Forecast, by Import Market Analysis (Value & Volume) 2019 & 2032
                                                              52. Table 52: Global Military Radars Industry Revenue Million Forecast, by Export Market Analysis (Value & Volume) 2019 & 2032
                                                              53. Table 53: Global Military Radars Industry Revenue Million Forecast, by Price Trend Analysis 2019 & 2032
                                                              54. Table 54: Global Military Radars Industry Revenue Million Forecast, by Country 2019 & 2032
                                                              55. Table 55: United Kingdom Military Radars Industry Revenue (Million) Forecast, by Application 2019 & 2032
                                                              56. Table 56: Germany Military Radars Industry Revenue (Million) Forecast, by Application 2019 & 2032
                                                              57. Table 57: France Military Radars Industry Revenue (Million) Forecast, by Application 2019 & 2032
                                                              58. Table 58: Italy Military Radars Industry Revenue (Million) Forecast, by Application 2019 & 2032
                                                              59. Table 59: Spain Military Radars Industry Revenue (Million) Forecast, by Application 2019 & 2032
                                                              60. Table 60: Russia Military Radars Industry Revenue (Million) Forecast, by Application 2019 & 2032
                                                              61. Table 61: Benelux Military Radars Industry Revenue (Million) Forecast, by Application 2019 & 2032
                                                              62. Table 62: Nordics Military Radars Industry Revenue (Million) Forecast, by Application 2019 & 2032
                                                              63. Table 63: Rest of Europe Military Radars Industry Revenue (Million) Forecast, by Application 2019 & 2032
                                                              64. Table 64: Global Military Radars Industry Revenue Million Forecast, by Production Analysis 2019 & 2032
                                                              65. Table 65: Global Military Radars Industry Revenue Million Forecast, by Consumption Analysis 2019 & 2032
                                                              66. Table 66: Global Military Radars Industry Revenue Million Forecast, by Import Market Analysis (Value & Volume) 2019 & 2032
                                                              67. Table 67: Global Military Radars Industry Revenue Million Forecast, by Export Market Analysis (Value & Volume) 2019 & 2032
                                                              68. Table 68: Global Military Radars Industry Revenue Million Forecast, by Price Trend Analysis 2019 & 2032
                                                              69. Table 69: Global Military Radars Industry Revenue Million Forecast, by Country 2019 & 2032
                                                              70. Table 70: Turkey Military Radars Industry Revenue (Million) Forecast, by Application 2019 & 2032
                                                              71. Table 71: Israel Military Radars Industry Revenue (Million) Forecast, by Application 2019 & 2032
                                                              72. Table 72: GCC Military Radars Industry Revenue (Million) Forecast, by Application 2019 & 2032
                                                              73. Table 73: North Africa Military Radars Industry Revenue (Million) Forecast, by Application 2019 & 2032
                                                              74. Table 74: South Africa Military Radars Industry Revenue (Million) Forecast, by Application 2019 & 2032
                                                              75. Table 75: Rest of Middle East & Africa Military Radars Industry Revenue (Million) Forecast, by Application 2019 & 2032
                                                              76. Table 76: Global Military Radars Industry Revenue Million Forecast, by Production Analysis 2019 & 2032
                                                              77. Table 77: Global Military Radars Industry Revenue Million Forecast, by Consumption Analysis 2019 & 2032
                                                              78. Table 78: Global Military Radars Industry Revenue Million Forecast, by Import Market Analysis (Value & Volume) 2019 & 2032
                                                              79. Table 79: Global Military Radars Industry Revenue Million Forecast, by Export Market Analysis (Value & Volume) 2019 & 2032
                                                              80. Table 80: Global Military Radars Industry Revenue Million Forecast, by Price Trend Analysis 2019 & 2032
                                                              81. Table 81: Global Military Radars Industry Revenue Million Forecast, by Country 2019 & 2032
                                                              82. Table 82: China Military Radars Industry Revenue (Million) Forecast, by Application 2019 & 2032
                                                              83. Table 83: India Military Radars Industry Revenue (Million) Forecast, by Application 2019 & 2032
                                                              84. Table 84: Japan Military Radars Industry Revenue (Million) Forecast, by Application 2019 & 2032
                                                              85. Table 85: South Korea Military Radars Industry Revenue (Million) Forecast, by Application 2019 & 2032
                                                              86. Table 86: ASEAN Military Radars Industry Revenue (Million) Forecast, by Application 2019 & 2032
                                                              87. Table 87: Oceania Military Radars Industry Revenue (Million) Forecast, by Application 2019 & 2032
                                                              88. Table 88: Rest of Asia Pacific Military Radars Industry Revenue (Million) Forecast, by Application 2019 & 2032


                                                              Frequently Asked Questions

                                                              1. What is the projected Compound Annual Growth Rate (CAGR) of the Military Radars Industry?

                                                              The projected CAGR is approximately 5.15%.

                                                              2. Which companies are prominent players in the Military Radars Industry?

                                                              Key companies in the market include THALES, Leonardo SpA, Lockheed Martin Corporation, Airbus SE, QinetiQ Group PL, Teledyne Technologies Incorporated, BAE Systems PLC, RTX Corporation, HENSOLDT Holding Germany GmbH, Israel Aerospace Industries Ltd, Northrop Grumman Corporation, Saab AB.

                                                              3. What are the main segments of the Military Radars Industry?

                                                              The market segments include Production Analysis, Consumption Analysis, Import Market Analysis (Value & Volume), Export Market Analysis (Value & Volume), Price Trend Analysis.

                                                              4. Can you provide details about the market size?

                                                              The market size is estimated to be USD 16.71 Million as of 2022.

                                                              5. What are some drivers contributing to market growth?

                                                              Increase in Internet of Things (IoT) and Autonomous Systems; Rise in Demand for Military and Defense Satellite Communication Solutions.

                                                              6. What are the notable trends driving market growth?

                                                              Airborne Segment Expected to Register the Highest CAGR During the Forecast Period.

                                                              7. Are there any restraints impacting market growth?

                                                              Cybersecurity Threats to Satellite Communication; Interference in Transmission of Data.

                                                              8. Can you provide examples of recent developments in the market?

                                                              N/A

                                                              9. What pricing options are available for accessing the report?

                                                              Pricing options include single-user, multi-user, and enterprise licenses priced at USD 4750, USD 5250, and USD 8750 respectively.

                                                              10. Is the market size provided in terms of value or volume?

                                                              The market size is provided in terms of value, measured in Million.

                                                              11. Are there any specific market keywords associated with the report?

                                                              Yes, the market keyword associated with the report is "Military Radars Industry," which aids in identifying and referencing the specific market segment covered.

                                                              12. How do I determine which pricing option suits my needs best?

                                                              The pricing options vary based on user requirements and access needs. Individual users may opt for single-user licenses, while businesses requiring broader access may choose multi-user or enterprise licenses for cost-effective access to the report.

                                                              13. Are there any additional resources or data provided in the Military Radars Industry report?

                                                              While the report offers comprehensive insights, it's advisable to review the specific contents or supplementary materials provided to ascertain if additional resources or data are available.

                                                              14. How can I stay updated on further developments or reports in the Military Radars Industry?

                                                              To stay informed about further developments, trends, and reports in the Military Radars Industry, consider subscribing to industry newsletters, following relevant companies and organizations, or regularly checking reputable industry news sources and publications.


                                                              Methodology

                                                              Step 1 - Identification of Relevant Samples Size from Population Database

                                                              Step Chart
                                                              Bar Chart
                                                              Method Chart

                                                              Step 2 - Approaches for Defining Global Market Size (Value, Volume* & Price*)

                                                              Approach Chart
                                                              Top-down and bottom-up approaches are used to validate the global market size and estimate the market size for manufactures, regional segments, product, and application.

                                                              Note*: In applicable scenarios

                                                              Step 3 - Data Sources

                                                              Primary Research

                                                              • Web Analytics
                                                              • Survey Reports
                                                              • Research Institute
                                                              • Latest Research Reports
                                                              • Opinion Leaders

                                                              Secondary Research

                                                              • Annual Reports
                                                              • White Paper
                                                              • Latest Press Release
                                                              • Industry Association
                                                              • Paid Database
                                                              • Investor Presentations
                                                              Analyst Chart

                                                              Step 4 - Data Triangulation

                                                              Involves using different sources of information in order to increase the validity of a study

                                                              These sources are likely to be stakeholders in a program - participants, other researchers, program staff, other community members, and so on.

                                                              Then we put all data in single framework & apply various statistical tools to find out the dynamic on the market.

                                                              During the analysis stage, feedback from the stakeholder groups would be compared to determine areas of agreement as well as areas of divergence

                                                              Additionally, after gathering mixed and scattered data from a wide range of sources, data is triangulated and correlated to come up with estimated figures which are further validated through primary mediums or industry experts, opinion leaders.

                                                              About Precision Market View

                                                              Precision Market View offers precise market research, industry intelligence, and data analysis for healthcare, manufacturing, technology, and energy. Our reports provide the clarity you need to make informed decisions and drive growth.

                                                              Our team combines primary research, advanced analytics, and industry expertise to deliver actionable intelligence. We offer syndicated reports, custom research, and consulting services tailored to your business needs.

                                                              At Precision Market View, we are committed to quality, transparency, and client satisfaction. Every report is rigorously validated to ensure accuracy and relevance. Our global perspective and local expertise help you understand both the big picture and the finer details of your market.

                                                              Stay informed with Precision Market View. Subscribe to our newsletter for the latest updates and research highlights, and follow us on social media for real-time insights.

                                                              Precision Market View – Clarity for Your Strategic Decisions.

                                                              artwork spiralartwork spiralRelated Reports
                                                              artwork underline

                                                              Opportunities in Europe Military Satellite Market Market 2025-2033

                                                              Discover the booming European military satellite market! Our analysis reveals a €1.5 billion market in 2025 projected to reach €4 billion by 2033, driven by geopolitical tensions and technological advancements. Explore key trends, segments (LEO, GEO, satellite subsystems), and major players shaping this dynamic sector.

                                                              July 2025
                                                              Base Year: 2024
                                                              No Of Pages: 197
                                                              Price: $3800

                                                              Global Southeast Asia Defense Market Trends: Region-Specific Insights 2025-2033

                                                              The Southeast Asia defense market is booming, projected to reach over $25 billion by 2033, driven by modernization efforts and geopolitical tensions. This comprehensive analysis reveals key market trends, drivers, restraints, and leading companies in this rapidly expanding sector. Explore the opportunities and challenges in the Singapore, Indonesia, Thailand, and Malaysia defense markets.

                                                              July 2025
                                                              Base Year: 2024
                                                              No Of Pages: 197
                                                              Price: $3800

                                                              Comprehensive Overview of Cabin Interior Composites Industry Trends: 2025-2033

                                                              The Cabin Interior Composites market is booming, projected to exceed $XX million by 2033 with a CAGR above 6%. Learn about key drivers, market trends, leading companies (Triumph Group, Safran, etc.), and regional growth forecasts in this comprehensive market analysis. Discover opportunities in lightweight aircraft design and sustainable materials.

                                                              July 2025
                                                              Base Year: 2024
                                                              No Of Pages: 234
                                                              Price: $4750

                                                              Micro Turbine Generator System Market Market Drivers and Challenges: Trends 2025-2033

                                                              The Micro Turbine Generator System (MTGS) market is booming, projected to exceed a CAGR of 18% through 2033. Driven by demand for reliable power in remote areas and advancements in technology, this market presents lucrative opportunities across commercial, military, and industrial sectors. Explore market trends, key players, and regional insights in this comprehensive analysis.

                                                              July 2025
                                                              Base Year: 2024
                                                              No Of Pages: 234
                                                              Price: $4750

                                                              Electrical Weapons Market Market Trends and Strategic Roadmap

                                                              The global electrical weapons market is booming, projected to reach [estimated 2033 value based on CAGR] by 2033. Driven by law enforcement and military demand for less-lethal options, this market analysis explores key trends, leading companies (Axon, Lockheed Martin, etc.), and regional growth opportunities in stun guns, tasers, and advanced technologies.

                                                              July 2025
                                                              Base Year: 2024
                                                              No Of Pages: 234
                                                              Price: $4750

                                                              Fighter Aircraft Market: Disruptive Technologies Driving Market Growth 2025-2033

                                                              The global fighter aircraft market, valued at $47.34 billion in 2025, is poised for significant growth (CAGR 3.72%) driven by geopolitical tensions and technological advancements. Explore market trends, leading companies (Lockheed Martin, Boeing, Dassault), and regional insights in this comprehensive analysis.

                                                              July 2025
                                                              Base Year: 2024
                                                              No Of Pages: 234
                                                              Price: $4750

                                                              Military Gas Mask Market Market’s Consumer Insights and Trends

                                                              The Military Gas Mask Market is poised for significant growth, driven by rising geopolitical tensions and technological advancements. Discover key trends, market size projections (2025-2033), leading companies, and regional analysis in this comprehensive market report. Explore the impact of powered respirators and evolving military needs on this dynamic sector.

                                                              July 2025
                                                              Base Year: 2024
                                                              No Of Pages: 234
                                                              Price: $4750

                                                              Exploring Middle-East and Africa Airport Baggage Handling Systems Market Growth Trajectories: CAGR Insights 2025-2033

                                                              The Middle East & Africa Airport Baggage Handling Systems market is booming, projected to reach $90.71 million in 2025 with a 10.09% CAGR through 2033. Discover key drivers, trends, and regional insights in this comprehensive market analysis. Explore growth opportunities in automated baggage systems and airport modernization.

                                                              July 2025
                                                              Base Year: 2024
                                                              No Of Pages: 210
                                                              Price: $4750

                                                              Aircraft Engines Market in Europe Market Demand and Consumption Trends: Outlook 2025-2033

                                                              The European aircraft engines market is booming, with a projected €20.73 billion valuation in 2025 and a 3.82% CAGR through 2033. Discover key trends, major players (Rolls-Royce, Safran, Pratt & Whitney), and regional breakdowns in this comprehensive market analysis.

                                                              July 2025
                                                              Base Year: 2024
                                                              No Of Pages: 234
                                                              Price: $4750

                                                              Small Arms Light Weapons Market Market Analysis and Forecasts

                                                              The global small arms and light weapons market is experiencing steady growth, driven by increased military spending, law enforcement demand, and civilian ownership. This comprehensive analysis explores market size, trends, key players, and regional insights from 2019-2033, offering valuable data for industry stakeholders.

                                                              July 2025
                                                              Base Year: 2024
                                                              No Of Pages: 234
                                                              Price: $4750

                                                              Turkey Defense & Aerospace Industry Future-Proof Strategies: Market Trends 2025-2033

                                                              Discover the booming Turkish defense & aerospace industry! This in-depth market analysis reveals a $15.27B (2025) market with a projected CAGR of 1.15%, driven by government investment and leading companies like Turkish Technic and ASELSAN. Explore market trends, key players, and future growth potential.

                                                              July 2025
                                                              Base Year: 2024
                                                              No Of Pages: 197
                                                              Price: $3800

                                                              Understanding UAM Market Trends and Growth Dynamics

                                                              The Urban Air Mobility (UAM) market is booming, projected to reach $19.13 billion by 2033 with a 23.54% CAGR. Discover key trends, growth drivers, and major players shaping this transformative sector, including eVTOL aircraft, autonomous flight, and regional market analysis. Learn how advancements in technology and supportive regulations are driving this rapidly expanding market.

                                                              July 2025
                                                              Base Year: 2024
                                                              No Of Pages: 234
                                                              Price: $4750

                                                              Growth Strategies in Europe Air Defense Systems Market Market: 2025-2033 Outlook

                                                              The European Air Defense Systems Market is booming, projected to reach €16.31 billion by 2033, driven by geopolitical tensions and technological advancements. This in-depth analysis reveals key market drivers, trends, restraints, and leading companies, providing valuable insights for investors and industry professionals. Explore the market's growth potential across air, sea, and land-based systems in key European nations.

                                                              July 2025
                                                              Base Year: 2024
                                                              No Of Pages: 234
                                                              Price: $4750

                                                              Defense Market in the Middle East & Africa CAGR Growth Drivers and Trends: Forecasts 2025-2033

                                                              The Middle East & Africa defense market is booming, projected to reach \$207.5 billion by 2033, driven by geopolitical instability and modernization efforts. Explore market trends, key players (Rheinmetall, Elbit Systems, Lockheed Martin), and regional growth forecasts in this comprehensive analysis.

                                                              July 2025
                                                              Base Year: 2024
                                                              No Of Pages: 234
                                                              Price: $4750

                                                              Air-based Remote Weapon Stations Market 2025 Trends and Forecasts 2033: Analyzing Growth Opportunities

                                                              The Air-based Remote Weapon Stations (RWS) market is booming, with a 7.32% CAGR. Explore market trends, key players (General Dynamics, Elbit Systems, Leonardo), regional insights, and future projections for this rapidly expanding sector of defense technology. Discover the impact of UAVs and advanced sensor technologies on this multi-billion dollar market.

                                                              July 2025
                                                              Base Year: 2024
                                                              No Of Pages: 234
                                                              Price: $4750

                                                              Latin America Aviation Industry Market Size and Trends 2025-2033: Comprehensive Outlook

                                                              Discover the booming Latin American aviation market! This in-depth analysis reveals a $40.11B (2025) industry with a 3.03% CAGR, driven by tourism, infrastructure improvements, and a growing middle class. Learn about key players, market segments (commercial, military, general aviation), and regional growth projections for 2025-2033.

                                                              July 2025
                                                              Base Year: 2024
                                                              No Of Pages: 234
                                                              Price: $4750

                                                              Comprehensive Review of US Business Jet Market Growth Potential

                                                              The US business jet market is booming, with a CAGR exceeding 16% and projected to reach $75 billion by 2033. This report analyzes market drivers, restraints, segments (large, light, mid-size jets), key players (Textron, Dassault, Embraer, Bombardier), and regional trends across the US. Discover insights into this lucrative sector.

                                                              July 2025
                                                              Base Year: 2024
                                                              No Of Pages: 197
                                                              Price: $3800

                                                              Europe Aircraft Lighting Market Market’s Technological Evolution: Trends and Analysis 2025-2033

                                                              The European Aircraft Lighting Market is booming, projected to reach €324.57 million by 2033, driven by LED technology adoption and stringent safety regulations. Discover key trends, growth drivers, and leading companies shaping this dynamic sector.

                                                              July 2025
                                                              Base Year: 2024
                                                              No Of Pages: 234
                                                              Price: $4750

                                                              Emerging Trends in Latin America Airport Quick Service Restaurant Market: A Technology Perspective 2025-2033

                                                              Discover the booming Latin American airport quick-service restaurant market! This comprehensive analysis reveals key trends, growth drivers, and leading brands from 2019-2033, including market size, CAGR, and regional breakdowns. Learn how rising air travel and changing consumer preferences are shaping this dynamic sector.

                                                              July 2025
                                                              Base Year: 2024
                                                              No Of Pages: 234
                                                              Price: $4750

                                                              Australia C4ISR Industry Industry’s Evolution and Growth Pathways

                                                              Discover the booming Australian C4ISR market! This in-depth analysis reveals a projected CAGR exceeding 4%, driven by defense modernization and strategic security investments. Explore market size, key players (L3Harris, Lockheed Martin, etc.), segment analysis (land, air, naval, space), and future growth forecasts through 2033.

                                                              July 2025
                                                              Base Year: 2024
                                                              No Of Pages: 197
                                                              Price: $3800

                                                              Business Address

                                                              Head Office

                                                              Office no. A 5010, fifth floor, Solitaire Business Hub, Near Phoenix mall, Pune, Maharashtra 411014

                                                              Contact Information

                                                              Craig Francis

                                                              Business Development Head

                                                              +17162654855

                                                              [email protected]

                                                              Connect With Us

                                                              Secure Payment Partners

                                                              payment image
                                                              RetailLogisticsPackagingAutomotiveHealthcareAgricultureEnergy & PowerFood & BeverageAerospace & DefenseChemicals & MaterialsHospitality and TourismAnimal Nutrition & WellnessConsumer Goods and ServicesReal Estate and ConstructionHome and Property ImprovementTechnology, Media and TelecomManufacturing Products and ServicesFinancial Services and Investment Intelligence

                                                              © 2025 All rights reserved


                                                              Privacy Policy
                                                              Terms and Conditions
                                                              FAQ
                                                              • Home
                                                              • About Us
                                                              • Industries
                                                                • Aerospace & Defense
                                                                • Agriculture
                                                                • Animal Nutrition & Wellness
                                                                • Automotive
                                                                • Chemicals & Materials
                                                                • Consumer Goods and Services
                                                                • Energy & Power
                                                                • Financial Services and Investment Intelligence
                                                                • Food & Beverage
                                                                • Home and Property Improvement
                                                                • Hospitality and Tourism
                                                                • Logistics
                                                                • Manufacturing Products and Services
                                                                • Packaging
                                                                • Professional and Commercial Services
                                                                • Real Estate and Construction
                                                                • Retail
                                                                • Technology, Media and Telecom
                                                                • Healthcare
                                                              • Services
                                                              • Contact
                                                              Main Logo
                                                              • Home
                                                              • About Us
                                                              • Industries
                                                                • Aerospace & Defense
                                                                • Agriculture
                                                                • Animal Nutrition & Wellness
                                                                • Automotive
                                                                • Chemicals & Materials
                                                                • Consumer Goods and Services
                                                                • Energy & Power
                                                                • Financial Services and Investment Intelligence
                                                                • Food & Beverage
                                                                • Home and Property Improvement
                                                                • Hospitality and Tourism
                                                                • Logistics
                                                                • Manufacturing Products and Services
                                                                • Packaging
                                                                • Professional and Commercial Services
                                                                • Real Estate and Construction
                                                                • Retail
                                                                • Technology, Media and Telecom
                                                                • Healthcare
                                                              • Services
                                                              • Contact
                                                              +17162654855
                                                              [email protected]

                                                              +17162654855

                                                              [email protected]