
Key Insights
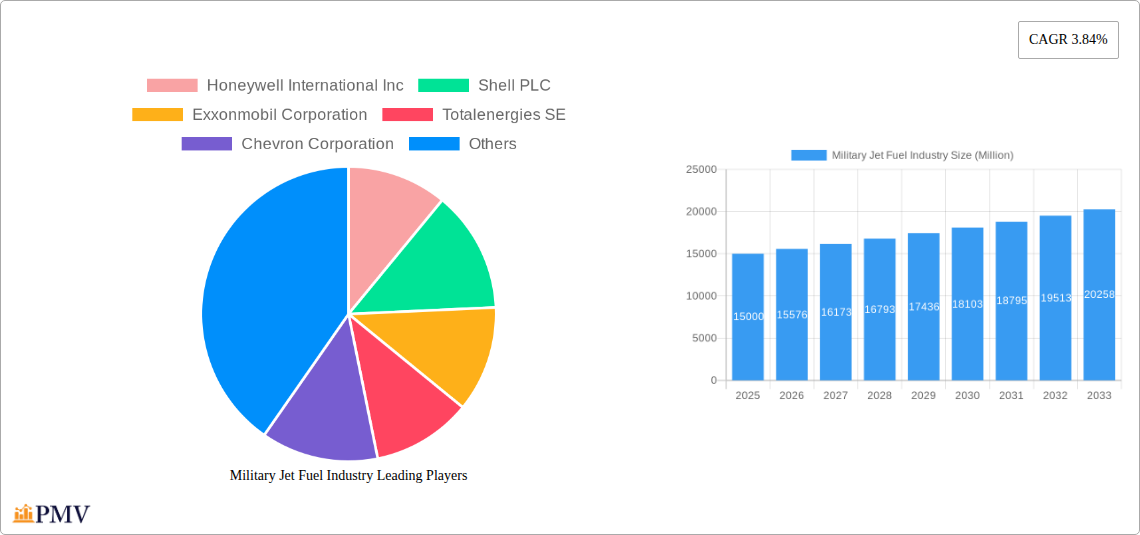
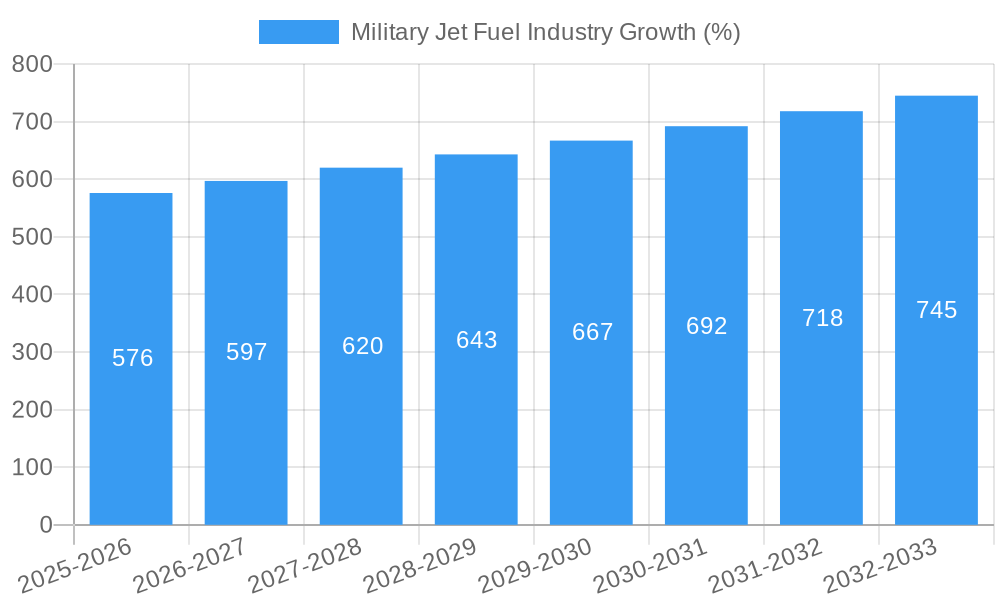
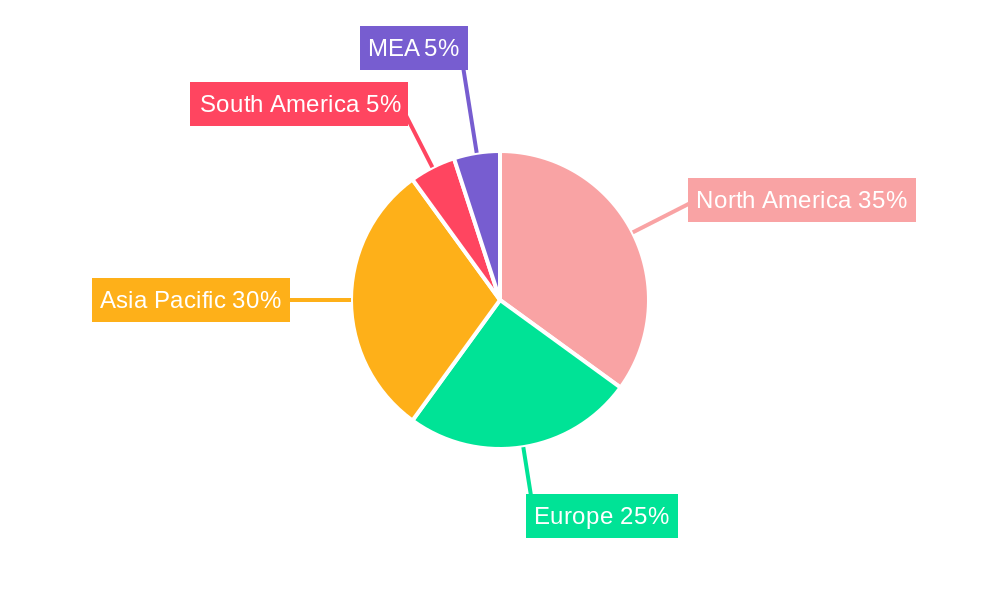
The military jet fuel market, valued at approximately $15 billion in 2025, is projected to experience steady growth, driven by increasing military aircraft operations globally and rising defense budgets in key regions. A Compound Annual Growth Rate (CAGR) of 3.84% from 2025 to 2033 indicates a substantial market expansion, reaching an estimated value exceeding $22 billion by 2033. Key drivers include modernization of existing fleets, the introduction of advanced fighter jets and military transport aircraft, and geopolitical instability leading to increased defense spending. The market is segmented by fuel type, with Air Turbine Fuel (ATF) dominating the market share, while the adoption of Renewable Aviation Fuel (RAF) is gaining traction, albeit slowly, due to high production costs and infrastructural limitations. Major players like Honeywell International Inc., Shell PLC, and ExxonMobil Corporation are actively involved in the supply chain, focusing on fuel quality, logistics, and technological advancements to meet the rigorous demands of military aviation. Regional market dynamics vary, with North America and Asia-Pacific expected to be the dominant regions, driven by strong military presence and continuous modernization efforts. Despite the growth prospects, restraints like price volatility of crude oil and stringent environmental regulations pose challenges for the industry. The ongoing transition to sustainable aviation fuels represents a significant long-term opportunity, demanding innovation and collaboration among industry stakeholders.
The competitive landscape is characterized by a blend of established oil and gas majors and specialized fuel suppliers. These companies are engaged in securing long-term supply contracts, enhancing logistics capabilities, and investing in R&D to improve fuel efficiency and sustainability. The market exhibits regional variations in growth rates, influenced by factors such as defense expenditure, geopolitical situation, and the pace of military modernization. Europe and Asia-Pacific are expected to witness robust growth, fueled by increased defense spending and modernization of their respective air forces. North America maintains a strong position due to its large military presence and continued investment in next-generation aircraft. Future growth will depend heavily on technological advancements in fuel efficiency and the successful integration of sustainable alternatives within the existing framework of military aviation operations.
Military Jet Fuel Industry: A Comprehensive Market Report (2019-2033)
This comprehensive report provides a detailed analysis of the Military Jet Fuel industry, offering invaluable insights for stakeholders across the value chain. The study period covers 2019-2033, with a base year of 2025 and a forecast period of 2025-2033. The report leverages extensive market research, encompassing historical data (2019-2024) and future projections to deliver a robust understanding of this critical sector. With a focus on key players like Honeywell International Inc, Shell PLC, ExxonMobil Corporation, TotalEnergies SE, Chevron Corporation, GS Caltex Corporation, BP PLC, and Repsol SA, the report unveils market dynamics, growth drivers, and challenges impacting the future of military jet fuel. The report segments the market by fuel type, including Air Turbine Fuel and Renewable Aviation Fuel, providing a granular analysis of market size, growth projections, and competitive dynamics.
Military Jet Fuel Industry Market Structure & Competitive Dynamics
The military jet fuel market exhibits a moderately concentrated structure, dominated by a few large multinational corporations. These players possess significant refining capacity, global distribution networks, and long-standing relationships with defense ministries worldwide. Market share data suggests that the top five companies account for approximately xx% of the global market, with Honeywell International Inc, Shell PLC, and ExxonMobil Corporation consistently holding leading positions.
The industry's innovation ecosystem is characterized by ongoing research and development focused on enhancing fuel efficiency, reducing emissions, and improving performance under extreme conditions. Stringent regulatory frameworks govern fuel specifications, safety standards, and environmental compliance, shaping industry practices and impacting operational costs. The market faces limited product substitution, with few alternatives available for military aircraft propulsion. End-user trends reflect a growing focus on sustainable aviation fuels (SAF) to meet environmental targets. Significant M&A activity has been limited in recent years, with deal values totaling approximately $xx Million in the past five years. However, potential for consolidation remains high.
- Market Concentration: High, with top 5 players controlling xx% of the market.
- M&A Activity (2019-2024): Total deal value approximately $xx Million.
- Regulatory Landscape: Stringent, focusing on safety, performance, and environmental compliance.
- Innovation: Focused on fuel efficiency, emissions reduction, and performance enhancement.
Military Jet Fuel Industry Industry Trends & Insights
The military jet fuel market is projected to experience a compound annual growth rate (CAGR) of xx% during the forecast period (2025-2033), driven by increasing defense budgets globally, modernization of military aircraft fleets, and heightened geopolitical tensions. Technological disruptions are playing a role, with the introduction of SAFs gradually gaining traction, although widespread adoption is hindered by limited production capacity and higher costs. Consumer preferences, in this context, refer to the demands of military end-users for high-performance, reliable, and environmentally compliant fuels. The competitive dynamics are marked by ongoing investments in refining capacity, strategic partnerships, and efforts to secure long-term supply contracts with defense forces. Market penetration of SAFs is currently low, estimated at approximately xx%, but is expected to increase to xx% by 2033 due to both regulatory pressure and environmental concerns.
Dominant Markets & Segments in Military Jet Fuel Industry
The North American region is currently the dominant market for military jet fuel, driven by strong defense spending, a large aircraft fleet, and robust infrastructure supporting logistics and distribution. The Asia-Pacific region shows strong growth potential.
Key Drivers of Dominance (North America):
- Large and technologically advanced military aviation fleet.
- High defense expenditure.
- Well-established supply chains and logistics infrastructure.
- Favorable regulatory environment supporting industry growth.
Fuel Type Segmentation:
- Air Turbine Fuel: This segment dominates the market, accounting for approximately xx% of total revenue in 2025, with projected growth driven by continued reliance on conventional jet fuel for most military applications.
- Renewable Aviation Fuel (SAF): This segment is currently smaller but displays significant growth potential, driven by increased environmental awareness and regulatory pressure to reduce emissions. Its market share is projected to reach xx% by 2033.
Military Jet Fuel Industry Product Innovations
Recent product developments focus on enhancing fuel efficiency, reducing emissions through the use of additives, and improving fuel stability and storage life. Bio-based SAFs are emerging as a significant innovation, offering a more sustainable alternative to conventional fossil-fuel-based fuels. The competitive advantage lies in securing cost-effective supply chains, achieving optimal fuel performance, and meeting stringent environmental regulations.
Report Segmentation & Scope
The report segments the military jet fuel market by fuel type: Air Turbine Fuel and Renewable Aviation Fuel. Air Turbine Fuel is further segmented by fuel specification (e.g., JP-5, JP-8) and geographic region. Renewable Aviation Fuel is segmented by feedstock (e.g., used cooking oil, algae) and production method. Each segment's growth projections, market sizes (in Millions), and competitive dynamics are analyzed separately.
Key Drivers of Military Jet Fuel Industry Growth
Several key factors propel the growth of the military jet fuel industry. Firstly, sustained global defense spending, particularly from major military powers, fuels demand. Secondly, modernization and expansion of military aircraft fleets necessitate considerable fuel supplies. Thirdly, geopolitical instability and regional conflicts create heightened demand.
Challenges in the Military Jet Fuel Industry Sector
The industry faces challenges, including stringent environmental regulations increasing production costs and pushing for SAF adoption, supply chain disruptions that can impact fuel availability and prices, and intense competition among major players. The transition to SAFs presents a significant technological and economic hurdle.
Leading Players in the Military Jet Fuel Industry Market
- Honeywell International Inc
- Shell PLC
- ExxonMobil Corporation
- TotalEnergies SE
- Chevron Corporation
- GS Caltex Corporation
- BP PLC
- Repsol SA
Key Developments in Military Jet Fuel Industry Sector
- July 2023: Viva Energy Refining Pty Ltd secured a six-year (potentially 12-year) contract with the Australian Department of Defense to supply aviation, marine, and ground fuel, restarting JP-5 production at its Geelong Refinery. This significantly boosts domestic Australian supply and showcases a commitment to military-grade fuel production.
- March 2023: US sanctions on Myanmar's military regime impacted jet fuel supply to its armed forces, highlighting geopolitical risks to fuel availability and the potential impact of sanctions on industry players involved in supplying sanctioned entities.
Strategic Military Jet Fuel Industry Market Outlook
The military jet fuel market presents significant growth opportunities, particularly in the development and adoption of sustainable aviation fuels. Strategic partnerships, investments in refining capacity, and exploration of alternative feedstocks for SAF production will be crucial for capturing future market share. The focus on operational efficiency, enhanced fuel performance, and environmental compliance will define success in this evolving sector.
Military Jet Fuel Industry Segmentation
-
1. Fuel Type
- 1.1. Air Turbine Fuel
- 1.2. Renewable Avaition Fuel
Military Jet Fuel Industry Segmentation By Geography
-
1. North America
- 1.1. United States
- 1.2. Canada
- 1.3. Rest of North America
-
2. Europe
- 2.1. Germany
- 2.2. United Kingdom
- 2.3. Italy
- 2.4. France
- 2.5. Russia
- 2.6. Rest of North America
-
3. Asia Pacific
- 3.1. China
- 3.2. India
- 3.3. Japan
- 3.4. South Korea
- 3.5. Rest of Asia Pacific
-
4. Rest of the World
- 4.1. Saudi Arabia
- 4.2. United Arab Emirates
- 4.3. South Africa
- 4.4. Algeria
Military Jet Fuel Industry REPORT HIGHLIGHTS
| Aspects | Details |
|---|---|
| Study Period | 2019-2033 |
| Base Year | 2024 |
| Estimated Year | 2025 |
| Forecast Period | 2025-2033 |
| Historical Period | 2019-2024 |
| Growth Rate | CAGR of 3.84% from 2019-2033 |
| Segmentation |
|
Table of Contents
- 1. Introduction
- 1.1. Research Scope
- 1.2. Market Segmentation
- 1.3. Research Methodology
- 1.4. Definitions and Assumptions
- 2. Executive Summary
- 2.1. Introduction
- 3. Market Dynamics
- 3.1. Introduction
- 3.2. Market Drivers
- 3.2.1. 4.; Modernization and Upgrades of Existing Military Aircraft Fleets4.; Increasing Defense Budgets
- 3.3. Market Restrains
- 3.3.1. 4.; Shift Toward Unmanned Aircraft
- 3.4. Market Trends
- 3.4.1. Renewable Aviation Fuel to be the Fastest Growing Market
- 4. Market Factor Analysis
- 4.1. Porters Five Forces
- 4.2. Supply/Value Chain
- 4.3. PESTEL analysis
- 4.4. Market Entropy
- 4.5. Patent/Trademark Analysis
- 5. Global Military Jet Fuel Industry Analysis, Insights and Forecast, 2019-2031
- 5.1. Market Analysis, Insights and Forecast - by Fuel Type
- 5.1.1. Air Turbine Fuel
- 5.1.2. Renewable Avaition Fuel
- 5.2. Market Analysis, Insights and Forecast - by Region
- 5.2.1. North America
- 5.2.2. Europe
- 5.2.3. Asia Pacific
- 5.2.4. Rest of the World
- 5.1. Market Analysis, Insights and Forecast - by Fuel Type
- 6. North America Military Jet Fuel Industry Analysis, Insights and Forecast, 2019-2031
- 6.1. Market Analysis, Insights and Forecast - by Fuel Type
- 6.1.1. Air Turbine Fuel
- 6.1.2. Renewable Avaition Fuel
- 6.1. Market Analysis, Insights and Forecast - by Fuel Type
- 7. Europe Military Jet Fuel Industry Analysis, Insights and Forecast, 2019-2031
- 7.1. Market Analysis, Insights and Forecast - by Fuel Type
- 7.1.1. Air Turbine Fuel
- 7.1.2. Renewable Avaition Fuel
- 7.1. Market Analysis, Insights and Forecast - by Fuel Type
- 8. Asia Pacific Military Jet Fuel Industry Analysis, Insights and Forecast, 2019-2031
- 8.1. Market Analysis, Insights and Forecast - by Fuel Type
- 8.1.1. Air Turbine Fuel
- 8.1.2. Renewable Avaition Fuel
- 8.1. Market Analysis, Insights and Forecast - by Fuel Type
- 9. Rest of the World Military Jet Fuel Industry Analysis, Insights and Forecast, 2019-2031
- 9.1. Market Analysis, Insights and Forecast - by Fuel Type
- 9.1.1. Air Turbine Fuel
- 9.1.2. Renewable Avaition Fuel
- 9.1. Market Analysis, Insights and Forecast - by Fuel Type
- 10. North America Military Jet Fuel Industry Analysis, Insights and Forecast, 2019-2031
- 10.1. Market Analysis, Insights and Forecast - By Country/Sub-region
- 10.1.1 United States
- 10.1.2 Canada
- 10.1.3 Mexico
- 11. Europe Military Jet Fuel Industry Analysis, Insights and Forecast, 2019-2031
- 11.1. Market Analysis, Insights and Forecast - By Country/Sub-region
- 11.1.1 Germany
- 11.1.2 United Kingdom
- 11.1.3 France
- 11.1.4 Spain
- 11.1.5 Italy
- 11.1.6 Spain
- 11.1.7 Belgium
- 11.1.8 Netherland
- 11.1.9 Nordics
- 11.1.10 Rest of Europe
- 12. Asia Pacific Military Jet Fuel Industry Analysis, Insights and Forecast, 2019-2031
- 12.1. Market Analysis, Insights and Forecast - By Country/Sub-region
- 12.1.1 China
- 12.1.2 Japan
- 12.1.3 India
- 12.1.4 South Korea
- 12.1.5 Southeast Asia
- 12.1.6 Australia
- 12.1.7 Indonesia
- 12.1.8 Phillipes
- 12.1.9 Singapore
- 12.1.10 Thailandc
- 12.1.11 Rest of Asia Pacific
- 13. South America Military Jet Fuel Industry Analysis, Insights and Forecast, 2019-2031
- 13.1. Market Analysis, Insights and Forecast - By Country/Sub-region
- 13.1.1 Brazil
- 13.1.2 Argentina
- 13.1.3 Peru
- 13.1.4 Chile
- 13.1.5 Colombia
- 13.1.6 Ecuador
- 13.1.7 Venezuela
- 13.1.8 Rest of South America
- 14. MEA Military Jet Fuel Industry Analysis, Insights and Forecast, 2019-2031
- 14.1. Market Analysis, Insights and Forecast - By Country/Sub-region
- 14.1.1 United Arab Emirates
- 14.1.2 Saudi Arabia
- 14.1.3 South Africa
- 14.1.4 Rest of Middle East and Africa
- 15. Competitive Analysis
- 15.1. Global Market Share Analysis 2024
- 15.2. Company Profiles
- 15.2.1 Honeywell International Inc
- 15.2.1.1. Overview
- 15.2.1.2. Products
- 15.2.1.3. SWOT Analysis
- 15.2.1.4. Recent Developments
- 15.2.1.5. Financials (Based on Availability)
- 15.2.2 Shell PLC
- 15.2.2.1. Overview
- 15.2.2.2. Products
- 15.2.2.3. SWOT Analysis
- 15.2.2.4. Recent Developments
- 15.2.2.5. Financials (Based on Availability)
- 15.2.3 Exxonmobil Corporation
- 15.2.3.1. Overview
- 15.2.3.2. Products
- 15.2.3.3. SWOT Analysis
- 15.2.3.4. Recent Developments
- 15.2.3.5. Financials (Based on Availability)
- 15.2.4 Totalenergies SE
- 15.2.4.1. Overview
- 15.2.4.2. Products
- 15.2.4.3. SWOT Analysis
- 15.2.4.4. Recent Developments
- 15.2.4.5. Financials (Based on Availability)
- 15.2.5 Chevron Corporation
- 15.2.5.1. Overview
- 15.2.5.2. Products
- 15.2.5.3. SWOT Analysis
- 15.2.5.4. Recent Developments
- 15.2.5.5. Financials (Based on Availability)
- 15.2.6 GS Caltex Corporation
- 15.2.6.1. Overview
- 15.2.6.2. Products
- 15.2.6.3. SWOT Analysis
- 15.2.6.4. Recent Developments
- 15.2.6.5. Financials (Based on Availability)
- 15.2.7 BP PLC
- 15.2.7.1. Overview
- 15.2.7.2. Products
- 15.2.7.3. SWOT Analysis
- 15.2.7.4. Recent Developments
- 15.2.7.5. Financials (Based on Availability)
- 15.2.8 Repsol SA
- 15.2.8.1. Overview
- 15.2.8.2. Products
- 15.2.8.3. SWOT Analysis
- 15.2.8.4. Recent Developments
- 15.2.8.5. Financials (Based on Availability)
- 15.2.1 Honeywell International Inc
List of Figures
- Figure 1: Global Military Jet Fuel Industry Revenue Breakdown (Million, %) by Region 2024 & 2032
- Figure 2: Global Military Jet Fuel Industry Volume Breakdown (Litre, %) by Region 2024 & 2032
- Figure 3: North America Military Jet Fuel Industry Revenue (Million), by Country 2024 & 2032
- Figure 4: North America Military Jet Fuel Industry Volume (Litre), by Country 2024 & 2032
- Figure 5: North America Military Jet Fuel Industry Revenue Share (%), by Country 2024 & 2032
- Figure 6: North America Military Jet Fuel Industry Volume Share (%), by Country 2024 & 2032
- Figure 7: Europe Military Jet Fuel Industry Revenue (Million), by Country 2024 & 2032
- Figure 8: Europe Military Jet Fuel Industry Volume (Litre), by Country 2024 & 2032
- Figure 9: Europe Military Jet Fuel Industry Revenue Share (%), by Country 2024 & 2032
- Figure 10: Europe Military Jet Fuel Industry Volume Share (%), by Country 2024 & 2032
- Figure 11: Asia Pacific Military Jet Fuel Industry Revenue (Million), by Country 2024 & 2032
- Figure 12: Asia Pacific Military Jet Fuel Industry Volume (Litre), by Country 2024 & 2032
- Figure 13: Asia Pacific Military Jet Fuel Industry Revenue Share (%), by Country 2024 & 2032
- Figure 14: Asia Pacific Military Jet Fuel Industry Volume Share (%), by Country 2024 & 2032
- Figure 15: South America Military Jet Fuel Industry Revenue (Million), by Country 2024 & 2032
- Figure 16: South America Military Jet Fuel Industry Volume (Litre), by Country 2024 & 2032
- Figure 17: South America Military Jet Fuel Industry Revenue Share (%), by Country 2024 & 2032
- Figure 18: South America Military Jet Fuel Industry Volume Share (%), by Country 2024 & 2032
- Figure 19: MEA Military Jet Fuel Industry Revenue (Million), by Country 2024 & 2032
- Figure 20: MEA Military Jet Fuel Industry Volume (Litre), by Country 2024 & 2032
- Figure 21: MEA Military Jet Fuel Industry Revenue Share (%), by Country 2024 & 2032
- Figure 22: MEA Military Jet Fuel Industry Volume Share (%), by Country 2024 & 2032
- Figure 23: North America Military Jet Fuel Industry Revenue (Million), by Fuel Type 2024 & 2032
- Figure 24: North America Military Jet Fuel Industry Volume (Litre), by Fuel Type 2024 & 2032
- Figure 25: North America Military Jet Fuel Industry Revenue Share (%), by Fuel Type 2024 & 2032
- Figure 26: North America Military Jet Fuel Industry Volume Share (%), by Fuel Type 2024 & 2032
- Figure 27: North America Military Jet Fuel Industry Revenue (Million), by Country 2024 & 2032
- Figure 28: North America Military Jet Fuel Industry Volume (Litre), by Country 2024 & 2032
- Figure 29: North America Military Jet Fuel Industry Revenue Share (%), by Country 2024 & 2032
- Figure 30: North America Military Jet Fuel Industry Volume Share (%), by Country 2024 & 2032
- Figure 31: Europe Military Jet Fuel Industry Revenue (Million), by Fuel Type 2024 & 2032
- Figure 32: Europe Military Jet Fuel Industry Volume (Litre), by Fuel Type 2024 & 2032
- Figure 33: Europe Military Jet Fuel Industry Revenue Share (%), by Fuel Type 2024 & 2032
- Figure 34: Europe Military Jet Fuel Industry Volume Share (%), by Fuel Type 2024 & 2032
- Figure 35: Europe Military Jet Fuel Industry Revenue (Million), by Country 2024 & 2032
- Figure 36: Europe Military Jet Fuel Industry Volume (Litre), by Country 2024 & 2032
- Figure 37: Europe Military Jet Fuel Industry Revenue Share (%), by Country 2024 & 2032
- Figure 38: Europe Military Jet Fuel Industry Volume Share (%), by Country 2024 & 2032
- Figure 39: Asia Pacific Military Jet Fuel Industry Revenue (Million), by Fuel Type 2024 & 2032
- Figure 40: Asia Pacific Military Jet Fuel Industry Volume (Litre), by Fuel Type 2024 & 2032
- Figure 41: Asia Pacific Military Jet Fuel Industry Revenue Share (%), by Fuel Type 2024 & 2032
- Figure 42: Asia Pacific Military Jet Fuel Industry Volume Share (%), by Fuel Type 2024 & 2032
- Figure 43: Asia Pacific Military Jet Fuel Industry Revenue (Million), by Country 2024 & 2032
- Figure 44: Asia Pacific Military Jet Fuel Industry Volume (Litre), by Country 2024 & 2032
- Figure 45: Asia Pacific Military Jet Fuel Industry Revenue Share (%), by Country 2024 & 2032
- Figure 46: Asia Pacific Military Jet Fuel Industry Volume Share (%), by Country 2024 & 2032
- Figure 47: Rest of the World Military Jet Fuel Industry Revenue (Million), by Fuel Type 2024 & 2032
- Figure 48: Rest of the World Military Jet Fuel Industry Volume (Litre), by Fuel Type 2024 & 2032
- Figure 49: Rest of the World Military Jet Fuel Industry Revenue Share (%), by Fuel Type 2024 & 2032
- Figure 50: Rest of the World Military Jet Fuel Industry Volume Share (%), by Fuel Type 2024 & 2032
- Figure 51: Rest of the World Military Jet Fuel Industry Revenue (Million), by Country 2024 & 2032
- Figure 52: Rest of the World Military Jet Fuel Industry Volume (Litre), by Country 2024 & 2032
- Figure 53: Rest of the World Military Jet Fuel Industry Revenue Share (%), by Country 2024 & 2032
- Figure 54: Rest of the World Military Jet Fuel Industry Volume Share (%), by Country 2024 & 2032
List of Tables
- Table 1: Global Military Jet Fuel Industry Revenue Million Forecast, by Region 2019 & 2032
- Table 2: Global Military Jet Fuel Industry Volume Litre Forecast, by Region 2019 & 2032
- Table 3: Global Military Jet Fuel Industry Revenue Million Forecast, by Fuel Type 2019 & 2032
- Table 4: Global Military Jet Fuel Industry Volume Litre Forecast, by Fuel Type 2019 & 2032
- Table 5: Global Military Jet Fuel Industry Revenue Million Forecast, by Region 2019 & 2032
- Table 6: Global Military Jet Fuel Industry Volume Litre Forecast, by Region 2019 & 2032
- Table 7: Global Military Jet Fuel Industry Revenue Million Forecast, by Country 2019 & 2032
- Table 8: Global Military Jet Fuel Industry Volume Litre Forecast, by Country 2019 & 2032
- Table 9: United States Military Jet Fuel Industry Revenue (Million) Forecast, by Application 2019 & 2032
- Table 10: United States Military Jet Fuel Industry Volume (Litre) Forecast, by Application 2019 & 2032
- Table 11: Canada Military Jet Fuel Industry Revenue (Million) Forecast, by Application 2019 & 2032
- Table 12: Canada Military Jet Fuel Industry Volume (Litre) Forecast, by Application 2019 & 2032
- Table 13: Mexico Military Jet Fuel Industry Revenue (Million) Forecast, by Application 2019 & 2032
- Table 14: Mexico Military Jet Fuel Industry Volume (Litre) Forecast, by Application 2019 & 2032
- Table 15: Global Military Jet Fuel Industry Revenue Million Forecast, by Country 2019 & 2032
- Table 16: Global Military Jet Fuel Industry Volume Litre Forecast, by Country 2019 & 2032
- Table 17: Germany Military Jet Fuel Industry Revenue (Million) Forecast, by Application 2019 & 2032
- Table 18: Germany Military Jet Fuel Industry Volume (Litre) Forecast, by Application 2019 & 2032
- Table 19: United Kingdom Military Jet Fuel Industry Revenue (Million) Forecast, by Application 2019 & 2032
- Table 20: United Kingdom Military Jet Fuel Industry Volume (Litre) Forecast, by Application 2019 & 2032
- Table 21: France Military Jet Fuel Industry Revenue (Million) Forecast, by Application 2019 & 2032
- Table 22: France Military Jet Fuel Industry Volume (Litre) Forecast, by Application 2019 & 2032
- Table 23: Spain Military Jet Fuel Industry Revenue (Million) Forecast, by Application 2019 & 2032
- Table 24: Spain Military Jet Fuel Industry Volume (Litre) Forecast, by Application 2019 & 2032
- Table 25: Italy Military Jet Fuel Industry Revenue (Million) Forecast, by Application 2019 & 2032
- Table 26: Italy Military Jet Fuel Industry Volume (Litre) Forecast, by Application 2019 & 2032
- Table 27: Spain Military Jet Fuel Industry Revenue (Million) Forecast, by Application 2019 & 2032
- Table 28: Spain Military Jet Fuel Industry Volume (Litre) Forecast, by Application 2019 & 2032
- Table 29: Belgium Military Jet Fuel Industry Revenue (Million) Forecast, by Application 2019 & 2032
- Table 30: Belgium Military Jet Fuel Industry Volume (Litre) Forecast, by Application 2019 & 2032
- Table 31: Netherland Military Jet Fuel Industry Revenue (Million) Forecast, by Application 2019 & 2032
- Table 32: Netherland Military Jet Fuel Industry Volume (Litre) Forecast, by Application 2019 & 2032
- Table 33: Nordics Military Jet Fuel Industry Revenue (Million) Forecast, by Application 2019 & 2032
- Table 34: Nordics Military Jet Fuel Industry Volume (Litre) Forecast, by Application 2019 & 2032
- Table 35: Rest of Europe Military Jet Fuel Industry Revenue (Million) Forecast, by Application 2019 & 2032
- Table 36: Rest of Europe Military Jet Fuel Industry Volume (Litre) Forecast, by Application 2019 & 2032
- Table 37: Global Military Jet Fuel Industry Revenue Million Forecast, by Country 2019 & 2032
- Table 38: Global Military Jet Fuel Industry Volume Litre Forecast, by Country 2019 & 2032
- Table 39: China Military Jet Fuel Industry Revenue (Million) Forecast, by Application 2019 & 2032
- Table 40: China Military Jet Fuel Industry Volume (Litre) Forecast, by Application 2019 & 2032
- Table 41: Japan Military Jet Fuel Industry Revenue (Million) Forecast, by Application 2019 & 2032
- Table 42: Japan Military Jet Fuel Industry Volume (Litre) Forecast, by Application 2019 & 2032
- Table 43: India Military Jet Fuel Industry Revenue (Million) Forecast, by Application 2019 & 2032
- Table 44: India Military Jet Fuel Industry Volume (Litre) Forecast, by Application 2019 & 2032
- Table 45: South Korea Military Jet Fuel Industry Revenue (Million) Forecast, by Application 2019 & 2032
- Table 46: South Korea Military Jet Fuel Industry Volume (Litre) Forecast, by Application 2019 & 2032
- Table 47: Southeast Asia Military Jet Fuel Industry Revenue (Million) Forecast, by Application 2019 & 2032
- Table 48: Southeast Asia Military Jet Fuel Industry Volume (Litre) Forecast, by Application 2019 & 2032
- Table 49: Australia Military Jet Fuel Industry Revenue (Million) Forecast, by Application 2019 & 2032
- Table 50: Australia Military Jet Fuel Industry Volume (Litre) Forecast, by Application 2019 & 2032
- Table 51: Indonesia Military Jet Fuel Industry Revenue (Million) Forecast, by Application 2019 & 2032
- Table 52: Indonesia Military Jet Fuel Industry Volume (Litre) Forecast, by Application 2019 & 2032
- Table 53: Phillipes Military Jet Fuel Industry Revenue (Million) Forecast, by Application 2019 & 2032
- Table 54: Phillipes Military Jet Fuel Industry Volume (Litre) Forecast, by Application 2019 & 2032
- Table 55: Singapore Military Jet Fuel Industry Revenue (Million) Forecast, by Application 2019 & 2032
- Table 56: Singapore Military Jet Fuel Industry Volume (Litre) Forecast, by Application 2019 & 2032
- Table 57: Thailandc Military Jet Fuel Industry Revenue (Million) Forecast, by Application 2019 & 2032
- Table 58: Thailandc Military Jet Fuel Industry Volume (Litre) Forecast, by Application 2019 & 2032
- Table 59: Rest of Asia Pacific Military Jet Fuel Industry Revenue (Million) Forecast, by Application 2019 & 2032
- Table 60: Rest of Asia Pacific Military Jet Fuel Industry Volume (Litre) Forecast, by Application 2019 & 2032
- Table 61: Global Military Jet Fuel Industry Revenue Million Forecast, by Country 2019 & 2032
- Table 62: Global Military Jet Fuel Industry Volume Litre Forecast, by Country 2019 & 2032
- Table 63: Brazil Military Jet Fuel Industry Revenue (Million) Forecast, by Application 2019 & 2032
- Table 64: Brazil Military Jet Fuel Industry Volume (Litre) Forecast, by Application 2019 & 2032
- Table 65: Argentina Military Jet Fuel Industry Revenue (Million) Forecast, by Application 2019 & 2032
- Table 66: Argentina Military Jet Fuel Industry Volume (Litre) Forecast, by Application 2019 & 2032
- Table 67: Peru Military Jet Fuel Industry Revenue (Million) Forecast, by Application 2019 & 2032
- Table 68: Peru Military Jet Fuel Industry Volume (Litre) Forecast, by Application 2019 & 2032
- Table 69: Chile Military Jet Fuel Industry Revenue (Million) Forecast, by Application 2019 & 2032
- Table 70: Chile Military Jet Fuel Industry Volume (Litre) Forecast, by Application 2019 & 2032
- Table 71: Colombia Military Jet Fuel Industry Revenue (Million) Forecast, by Application 2019 & 2032
- Table 72: Colombia Military Jet Fuel Industry Volume (Litre) Forecast, by Application 2019 & 2032
- Table 73: Ecuador Military Jet Fuel Industry Revenue (Million) Forecast, by Application 2019 & 2032
- Table 74: Ecuador Military Jet Fuel Industry Volume (Litre) Forecast, by Application 2019 & 2032
- Table 75: Venezuela Military Jet Fuel Industry Revenue (Million) Forecast, by Application 2019 & 2032
- Table 76: Venezuela Military Jet Fuel Industry Volume (Litre) Forecast, by Application 2019 & 2032
- Table 77: Rest of South America Military Jet Fuel Industry Revenue (Million) Forecast, by Application 2019 & 2032
- Table 78: Rest of South America Military Jet Fuel Industry Volume (Litre) Forecast, by Application 2019 & 2032
- Table 79: Global Military Jet Fuel Industry Revenue Million Forecast, by Country 2019 & 2032
- Table 80: Global Military Jet Fuel Industry Volume Litre Forecast, by Country 2019 & 2032
- Table 81: United Arab Emirates Military Jet Fuel Industry Revenue (Million) Forecast, by Application 2019 & 2032
- Table 82: United Arab Emirates Military Jet Fuel Industry Volume (Litre) Forecast, by Application 2019 & 2032
- Table 83: Saudi Arabia Military Jet Fuel Industry Revenue (Million) Forecast, by Application 2019 & 2032
- Table 84: Saudi Arabia Military Jet Fuel Industry Volume (Litre) Forecast, by Application 2019 & 2032
- Table 85: South Africa Military Jet Fuel Industry Revenue (Million) Forecast, by Application 2019 & 2032
- Table 86: South Africa Military Jet Fuel Industry Volume (Litre) Forecast, by Application 2019 & 2032
- Table 87: Rest of Middle East and Africa Military Jet Fuel Industry Revenue (Million) Forecast, by Application 2019 & 2032
- Table 88: Rest of Middle East and Africa Military Jet Fuel Industry Volume (Litre) Forecast, by Application 2019 & 2032
- Table 89: Global Military Jet Fuel Industry Revenue Million Forecast, by Fuel Type 2019 & 2032
- Table 90: Global Military Jet Fuel Industry Volume Litre Forecast, by Fuel Type 2019 & 2032
- Table 91: Global Military Jet Fuel Industry Revenue Million Forecast, by Country 2019 & 2032
- Table 92: Global Military Jet Fuel Industry Volume Litre Forecast, by Country 2019 & 2032
- Table 93: United States Military Jet Fuel Industry Revenue (Million) Forecast, by Application 2019 & 2032
- Table 94: United States Military Jet Fuel Industry Volume (Litre) Forecast, by Application 2019 & 2032
- Table 95: Canada Military Jet Fuel Industry Revenue (Million) Forecast, by Application 2019 & 2032
- Table 96: Canada Military Jet Fuel Industry Volume (Litre) Forecast, by Application 2019 & 2032
- Table 97: Rest of North America Military Jet Fuel Industry Revenue (Million) Forecast, by Application 2019 & 2032
- Table 98: Rest of North America Military Jet Fuel Industry Volume (Litre) Forecast, by Application 2019 & 2032
- Table 99: Global Military Jet Fuel Industry Revenue Million Forecast, by Fuel Type 2019 & 2032
- Table 100: Global Military Jet Fuel Industry Volume Litre Forecast, by Fuel Type 2019 & 2032
- Table 101: Global Military Jet Fuel Industry Revenue Million Forecast, by Country 2019 & 2032
- Table 102: Global Military Jet Fuel Industry Volume Litre Forecast, by Country 2019 & 2032
- Table 103: Germany Military Jet Fuel Industry Revenue (Million) Forecast, by Application 2019 & 2032
- Table 104: Germany Military Jet Fuel Industry Volume (Litre) Forecast, by Application 2019 & 2032
- Table 105: United Kingdom Military Jet Fuel Industry Revenue (Million) Forecast, by Application 2019 & 2032
- Table 106: United Kingdom Military Jet Fuel Industry Volume (Litre) Forecast, by Application 2019 & 2032
- Table 107: Italy Military Jet Fuel Industry Revenue (Million) Forecast, by Application 2019 & 2032
- Table 108: Italy Military Jet Fuel Industry Volume (Litre) Forecast, by Application 2019 & 2032
- Table 109: France Military Jet Fuel Industry Revenue (Million) Forecast, by Application 2019 & 2032
- Table 110: France Military Jet Fuel Industry Volume (Litre) Forecast, by Application 2019 & 2032
- Table 111: Russia Military Jet Fuel Industry Revenue (Million) Forecast, by Application 2019 & 2032
- Table 112: Russia Military Jet Fuel Industry Volume (Litre) Forecast, by Application 2019 & 2032
- Table 113: Rest of North America Military Jet Fuel Industry Revenue (Million) Forecast, by Application 2019 & 2032
- Table 114: Rest of North America Military Jet Fuel Industry Volume (Litre) Forecast, by Application 2019 & 2032
- Table 115: Global Military Jet Fuel Industry Revenue Million Forecast, by Fuel Type 2019 & 2032
- Table 116: Global Military Jet Fuel Industry Volume Litre Forecast, by Fuel Type 2019 & 2032
- Table 117: Global Military Jet Fuel Industry Revenue Million Forecast, by Country 2019 & 2032
- Table 118: Global Military Jet Fuel Industry Volume Litre Forecast, by Country 2019 & 2032
- Table 119: China Military Jet Fuel Industry Revenue (Million) Forecast, by Application 2019 & 2032
- Table 120: China Military Jet Fuel Industry Volume (Litre) Forecast, by Application 2019 & 2032
- Table 121: India Military Jet Fuel Industry Revenue (Million) Forecast, by Application 2019 & 2032
- Table 122: India Military Jet Fuel Industry Volume (Litre) Forecast, by Application 2019 & 2032
- Table 123: Japan Military Jet Fuel Industry Revenue (Million) Forecast, by Application 2019 & 2032
- Table 124: Japan Military Jet Fuel Industry Volume (Litre) Forecast, by Application 2019 & 2032
- Table 125: South Korea Military Jet Fuel Industry Revenue (Million) Forecast, by Application 2019 & 2032
- Table 126: South Korea Military Jet Fuel Industry Volume (Litre) Forecast, by Application 2019 & 2032
- Table 127: Rest of Asia Pacific Military Jet Fuel Industry Revenue (Million) Forecast, by Application 2019 & 2032
- Table 128: Rest of Asia Pacific Military Jet Fuel Industry Volume (Litre) Forecast, by Application 2019 & 2032
- Table 129: Global Military Jet Fuel Industry Revenue Million Forecast, by Fuel Type 2019 & 2032
- Table 130: Global Military Jet Fuel Industry Volume Litre Forecast, by Fuel Type 2019 & 2032
- Table 131: Global Military Jet Fuel Industry Revenue Million Forecast, by Country 2019 & 2032
- Table 132: Global Military Jet Fuel Industry Volume Litre Forecast, by Country 2019 & 2032
- Table 133: Saudi Arabia Military Jet Fuel Industry Revenue (Million) Forecast, by Application 2019 & 2032
- Table 134: Saudi Arabia Military Jet Fuel Industry Volume (Litre) Forecast, by Application 2019 & 2032
- Table 135: United Arab Emirates Military Jet Fuel Industry Revenue (Million) Forecast, by Application 2019 & 2032
- Table 136: United Arab Emirates Military Jet Fuel Industry Volume (Litre) Forecast, by Application 2019 & 2032
- Table 137: South Africa Military Jet Fuel Industry Revenue (Million) Forecast, by Application 2019 & 2032
- Table 138: South Africa Military Jet Fuel Industry Volume (Litre) Forecast, by Application 2019 & 2032
- Table 139: Algeria Military Jet Fuel Industry Revenue (Million) Forecast, by Application 2019 & 2032
- Table 140: Algeria Military Jet Fuel Industry Volume (Litre) Forecast, by Application 2019 & 2032
Frequently Asked Questions
1. What is the projected Compound Annual Growth Rate (CAGR) of the Military Jet Fuel Industry?
The projected CAGR is approximately 3.84%.
2. Which companies are prominent players in the Military Jet Fuel Industry?
Key companies in the market include Honeywell International Inc, Shell PLC, Exxonmobil Corporation, Totalenergies SE, Chevron Corporation, GS Caltex Corporation, BP PLC, Repsol SA.
3. What are the main segments of the Military Jet Fuel Industry?
The market segments include Fuel Type.
4. Can you provide details about the market size?
The market size is estimated to be USD XX Million as of 2022.
5. What are some drivers contributing to market growth?
4.; Modernization and Upgrades of Existing Military Aircraft Fleets4.; Increasing Defense Budgets.
6. What are the notable trends driving market growth?
Renewable Aviation Fuel to be the Fastest Growing Market.
7. Are there any restraints impacting market growth?
4.; Shift Toward Unmanned Aircraft.
8. Can you provide examples of recent developments in the market?
July 2023: Viva Energy Refining Pty Ltd (Viva Energy) secured a contract with the Department of Defense to supply aviation, marine, and ground fuel to the Australian Defense Force (ADF). The Fuel Supply Contract is for an initial six-year term which may be extended to 12 years. As part of the deal and an essential Australian Industry Capability activity, Viva Energy is expected to resume production at Geelong Refinery of F-44 (Avcat) or JP-5, a military specification aviation turbine fuel used on aircraft carriers.
9. What pricing options are available for accessing the report?
Pricing options include single-user, multi-user, and enterprise licenses priced at USD 4750, USD 5250, and USD 8750 respectively.
10. Is the market size provided in terms of value or volume?
The market size is provided in terms of value, measured in Million and volume, measured in Litre.
11. Are there any specific market keywords associated with the report?
Yes, the market keyword associated with the report is "Military Jet Fuel Industry," which aids in identifying and referencing the specific market segment covered.
12. How do I determine which pricing option suits my needs best?
The pricing options vary based on user requirements and access needs. Individual users may opt for single-user licenses, while businesses requiring broader access may choose multi-user or enterprise licenses for cost-effective access to the report.
13. Are there any additional resources or data provided in the Military Jet Fuel Industry report?
While the report offers comprehensive insights, it's advisable to review the specific contents or supplementary materials provided to ascertain if additional resources or data are available.
14. How can I stay updated on further developments or reports in the Military Jet Fuel Industry?
To stay informed about further developments, trends, and reports in the Military Jet Fuel Industry, consider subscribing to industry newsletters, following relevant companies and organizations, or regularly checking reputable industry news sources and publications.
Methodology
Step 1 - Identification of Relevant Samples Size from Population Database


Step 2 - Approaches for Defining Global Market Size (Value, Volume* & Price*)

Note*: In applicable scenarios
Step 3 - Data Sources
Primary Research
- Web Analytics
- Survey Reports
- Research Institute
- Latest Research Reports
- Opinion Leaders
Secondary Research
- Annual Reports
- White Paper
- Latest Press Release
- Industry Association
- Paid Database
- Investor Presentations

Step 4 - Data Triangulation
Involves using different sources of information in order to increase the validity of a study
These sources are likely to be stakeholders in a program - participants, other researchers, program staff, other community members, and so on.
Then we put all data in single framework & apply various statistical tools to find out the dynamic on the market.
During the analysis stage, feedback from the stakeholder groups would be compared to determine areas of agreement as well as areas of divergence


