
Key Insights
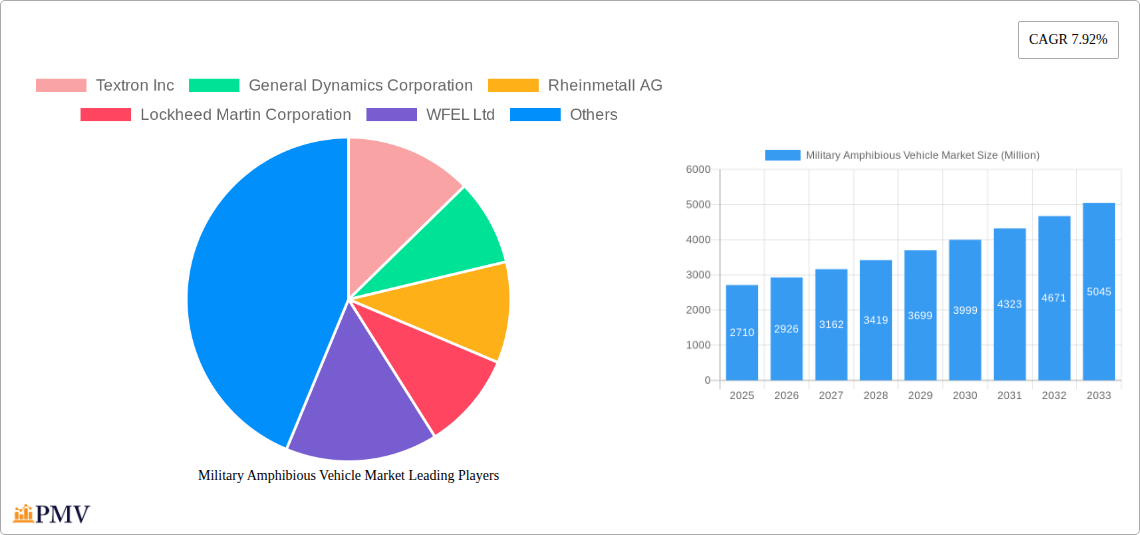
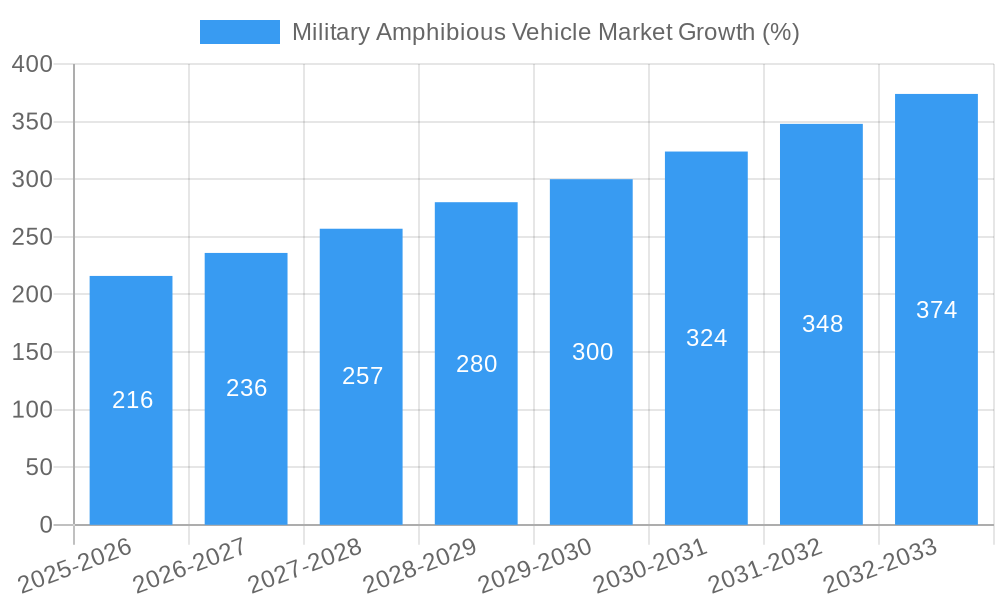
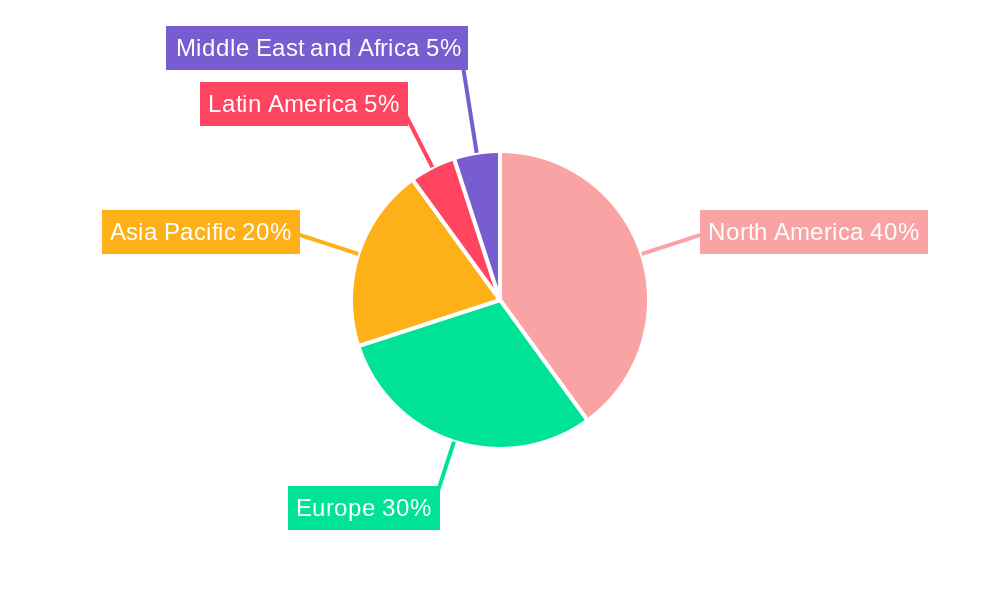
The global military amphibious vehicle market, valued at $2.71 billion in 2025, is projected to experience robust growth, driven by a 7.92% CAGR from 2025 to 2033. This expansion is fueled by increasing geopolitical instability, the need for versatile military platforms capable of operating in diverse terrains, and advancements in amphibious vehicle technology, including improved propulsion systems, enhanced armor protection, and increased payload capacity. Key market drivers include rising defense budgets in major global powers, modernization efforts of existing fleets, and the growing demand for specialized amphibious vehicles for coastal defense, riverine operations, and rapid deployment scenarios. The market is segmented into amphibious armored vehicles and hovercraft, each catering to specific operational requirements. North America currently holds a significant market share due to the presence of major defense contractors and substantial defense spending, but the Asia-Pacific region is expected to witness faster growth owing to escalating regional conflicts and increased military investment. Competition among established players like Textron, General Dynamics, Rheinmetall, and Lockheed Martin, alongside emerging players from regions like Asia, ensures a dynamic and innovative market landscape. However, the market faces restraints such as high acquisition costs, the need for specialized infrastructure, and technological complexities associated with amphibious vehicle design and maintenance.
The forecast period (2025-2033) anticipates a significant increase in market value, driven by continuous technological innovation and geopolitical factors. Growth will be particularly pronounced in regions experiencing rapid military modernization and facing diverse security challenges. The continued demand for enhanced operational capabilities, such as improved amphibious assault features, enhanced surveillance systems, and advanced communication technologies integrated into these vehicles, is projected to further fuel market growth. The shift towards lighter, more agile, and technologically superior amphibious vehicles will influence market dynamics, presenting opportunities for manufacturers focusing on innovation and strategic partnerships. Furthermore, the increasing focus on unmanned and autonomous amphibious vehicles is likely to create new market segments and contribute significantly to market expansion in the later years of the forecast period.
Military Amphibious Vehicle Market: A Comprehensive Report (2019-2033)
This in-depth report provides a comprehensive analysis of the Military Amphibious Vehicle Market, offering invaluable insights for industry stakeholders, investors, and strategic decision-makers. The study period spans from 2019 to 2033, with 2025 serving as the base and estimated year. The forecast period covers 2025-2033, while the historical period encompasses 2019-2024. The report meticulously examines market dynamics, competitive landscapes, and future growth trajectories, encompassing key segments like Amphibious Armored Vehicles and Hovercraft. The market size in 2025 is estimated at xx Million, poised for significant growth in the coming years.
Military Amphibious Vehicle Market Market Structure & Competitive Dynamics
The Military Amphibious Vehicle market exhibits a moderately concentrated structure, with key players such as Textron Inc., General Dynamics Corporation, and BAE Systems PLC holding significant market share. The market's competitive dynamics are shaped by factors like technological innovation, stringent regulatory frameworks, and the ongoing demand for advanced amphibious capabilities. The landscape is further influenced by the presence of both established defense contractors and emerging players from regions such as Asia-Pacific. Innovation ecosystems are crucial, driving the development of cutting-edge technologies like advanced propulsion systems and enhanced survivability features.
The market has witnessed notable M&A activity in recent years, with deal values exceeding xx Million in the period of 2021-2024. These transactions have resulted in market consolidation and the emergence of larger entities with expanded product portfolios. Product substitutes, while limited, include specialized land-based or airborne vehicles depending on operational requirements. End-user trends are shifting towards greater emphasis on modularity, adaptability, and enhanced protection against emerging threats.
- Market Concentration: Moderate, with top 5 players holding approximately xx% market share (2024).
- M&A Activity: xx Million in deal value (2021-2024), leading to market consolidation.
- Regulatory Framework: Stringent international and national regulations govern the development and deployment of military vehicles.
- Innovation Ecosystem: Focus on advanced materials, propulsion systems, and autonomous capabilities.
Military Amphibious Vehicle Market Industry Trends & Insights
The Military Amphibious Vehicle market is projected to experience a CAGR of xx% during the forecast period (2025-2033), driven by several key factors. Rising geopolitical tensions and the increasing demand for advanced military capabilities across various regions are contributing to market expansion. Technological advancements, such as the integration of unmanned systems and AI-powered functionalities, are further fueling growth. Growing investments in defense modernization programs by several countries, particularly in North America and Asia-Pacific, represent a significant market driver.
Consumer preferences are shifting towards vehicles with superior mobility, protection, and lethality. The market penetration of advanced amphibious vehicles remains relatively low, providing substantial opportunities for expansion, especially with the incorporation of improved amphibious technology to meet the needs of diverse military operations. The competitive dynamics are characterized by intense rivalry among major players, coupled with the emergence of niche players catering to specialized segments.
Dominant Markets & Segments in Military Amphibious Vehicle Market
The North American region currently dominates the Military Amphibious Vehicle market, driven by robust defense budgets, sustained technological advancements, and a large installed base of legacy systems. This regional dominance is further solidified by the presence of major defense contractors and a high concentration of defense-related industries within the region. Key factors underpinning this dominance include substantial government investment in research and development of advanced military technologies. This includes proactive adoption of cutting-edge technologies along with a long history of military operations and a robust defense manufacturing infrastructure.
Within the product segments, Amphibious Armored Vehicles command a larger market share compared to Hovercraft, primarily due to their versatility and wider range of applications.
- North American Dominance: High defense spending, technological innovation, and established defense industry.
- Amphibious Armored Vehicles: Higher market share due to versatility and extensive applications.
- Hovercraft Segment: Smaller market share, though experiencing growth in specific niche applications.
Military Amphibious Vehicle Market Product Innovations
Recent innovations in the Military Amphibious Vehicle market have centered on enhanced mobility, improved survivability, and advanced communication systems. The incorporation of lighter and more durable materials, such as advanced composites, is improving vehicle performance and reducing weight. The integration of autonomous capabilities and AI-powered decision-making systems are also enhancing operational efficiency and effectiveness. Manufacturers are focusing on developing vehicles that are highly adaptable to a wide range of terrains and operational conditions. The overall trend is toward greater modularity and interoperability to improve efficiency and reduce maintenance costs.
Report Segmentation & Scope
This report segments the Military Amphibious Vehicle market primarily by Type: Amphibious Armored Vehicles and Hovercraft.
Amphibious Armored Vehicles: This segment accounts for the largest share of the market, driven by high demand for versatile, protected platforms suitable for diverse military operations. The segment is further segmented by weight class, propulsion system, and armament. Market size is projected to reach xx Million by 2033, showing strong growth due to increasing demand from several countries.
Hovercraft: While representing a smaller segment compared to Armored Vehicles, this segment shows consistent growth, particularly for niche applications requiring high speed and shallow-water capabilities. Growth is expected due to increased investment in specialized operations. The market size is projected at xx Million by 2033.
Key Drivers of Military Amphibious Vehicle Market Growth
Several key factors are driving the growth of the Military Amphibious Vehicle market:
- Increased Defense Spending: Governments worldwide are increasing their defense budgets, boosting demand for advanced military equipment.
- Technological Advancements: Innovations in propulsion systems, materials science, and communication technologies are enhancing vehicle capabilities.
- Geopolitical Instability: Rising tensions and conflicts in various regions are driving the demand for improved military preparedness.
- Modernization Programs: Many countries are modernizing their armed forces, upgrading aging fleets with advanced amphibious vehicles.
Challenges in the Military Amphibious Vehicle Market Sector
The Military Amphibious Vehicle market faces certain challenges:
- High Development Costs: Developing and deploying advanced amphibious vehicles requires significant financial investment.
- Supply Chain Disruptions: Global supply chain issues can affect the production and delivery of key components.
- Stringent Regulations: Meeting regulatory requirements for safety and environmental compliance adds to the complexity of the industry.
- Intense Competition: The market is highly competitive, with numerous established and emerging players vying for market share.
Leading Players in the Military Amphibious Vehicle Market Market
- Textron Inc.
- General Dynamics Corporation
- Rheinmetall AG
- Lockheed Martin Corporation
- WFEL Ltd
- Griffon Hoverwork Ltd (GHL)
- Norinco Private Limited
- BAE Systems PLC
- Tata Motors Ltd
- Arquus
- Krauss-Maffei Wegmann GmbH & Co KG
- Oshkosh Corporation
Key Developments in Military Amphibious Vehicle Market Sector
- January 2023: BAE Systems launched a new generation of amphibious armored vehicle incorporating advanced protection systems.
- March 2024: General Dynamics announced a significant contract for the supply of amphibious vehicles to a major international customer.
- June 2024: Textron successfully completed sea trials for its latest amphibious vehicle prototype.
Strategic Military Amphibious Vehicle Market Market Outlook
The Military Amphibious Vehicle market is poised for continued growth, driven by evolving military strategies and technological advancements. The increasing adoption of unmanned and autonomous systems, alongside the focus on enhanced protection and interoperability, will shape the market landscape. Strategic opportunities lie in developing innovative solutions that address the evolving operational needs of armed forces worldwide. This includes focusing on modular designs, cost-effective production, and the integration of advanced technologies to maintain a competitive edge. The market holds considerable potential for growth and innovation, presenting significant opportunities for established players and new entrants alike.
Military Amphibious Vehicle Market Segmentation
-
1. Type
- 1.1. Amphibious Armored Vehicles
- 1.2. Hovercraft
Military Amphibious Vehicle Market Segmentation By Geography
-
1. North America
- 1.1. North America
- 1.2. Canada
-
2. Europe
- 2.1. United Kingdom
- 2.2. Germany
- 2.3. France
- 2.4. Russia
- 2.5. Rest of Europe
-
3. Asia Pacific
- 3.1. China
- 3.2. India
- 3.3. Japan
- 3.4. South Korea
- 3.5. Rest of Asia Pacific
-
4. Latin America
- 4.1. Brazil
- 4.2. Mexico
- 4.3. Rest of Latin America
-
5. Middle East and Africa
- 5.1. United Arab Emirates
- 5.2. Saudi Arabia
- 5.3. Qatar
- 5.4. South Africa
- 5.5. Rest of Middle East and Africa
Military Amphibious Vehicle Market REPORT HIGHLIGHTS
| Aspects | Details |
|---|---|
| Study Period | 2019-2033 |
| Base Year | 2024 |
| Estimated Year | 2025 |
| Forecast Period | 2025-2033 |
| Historical Period | 2019-2024 |
| Growth Rate | CAGR of 7.92% from 2019-2033 |
| Segmentation |
|
Table of Contents
- 1. Introduction
- 1.1. Research Scope
- 1.2. Market Segmentation
- 1.3. Research Methodology
- 1.4. Definitions and Assumptions
- 2. Executive Summary
- 2.1. Introduction
- 3. Market Dynamics
- 3.1. Introduction
- 3.2. Market Drivers
- 3.3. Market Restrains
- 3.4. Market Trends
- 3.4.1. The Amphibious Armored Vehicles Segment Dominates the Market During the Forecast Period
- 4. Market Factor Analysis
- 4.1. Porters Five Forces
- 4.2. Supply/Value Chain
- 4.3. PESTEL analysis
- 4.4. Market Entropy
- 4.5. Patent/Trademark Analysis
- 5. Global Military Amphibious Vehicle Market Analysis, Insights and Forecast, 2019-2031
- 5.1. Market Analysis, Insights and Forecast - by Type
- 5.1.1. Amphibious Armored Vehicles
- 5.1.2. Hovercraft
- 5.2. Market Analysis, Insights and Forecast - by Region
- 5.2.1. North America
- 5.2.2. Europe
- 5.2.3. Asia Pacific
- 5.2.4. Latin America
- 5.2.5. Middle East and Africa
- 5.1. Market Analysis, Insights and Forecast - by Type
- 6. North America Military Amphibious Vehicle Market Analysis, Insights and Forecast, 2019-2031
- 6.1. Market Analysis, Insights and Forecast - by Type
- 6.1.1. Amphibious Armored Vehicles
- 6.1.2. Hovercraft
- 6.1. Market Analysis, Insights and Forecast - by Type
- 7. Europe Military Amphibious Vehicle Market Analysis, Insights and Forecast, 2019-2031
- 7.1. Market Analysis, Insights and Forecast - by Type
- 7.1.1. Amphibious Armored Vehicles
- 7.1.2. Hovercraft
- 7.1. Market Analysis, Insights and Forecast - by Type
- 8. Asia Pacific Military Amphibious Vehicle Market Analysis, Insights and Forecast, 2019-2031
- 8.1. Market Analysis, Insights and Forecast - by Type
- 8.1.1. Amphibious Armored Vehicles
- 8.1.2. Hovercraft
- 8.1. Market Analysis, Insights and Forecast - by Type
- 9. Latin America Military Amphibious Vehicle Market Analysis, Insights and Forecast, 2019-2031
- 9.1. Market Analysis, Insights and Forecast - by Type
- 9.1.1. Amphibious Armored Vehicles
- 9.1.2. Hovercraft
- 9.1. Market Analysis, Insights and Forecast - by Type
- 10. Middle East and Africa Military Amphibious Vehicle Market Analysis, Insights and Forecast, 2019-2031
- 10.1. Market Analysis, Insights and Forecast - by Type
- 10.1.1. Amphibious Armored Vehicles
- 10.1.2. Hovercraft
- 10.1. Market Analysis, Insights and Forecast - by Type
- 11. North America Military Amphibious Vehicle Market Analysis, Insights and Forecast, 2019-2031
- 11.1. Market Analysis, Insights and Forecast - By Country/Sub-region
- 11.1.1 North America
- 11.1.2 Canada
- 12. Europe Military Amphibious Vehicle Market Analysis, Insights and Forecast, 2019-2031
- 12.1. Market Analysis, Insights and Forecast - By Country/Sub-region
- 12.1.1 United Kingdom
- 12.1.2 Germany
- 12.1.3 France
- 12.1.4 Russia
- 12.1.5 Rest of Europe
- 13. Asia Pacific Military Amphibious Vehicle Market Analysis, Insights and Forecast, 2019-2031
- 13.1. Market Analysis, Insights and Forecast - By Country/Sub-region
- 13.1.1 China
- 13.1.2 India
- 13.1.3 Japan
- 13.1.4 South Korea
- 13.1.5 Rest of Asia Pacific
- 14. Latin America Military Amphibious Vehicle Market Analysis, Insights and Forecast, 2019-2031
- 14.1. Market Analysis, Insights and Forecast - By Country/Sub-region
- 14.1.1 Brazil
- 14.1.2 Mexico
- 14.1.3 Rest of Latin America
- 15. Middle East and Africa Military Amphibious Vehicle Market Analysis, Insights and Forecast, 2019-2031
- 15.1. Market Analysis, Insights and Forecast - By Country/Sub-region
- 15.1.1 United Arab Emirates
- 15.1.2 Saudi Arabia
- 15.1.3 Qatar
- 15.1.4 South Africa
- 15.1.5 Rest of Middle East and Africa
- 16. Competitive Analysis
- 16.1. Global Market Share Analysis 2024
- 16.2. Company Profiles
- 16.2.1 Textron Inc
- 16.2.1.1. Overview
- 16.2.1.2. Products
- 16.2.1.3. SWOT Analysis
- 16.2.1.4. Recent Developments
- 16.2.1.5. Financials (Based on Availability)
- 16.2.2 General Dynamics Corporation
- 16.2.2.1. Overview
- 16.2.2.2. Products
- 16.2.2.3. SWOT Analysis
- 16.2.2.4. Recent Developments
- 16.2.2.5. Financials (Based on Availability)
- 16.2.3 Rheinmetall AG
- 16.2.3.1. Overview
- 16.2.3.2. Products
- 16.2.3.3. SWOT Analysis
- 16.2.3.4. Recent Developments
- 16.2.3.5. Financials (Based on Availability)
- 16.2.4 Lockheed Martin Corporation
- 16.2.4.1. Overview
- 16.2.4.2. Products
- 16.2.4.3. SWOT Analysis
- 16.2.4.4. Recent Developments
- 16.2.4.5. Financials (Based on Availability)
- 16.2.5 WFEL Ltd
- 16.2.5.1. Overview
- 16.2.5.2. Products
- 16.2.5.3. SWOT Analysis
- 16.2.5.4. Recent Developments
- 16.2.5.5. Financials (Based on Availability)
- 16.2.6 Griffon Hoverwork Ltd (GHL)
- 16.2.6.1. Overview
- 16.2.6.2. Products
- 16.2.6.3. SWOT Analysis
- 16.2.6.4. Recent Developments
- 16.2.6.5. Financials (Based on Availability)
- 16.2.7 Norinco Private Limited
- 16.2.7.1. Overview
- 16.2.7.2. Products
- 16.2.7.3. SWOT Analysis
- 16.2.7.4. Recent Developments
- 16.2.7.5. Financials (Based on Availability)
- 16.2.8 BAE Systems PLC
- 16.2.8.1. Overview
- 16.2.8.2. Products
- 16.2.8.3. SWOT Analysis
- 16.2.8.4. Recent Developments
- 16.2.8.5. Financials (Based on Availability)
- 16.2.9 Tata Motors Ltd
- 16.2.9.1. Overview
- 16.2.9.2. Products
- 16.2.9.3. SWOT Analysis
- 16.2.9.4. Recent Developments
- 16.2.9.5. Financials (Based on Availability)
- 16.2.10 Arquus
- 16.2.10.1. Overview
- 16.2.10.2. Products
- 16.2.10.3. SWOT Analysis
- 16.2.10.4. Recent Developments
- 16.2.10.5. Financials (Based on Availability)
- 16.2.11 Krauss-Maffei Wegmann GmbH & Co KG
- 16.2.11.1. Overview
- 16.2.11.2. Products
- 16.2.11.3. SWOT Analysis
- 16.2.11.4. Recent Developments
- 16.2.11.5. Financials (Based on Availability)
- 16.2.12 Oshkosh Corporatio
- 16.2.12.1. Overview
- 16.2.12.2. Products
- 16.2.12.3. SWOT Analysis
- 16.2.12.4. Recent Developments
- 16.2.12.5. Financials (Based on Availability)
- 16.2.1 Textron Inc
List of Figures
- Figure 1: Global Military Amphibious Vehicle Market Revenue Breakdown (Million, %) by Region 2024 & 2032
- Figure 2: North America Military Amphibious Vehicle Market Revenue (Million), by Country 2024 & 2032
- Figure 3: North America Military Amphibious Vehicle Market Revenue Share (%), by Country 2024 & 2032
- Figure 4: Europe Military Amphibious Vehicle Market Revenue (Million), by Country 2024 & 2032
- Figure 5: Europe Military Amphibious Vehicle Market Revenue Share (%), by Country 2024 & 2032
- Figure 6: Asia Pacific Military Amphibious Vehicle Market Revenue (Million), by Country 2024 & 2032
- Figure 7: Asia Pacific Military Amphibious Vehicle Market Revenue Share (%), by Country 2024 & 2032
- Figure 8: Latin America Military Amphibious Vehicle Market Revenue (Million), by Country 2024 & 2032
- Figure 9: Latin America Military Amphibious Vehicle Market Revenue Share (%), by Country 2024 & 2032
- Figure 10: Middle East and Africa Military Amphibious Vehicle Market Revenue (Million), by Country 2024 & 2032
- Figure 11: Middle East and Africa Military Amphibious Vehicle Market Revenue Share (%), by Country 2024 & 2032
- Figure 12: North America Military Amphibious Vehicle Market Revenue (Million), by Type 2024 & 2032
- Figure 13: North America Military Amphibious Vehicle Market Revenue Share (%), by Type 2024 & 2032
- Figure 14: North America Military Amphibious Vehicle Market Revenue (Million), by Country 2024 & 2032
- Figure 15: North America Military Amphibious Vehicle Market Revenue Share (%), by Country 2024 & 2032
- Figure 16: Europe Military Amphibious Vehicle Market Revenue (Million), by Type 2024 & 2032
- Figure 17: Europe Military Amphibious Vehicle Market Revenue Share (%), by Type 2024 & 2032
- Figure 18: Europe Military Amphibious Vehicle Market Revenue (Million), by Country 2024 & 2032
- Figure 19: Europe Military Amphibious Vehicle Market Revenue Share (%), by Country 2024 & 2032
- Figure 20: Asia Pacific Military Amphibious Vehicle Market Revenue (Million), by Type 2024 & 2032
- Figure 21: Asia Pacific Military Amphibious Vehicle Market Revenue Share (%), by Type 2024 & 2032
- Figure 22: Asia Pacific Military Amphibious Vehicle Market Revenue (Million), by Country 2024 & 2032
- Figure 23: Asia Pacific Military Amphibious Vehicle Market Revenue Share (%), by Country 2024 & 2032
- Figure 24: Latin America Military Amphibious Vehicle Market Revenue (Million), by Type 2024 & 2032
- Figure 25: Latin America Military Amphibious Vehicle Market Revenue Share (%), by Type 2024 & 2032
- Figure 26: Latin America Military Amphibious Vehicle Market Revenue (Million), by Country 2024 & 2032
- Figure 27: Latin America Military Amphibious Vehicle Market Revenue Share (%), by Country 2024 & 2032
- Figure 28: Middle East and Africa Military Amphibious Vehicle Market Revenue (Million), by Type 2024 & 2032
- Figure 29: Middle East and Africa Military Amphibious Vehicle Market Revenue Share (%), by Type 2024 & 2032
- Figure 30: Middle East and Africa Military Amphibious Vehicle Market Revenue (Million), by Country 2024 & 2032
- Figure 31: Middle East and Africa Military Amphibious Vehicle Market Revenue Share (%), by Country 2024 & 2032
List of Tables
- Table 1: Global Military Amphibious Vehicle Market Revenue Million Forecast, by Region 2019 & 2032
- Table 2: Global Military Amphibious Vehicle Market Revenue Million Forecast, by Type 2019 & 2032
- Table 3: Global Military Amphibious Vehicle Market Revenue Million Forecast, by Region 2019 & 2032
- Table 4: Global Military Amphibious Vehicle Market Revenue Million Forecast, by Country 2019 & 2032
- Table 5: North America Military Amphibious Vehicle Market Revenue (Million) Forecast, by Application 2019 & 2032
- Table 6: Canada Military Amphibious Vehicle Market Revenue (Million) Forecast, by Application 2019 & 2032
- Table 7: Global Military Amphibious Vehicle Market Revenue Million Forecast, by Country 2019 & 2032
- Table 8: United Kingdom Military Amphibious Vehicle Market Revenue (Million) Forecast, by Application 2019 & 2032
- Table 9: Germany Military Amphibious Vehicle Market Revenue (Million) Forecast, by Application 2019 & 2032
- Table 10: France Military Amphibious Vehicle Market Revenue (Million) Forecast, by Application 2019 & 2032
- Table 11: Russia Military Amphibious Vehicle Market Revenue (Million) Forecast, by Application 2019 & 2032
- Table 12: Rest of Europe Military Amphibious Vehicle Market Revenue (Million) Forecast, by Application 2019 & 2032
- Table 13: Global Military Amphibious Vehicle Market Revenue Million Forecast, by Country 2019 & 2032
- Table 14: China Military Amphibious Vehicle Market Revenue (Million) Forecast, by Application 2019 & 2032
- Table 15: India Military Amphibious Vehicle Market Revenue (Million) Forecast, by Application 2019 & 2032
- Table 16: Japan Military Amphibious Vehicle Market Revenue (Million) Forecast, by Application 2019 & 2032
- Table 17: South Korea Military Amphibious Vehicle Market Revenue (Million) Forecast, by Application 2019 & 2032
- Table 18: Rest of Asia Pacific Military Amphibious Vehicle Market Revenue (Million) Forecast, by Application 2019 & 2032
- Table 19: Global Military Amphibious Vehicle Market Revenue Million Forecast, by Country 2019 & 2032
- Table 20: Brazil Military Amphibious Vehicle Market Revenue (Million) Forecast, by Application 2019 & 2032
- Table 21: Mexico Military Amphibious Vehicle Market Revenue (Million) Forecast, by Application 2019 & 2032
- Table 22: Rest of Latin America Military Amphibious Vehicle Market Revenue (Million) Forecast, by Application 2019 & 2032
- Table 23: Global Military Amphibious Vehicle Market Revenue Million Forecast, by Country 2019 & 2032
- Table 24: United Arab Emirates Military Amphibious Vehicle Market Revenue (Million) Forecast, by Application 2019 & 2032
- Table 25: Saudi Arabia Military Amphibious Vehicle Market Revenue (Million) Forecast, by Application 2019 & 2032
- Table 26: Qatar Military Amphibious Vehicle Market Revenue (Million) Forecast, by Application 2019 & 2032
- Table 27: South Africa Military Amphibious Vehicle Market Revenue (Million) Forecast, by Application 2019 & 2032
- Table 28: Rest of Middle East and Africa Military Amphibious Vehicle Market Revenue (Million) Forecast, by Application 2019 & 2032
- Table 29: Global Military Amphibious Vehicle Market Revenue Million Forecast, by Type 2019 & 2032
- Table 30: Global Military Amphibious Vehicle Market Revenue Million Forecast, by Country 2019 & 2032
- Table 31: North America Military Amphibious Vehicle Market Revenue (Million) Forecast, by Application 2019 & 2032
- Table 32: Canada Military Amphibious Vehicle Market Revenue (Million) Forecast, by Application 2019 & 2032
- Table 33: Global Military Amphibious Vehicle Market Revenue Million Forecast, by Type 2019 & 2032
- Table 34: Global Military Amphibious Vehicle Market Revenue Million Forecast, by Country 2019 & 2032
- Table 35: United Kingdom Military Amphibious Vehicle Market Revenue (Million) Forecast, by Application 2019 & 2032
- Table 36: Germany Military Amphibious Vehicle Market Revenue (Million) Forecast, by Application 2019 & 2032
- Table 37: France Military Amphibious Vehicle Market Revenue (Million) Forecast, by Application 2019 & 2032
- Table 38: Russia Military Amphibious Vehicle Market Revenue (Million) Forecast, by Application 2019 & 2032
- Table 39: Rest of Europe Military Amphibious Vehicle Market Revenue (Million) Forecast, by Application 2019 & 2032
- Table 40: Global Military Amphibious Vehicle Market Revenue Million Forecast, by Type 2019 & 2032
- Table 41: Global Military Amphibious Vehicle Market Revenue Million Forecast, by Country 2019 & 2032
- Table 42: China Military Amphibious Vehicle Market Revenue (Million) Forecast, by Application 2019 & 2032
- Table 43: India Military Amphibious Vehicle Market Revenue (Million) Forecast, by Application 2019 & 2032
- Table 44: Japan Military Amphibious Vehicle Market Revenue (Million) Forecast, by Application 2019 & 2032
- Table 45: South Korea Military Amphibious Vehicle Market Revenue (Million) Forecast, by Application 2019 & 2032
- Table 46: Rest of Asia Pacific Military Amphibious Vehicle Market Revenue (Million) Forecast, by Application 2019 & 2032
- Table 47: Global Military Amphibious Vehicle Market Revenue Million Forecast, by Type 2019 & 2032
- Table 48: Global Military Amphibious Vehicle Market Revenue Million Forecast, by Country 2019 & 2032
- Table 49: Brazil Military Amphibious Vehicle Market Revenue (Million) Forecast, by Application 2019 & 2032
- Table 50: Mexico Military Amphibious Vehicle Market Revenue (Million) Forecast, by Application 2019 & 2032
- Table 51: Rest of Latin America Military Amphibious Vehicle Market Revenue (Million) Forecast, by Application 2019 & 2032
- Table 52: Global Military Amphibious Vehicle Market Revenue Million Forecast, by Type 2019 & 2032
- Table 53: Global Military Amphibious Vehicle Market Revenue Million Forecast, by Country 2019 & 2032
- Table 54: United Arab Emirates Military Amphibious Vehicle Market Revenue (Million) Forecast, by Application 2019 & 2032
- Table 55: Saudi Arabia Military Amphibious Vehicle Market Revenue (Million) Forecast, by Application 2019 & 2032
- Table 56: Qatar Military Amphibious Vehicle Market Revenue (Million) Forecast, by Application 2019 & 2032
- Table 57: South Africa Military Amphibious Vehicle Market Revenue (Million) Forecast, by Application 2019 & 2032
- Table 58: Rest of Middle East and Africa Military Amphibious Vehicle Market Revenue (Million) Forecast, by Application 2019 & 2032
Frequently Asked Questions
1. What is the projected Compound Annual Growth Rate (CAGR) of the Military Amphibious Vehicle Market?
The projected CAGR is approximately 7.92%.
2. Which companies are prominent players in the Military Amphibious Vehicle Market?
Key companies in the market include Textron Inc, General Dynamics Corporation, Rheinmetall AG, Lockheed Martin Corporation, WFEL Ltd, Griffon Hoverwork Ltd (GHL), Norinco Private Limited, BAE Systems PLC, Tata Motors Ltd, Arquus, Krauss-Maffei Wegmann GmbH & Co KG, Oshkosh Corporatio.
3. What are the main segments of the Military Amphibious Vehicle Market?
The market segments include Type.
4. Can you provide details about the market size?
The market size is estimated to be USD 2.71 Million as of 2022.
5. What are some drivers contributing to market growth?
N/A
6. What are the notable trends driving market growth?
The Amphibious Armored Vehicles Segment Dominates the Market During the Forecast Period.
7. Are there any restraints impacting market growth?
N/A
8. Can you provide examples of recent developments in the market?
N/A
9. What pricing options are available for accessing the report?
Pricing options include single-user, multi-user, and enterprise licenses priced at USD 4750, USD 5250, and USD 8750 respectively.
10. Is the market size provided in terms of value or volume?
The market size is provided in terms of value, measured in Million.
11. Are there any specific market keywords associated with the report?
Yes, the market keyword associated with the report is "Military Amphibious Vehicle Market," which aids in identifying and referencing the specific market segment covered.
12. How do I determine which pricing option suits my needs best?
The pricing options vary based on user requirements and access needs. Individual users may opt for single-user licenses, while businesses requiring broader access may choose multi-user or enterprise licenses for cost-effective access to the report.
13. Are there any additional resources or data provided in the Military Amphibious Vehicle Market report?
While the report offers comprehensive insights, it's advisable to review the specific contents or supplementary materials provided to ascertain if additional resources or data are available.
14. How can I stay updated on further developments or reports in the Military Amphibious Vehicle Market?
To stay informed about further developments, trends, and reports in the Military Amphibious Vehicle Market, consider subscribing to industry newsletters, following relevant companies and organizations, or regularly checking reputable industry news sources and publications.
Methodology
Step 1 - Identification of Relevant Samples Size from Population Database


Step 2 - Approaches for Defining Global Market Size (Value, Volume* & Price*)

Note*: In applicable scenarios
Step 3 - Data Sources
Primary Research
- Web Analytics
- Survey Reports
- Research Institute
- Latest Research Reports
- Opinion Leaders
Secondary Research
- Annual Reports
- White Paper
- Latest Press Release
- Industry Association
- Paid Database
- Investor Presentations

Step 4 - Data Triangulation
Involves using different sources of information in order to increase the validity of a study
These sources are likely to be stakeholders in a program - participants, other researchers, program staff, other community members, and so on.
Then we put all data in single framework & apply various statistical tools to find out the dynamic on the market.
During the analysis stage, feedback from the stakeholder groups would be compared to determine areas of agreement as well as areas of divergence


