
Key Insights
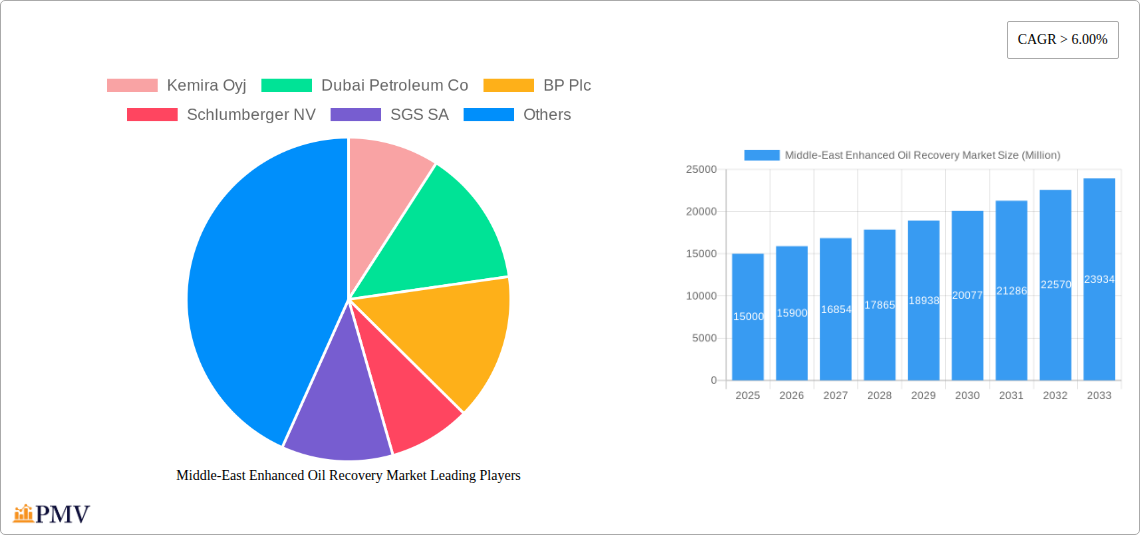
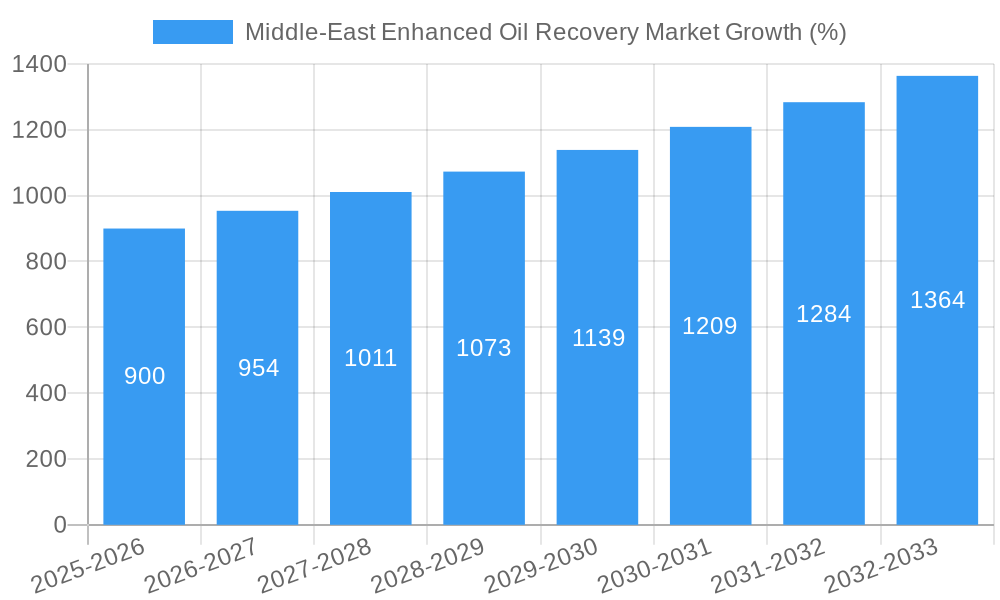
The Middle East Enhanced Oil Recovery (EOR) market, currently experiencing robust growth, is projected to maintain a Compound Annual Growth Rate (CAGR) exceeding 6% from 2025 to 2033. This expansion is fueled by several key drivers. Firstly, the region's significant oil reserves necessitate EOR techniques to maximize extraction from mature fields, extending their productive lifespan and mitigating declining production rates. Secondly, rising global energy demand coupled with geopolitical instability creates a compelling need for enhanced domestic production capabilities within the Middle East. The increasing adoption of advanced EOR technologies, including thermal, gas injection, and chemical injection methods, further contributes to market growth. Finally, substantial government investments in oil and gas infrastructure and exploration projects actively stimulate EOR adoption. Major players like Saudi Aramco, ADNOC, and international giants such as Schlumberger and BP are actively involved, driving technological innovation and market expansion.
However, the market faces challenges. Fluctuations in global oil prices can significantly impact investment decisions and EOR project viability. Furthermore, the high capital expenditure associated with implementing EOR techniques, particularly for large-scale projects, can pose a barrier to entry for some operators. Environmental concerns surrounding EOR methods, particularly regarding water usage and potential greenhouse gas emissions, necessitate careful consideration and the development of environmentally sustainable practices. Despite these constraints, the long-term outlook for the Middle East EOR market remains positive, driven by the region's strategic importance in global energy markets and the continuous need for enhanced oil extraction technologies. The market segmentation, with thermal, gas injection, and chemical injection techniques, offers diversified growth opportunities for various stakeholders, showcasing a promising outlook for the next decade.
Middle-East Enhanced Oil Recovery (EOR) Market: A Comprehensive Report (2019-2033)
This in-depth report provides a comprehensive analysis of the Middle-East Enhanced Oil Recovery (EOR) market, offering invaluable insights for industry stakeholders, investors, and strategic decision-makers. The study period covers 2019-2033, with 2025 serving as the base and estimated year. The forecast period spans from 2025 to 2033, while the historical period encompasses 2019-2024. The report analyzes market dynamics, competitive landscape, technological advancements, and future growth potential, focusing on key segments like Thermal, Gas Injection, and Chemical Injection techniques. The market size is projected to reach xx Million by 2033, exhibiting a CAGR of xx% during the forecast period.
Middle-East Enhanced Oil Recovery Market Structure & Competitive Dynamics
This section delves into the competitive landscape of the Middle East EOR market, examining market concentration, innovation ecosystems, regulatory frameworks, product substitutes, end-user trends, and M&A activities. We analyze the market share of key players, including Kemira Oyj, Dubai Petroleum Co, BP Plc, Schlumberger NV, SGS SA, Linde Plc, Saudi Aramco, China National Offshore Oil Corporation, Abu Dhabi National Oil Company (ADNOC), and Petroleum Development Oman. The market exhibits a moderately concentrated structure, with a few major international players and several regional operators holding significant market share.
- Market Concentration: The Herfindahl-Hirschman Index (HHI) is estimated at xx, indicating a moderately concentrated market.
- Innovation Ecosystems: Significant investments in R&D by major players and government initiatives are driving innovation in EOR technologies.
- Regulatory Frameworks: Government policies promoting energy security and diversification are influencing market growth.
- Product Substitutes: Limited substitutes exist for EOR techniques in mature oil fields.
- End-User Trends: Increased demand for oil and gas from rapidly growing economies in the region is a significant driver.
- M&A Activities: The report analyzes recent mergers and acquisitions, with estimated deal values totaling xx Million in the last five years.
Middle-East Enhanced Oil Recovery Market Industry Trends & Insights
This section provides a detailed analysis of the major trends shaping the Middle East EOR market. We examine market growth drivers, technological disruptions, consumer preferences, and competitive dynamics. The market is experiencing significant growth driven by several factors, including the increasing depletion of conventional oil reserves, government initiatives to enhance oil recovery rates, technological advancements in EOR techniques, and rising global oil demand. The chemical injection segment is predicted to dominate the market owing to its versatility and effectiveness in various reservoir types.
The increasing adoption of carbon capture, utilization, and storage (CCUS) technologies, along with the growing focus on environmental sustainability, is significantly impacting market growth. Furthermore, the region's vast reserves of unconventional oil and gas are also contributing to the expansion of the EOR market. The projected CAGR for the overall market during the forecast period is xx%, with variations across different EOR techniques. Market penetration of advanced EOR technologies, such as CO2 injection, is expected to increase significantly in the coming years.
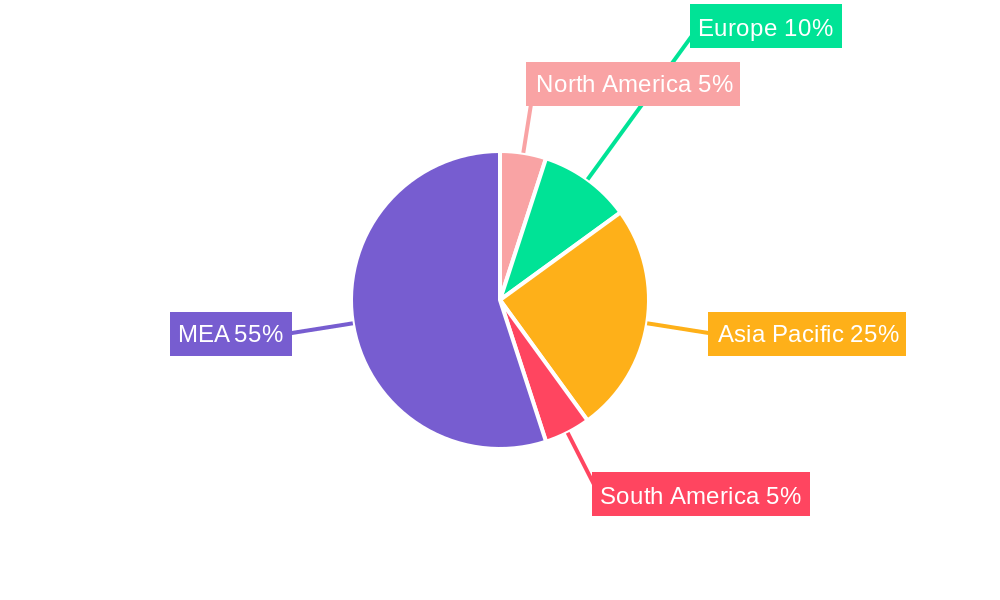
Dominant Markets & Segments in Middle-East Enhanced Oil Recovery Market
The Middle East EOR market is geographically diverse, with significant activity across several countries, including Saudi Arabia, the United Arab Emirates, Oman, and Qatar. Saudi Arabia holds the largest market share due to its substantial oil reserves and significant investments in EOR projects. The chemical injection segment shows strong dominance, capturing the largest market share due to its high efficiency and applicability across various reservoir conditions. Thermal methods are also gaining traction, particularly in heavy oil fields.
- Key Drivers for Saudi Arabia's Dominance:
- Extensive oil reserves.
- Substantial government investments in EOR technologies.
- Favorable regulatory environment.
- Well-developed oil and gas infrastructure.
- Key Drivers for Chemical Injection Segment Dominance:
- Versatility across various reservoir types.
- High oil recovery efficiency.
- Continued technological advancements.
- Relatively lower costs compared to other techniques in certain applications.
Middle-East Enhanced Oil Recovery Market Product Innovations
Recent years have witnessed significant advancements in EOR technologies, particularly in chemical injection techniques. Nanotechnology-enhanced chemicals are improving oil recovery efficiency, while advanced monitoring and control systems are optimizing EOR operations. The adoption of digital technologies, including artificial intelligence (AI) and machine learning (ML), is improving reservoir characterization and optimizing EOR processes. These innovations are enhancing the efficiency and effectiveness of EOR operations, leading to increased oil recovery rates and reduced operational costs. The market is also seeing a rise in the development of environmentally friendly EOR chemicals to address growing sustainability concerns.
Report Segmentation & Scope
This report segments the Middle East EOR market based on EOR techniques:
Thermal EOR: This segment encompasses steam injection, in-situ combustion, and other thermal recovery methods. Growth is projected to be driven by the increasing exploitation of heavy oil reserves. The market is characterized by intense competition among established players and emerging technology providers.
Gas Injection EOR: This segment includes miscible and immiscible gas injection techniques, primarily utilizing natural gas or CO2. Growth is driven by the increasing availability of CO2 from industrial sources and government incentives for CCUS projects. Competitive dynamics are shaped by the availability of gas resources and the development of efficient CO2 capture and transport infrastructure.
Chemical Injection EOR: This segment involves the injection of various chemicals to improve oil mobility and recovery. The market is experiencing robust growth due to advancements in chemical formulations and the development of enhanced chemical injection techniques. The competitive landscape is characterized by specialized chemical suppliers and service providers.
Key Drivers of Middle-East Enhanced Oil Recovery Market Growth
The growth of the Middle East EOR market is driven by a confluence of factors, including the depletion of conventional oil reserves, rising global oil demand, government initiatives to enhance domestic oil production, and ongoing technological advancements in EOR technologies. The region's significant investment in infrastructure development also contributes to market growth. Furthermore, the growing adoption of sustainable EOR practices, such as CCUS, is further bolstering market expansion. The increasing focus on energy security and the need to maximize oil recovery from existing fields are major drivers.
Challenges in the Middle-East Enhanced Oil Recovery Market Sector
Despite the significant growth potential, the Middle East EOR market faces several challenges. High capital expenditure requirements for implementing EOR projects, the complexity of reservoir conditions, the availability of suitable EOR chemicals, and stringent environmental regulations are significant hurdles. Furthermore, geopolitical instability in certain regions and the volatility of oil prices can impact investment decisions. The need for skilled labor and the development of efficient supply chains also pose challenges to market expansion.
Leading Players in the Middle-East Enhanced Oil Recovery Market Market
- Kemira Oyj
- Dubai Petroleum Co
- BP Plc
- Schlumberger NV
- SGS SA
- Linde Plc
- Saudi Aramco
- China National Offshore Oil Corporation
- Abu Dhabi National Oil Company (ADNOC)
- Petroleum Development Oman
Key Developments in Middle-East Enhanced Oil Recovery Market Sector
November 2021: Qatar Petroleum partnered with Axens (an IFP group company) on a CO2 dehydration project for upcoming EOR and CO2 sequestration projects. Medgulf Construction was selected as the EPC contractor. This signifies a growing commitment to CCUS technologies.
2019: ADNOC outlined a plan to position the UAE among the top four countries globally in CCUS EOR projects by 2025. The company secured gas output from the Shah-Ultra Sour Gas Plant (for CO2) and the Habshan and Bab gas fields to support this initiative. This highlights the strategic importance of CCUS in the UAE's EOR strategy.
Strategic Middle-East Enhanced Oil Recovery Market Outlook
The Middle East EOR market is poised for significant growth over the next decade, driven by sustained oil demand, the need to maximize oil recovery from mature fields, and continuous technological innovations. Strategic opportunities exist for companies involved in chemical supply, EOR services, and CCUS technologies. Investments in R&D, partnerships to leverage expertise, and a focus on sustainable practices will be crucial for success. The market is expected to witness a consolidation trend, with larger players acquiring smaller companies to gain market share and technological capabilities.
Middle-East Enhanced Oil Recovery Market Segmentation
-
1. Technique
- 1.1. Thermal
- 1.2. Gas Injection
- 1.3. Chemical Injection
-
2. Geography
- 2.1. Oman
- 2.2. United Arab Emirates
- 2.3. Qatar
- 2.4. Rest of Middle-East
Middle-East Enhanced Oil Recovery Market Segmentation By Geography
- 1. Oman
- 2. United Arab Emirates
- 3. Qatar
- 4. Rest of Middle East
Middle-East Enhanced Oil Recovery Market REPORT HIGHLIGHTS
| Aspects | Details |
|---|---|
| Study Period | 2019-2033 |
| Base Year | 2024 |
| Estimated Year | 2025 |
| Forecast Period | 2025-2033 |
| Historical Period | 2019-2024 |
| Growth Rate | CAGR of > 6.00% from 2019-2033 |
| Segmentation |
|
Table of Contents
- 1. Introduction
- 1.1. Research Scope
- 1.2. Market Segmentation
- 1.3. Research Methodology
- 1.4. Definitions and Assumptions
- 2. Executive Summary
- 2.1. Introduction
- 3. Market Dynamics
- 3.1. Introduction
- 3.2. Market Drivers
- 3.2.1 4.; Recovering Number of Air Passengers
- 3.2.2 on Account of the Cheaper Airfare in Recent Times4.; Increasing Disposable Income of Population
- 3.3. Market Restrains
- 3.3.1. 4.; High Share of Fossil-Fuel-Based Aviation Fuels in South American Countries
- 3.4. Market Trends
- 3.4.1. Gas Injection Expected to Witness Significant Growth
- 4. Market Factor Analysis
- 4.1. Porters Five Forces
- 4.2. Supply/Value Chain
- 4.3. PESTEL analysis
- 4.4. Market Entropy
- 4.5. Patent/Trademark Analysis
- 5. Global Middle-East Enhanced Oil Recovery Market Analysis, Insights and Forecast, 2019-2031
- 5.1. Market Analysis, Insights and Forecast - by Technique
- 5.1.1. Thermal
- 5.1.2. Gas Injection
- 5.1.3. Chemical Injection
- 5.2. Market Analysis, Insights and Forecast - by Geography
- 5.2.1. Oman
- 5.2.2. United Arab Emirates
- 5.2.3. Qatar
- 5.2.4. Rest of Middle-East
- 5.3. Market Analysis, Insights and Forecast - by Region
- 5.3.1. Oman
- 5.3.2. United Arab Emirates
- 5.3.3. Qatar
- 5.3.4. Rest of Middle East
- 5.1. Market Analysis, Insights and Forecast - by Technique
- 6. Oman Middle-East Enhanced Oil Recovery Market Analysis, Insights and Forecast, 2019-2031
- 6.1. Market Analysis, Insights and Forecast - by Technique
- 6.1.1. Thermal
- 6.1.2. Gas Injection
- 6.1.3. Chemical Injection
- 6.2. Market Analysis, Insights and Forecast - by Geography
- 6.2.1. Oman
- 6.2.2. United Arab Emirates
- 6.2.3. Qatar
- 6.2.4. Rest of Middle-East
- 6.1. Market Analysis, Insights and Forecast - by Technique
- 7. United Arab Emirates Middle-East Enhanced Oil Recovery Market Analysis, Insights and Forecast, 2019-2031
- 7.1. Market Analysis, Insights and Forecast - by Technique
- 7.1.1. Thermal
- 7.1.2. Gas Injection
- 7.1.3. Chemical Injection
- 7.2. Market Analysis, Insights and Forecast - by Geography
- 7.2.1. Oman
- 7.2.2. United Arab Emirates
- 7.2.3. Qatar
- 7.2.4. Rest of Middle-East
- 7.1. Market Analysis, Insights and Forecast - by Technique
- 8. Qatar Middle-East Enhanced Oil Recovery Market Analysis, Insights and Forecast, 2019-2031
- 8.1. Market Analysis, Insights and Forecast - by Technique
- 8.1.1. Thermal
- 8.1.2. Gas Injection
- 8.1.3. Chemical Injection
- 8.2. Market Analysis, Insights and Forecast - by Geography
- 8.2.1. Oman
- 8.2.2. United Arab Emirates
- 8.2.3. Qatar
- 8.2.4. Rest of Middle-East
- 8.1. Market Analysis, Insights and Forecast - by Technique
- 9. Rest of Middle East Middle-East Enhanced Oil Recovery Market Analysis, Insights and Forecast, 2019-2031
- 9.1. Market Analysis, Insights and Forecast - by Technique
- 9.1.1. Thermal
- 9.1.2. Gas Injection
- 9.1.3. Chemical Injection
- 9.2. Market Analysis, Insights and Forecast - by Geography
- 9.2.1. Oman
- 9.2.2. United Arab Emirates
- 9.2.3. Qatar
- 9.2.4. Rest of Middle-East
- 9.1. Market Analysis, Insights and Forecast - by Technique
- 10. North America Middle-East Enhanced Oil Recovery Market Analysis, Insights and Forecast, 2019-2031
- 10.1. Market Analysis, Insights and Forecast - By Country/Sub-region
- 10.1.1 United States
- 10.1.2 Canada
- 10.1.3 Mexico
- 11. Europe Middle-East Enhanced Oil Recovery Market Analysis, Insights and Forecast, 2019-2031
- 11.1. Market Analysis, Insights and Forecast - By Country/Sub-region
- 11.1.1 Germany
- 11.1.2 United Kingdom
- 11.1.3 France
- 11.1.4 Spain
- 11.1.5 Italy
- 11.1.6 Spain
- 11.1.7 Belgium
- 11.1.8 Netherland
- 11.1.9 Nordics
- 11.1.10 Rest of Europe
- 12. Asia Pacific Middle-East Enhanced Oil Recovery Market Analysis, Insights and Forecast, 2019-2031
- 12.1. Market Analysis, Insights and Forecast - By Country/Sub-region
- 12.1.1 China
- 12.1.2 Japan
- 12.1.3 India
- 12.1.4 South Korea
- 12.1.5 Southeast Asia
- 12.1.6 Australia
- 12.1.7 Indonesia
- 12.1.8 Phillipes
- 12.1.9 Singapore
- 12.1.10 Thailandc
- 12.1.11 Rest of Asia Pacific
- 13. South America Middle-East Enhanced Oil Recovery Market Analysis, Insights and Forecast, 2019-2031
- 13.1. Market Analysis, Insights and Forecast - By Country/Sub-region
- 13.1.1 Brazil
- 13.1.2 Argentina
- 13.1.3 Peru
- 13.1.4 Chile
- 13.1.5 Colombia
- 13.1.6 Ecuador
- 13.1.7 Venezuela
- 13.1.8 Rest of South America
- 14. MEA Middle-East Enhanced Oil Recovery Market Analysis, Insights and Forecast, 2019-2031
- 14.1. Market Analysis, Insights and Forecast - By Country/Sub-region
- 14.1.1 United Arab Emirates
- 14.1.2 Saudi Arabia
- 14.1.3 South Africa
- 14.1.4 Rest of Middle East and Africa
- 15. Competitive Analysis
- 15.1. Global Market Share Analysis 2024
- 15.2. Company Profiles
- 15.2.1 Kemira Oyj
- 15.2.1.1. Overview
- 15.2.1.2. Products
- 15.2.1.3. SWOT Analysis
- 15.2.1.4. Recent Developments
- 15.2.1.5. Financials (Based on Availability)
- 15.2.2 Dubai Petroleum Co
- 15.2.2.1. Overview
- 15.2.2.2. Products
- 15.2.2.3. SWOT Analysis
- 15.2.2.4. Recent Developments
- 15.2.2.5. Financials (Based on Availability)
- 15.2.3 BP Plc
- 15.2.3.1. Overview
- 15.2.3.2. Products
- 15.2.3.3. SWOT Analysis
- 15.2.3.4. Recent Developments
- 15.2.3.5. Financials (Based on Availability)
- 15.2.4 Schlumberger NV
- 15.2.4.1. Overview
- 15.2.4.2. Products
- 15.2.4.3. SWOT Analysis
- 15.2.4.4. Recent Developments
- 15.2.4.5. Financials (Based on Availability)
- 15.2.5 SGS SA
- 15.2.5.1. Overview
- 15.2.5.2. Products
- 15.2.5.3. SWOT Analysis
- 15.2.5.4. Recent Developments
- 15.2.5.5. Financials (Based on Availability)
- 15.2.6 Linde Plc*List Not Exhaustive
- 15.2.6.1. Overview
- 15.2.6.2. Products
- 15.2.6.3. SWOT Analysis
- 15.2.6.4. Recent Developments
- 15.2.6.5. Financials (Based on Availability)
- 15.2.7 Saudi Aramco
- 15.2.7.1. Overview
- 15.2.7.2. Products
- 15.2.7.3. SWOT Analysis
- 15.2.7.4. Recent Developments
- 15.2.7.5. Financials (Based on Availability)
- 15.2.8 China National Offshore Oil Corporation
- 15.2.8.1. Overview
- 15.2.8.2. Products
- 15.2.8.3. SWOT Analysis
- 15.2.8.4. Recent Developments
- 15.2.8.5. Financials (Based on Availability)
- 15.2.9 Abu Dhabi National Oil Company (ADNOC)
- 15.2.9.1. Overview
- 15.2.9.2. Products
- 15.2.9.3. SWOT Analysis
- 15.2.9.4. Recent Developments
- 15.2.9.5. Financials (Based on Availability)
- 15.2.10 Petroleum Development Oman
- 15.2.10.1. Overview
- 15.2.10.2. Products
- 15.2.10.3. SWOT Analysis
- 15.2.10.4. Recent Developments
- 15.2.10.5. Financials (Based on Availability)
- 15.2.1 Kemira Oyj
List of Figures
- Figure 1: Global Middle-East Enhanced Oil Recovery Market Revenue Breakdown (Million, %) by Region 2024 & 2032
- Figure 2: North America Middle-East Enhanced Oil Recovery Market Revenue (Million), by Country 2024 & 2032
- Figure 3: North America Middle-East Enhanced Oil Recovery Market Revenue Share (%), by Country 2024 & 2032
- Figure 4: Europe Middle-East Enhanced Oil Recovery Market Revenue (Million), by Country 2024 & 2032
- Figure 5: Europe Middle-East Enhanced Oil Recovery Market Revenue Share (%), by Country 2024 & 2032
- Figure 6: Asia Pacific Middle-East Enhanced Oil Recovery Market Revenue (Million), by Country 2024 & 2032
- Figure 7: Asia Pacific Middle-East Enhanced Oil Recovery Market Revenue Share (%), by Country 2024 & 2032
- Figure 8: South America Middle-East Enhanced Oil Recovery Market Revenue (Million), by Country 2024 & 2032
- Figure 9: South America Middle-East Enhanced Oil Recovery Market Revenue Share (%), by Country 2024 & 2032
- Figure 10: MEA Middle-East Enhanced Oil Recovery Market Revenue (Million), by Country 2024 & 2032
- Figure 11: MEA Middle-East Enhanced Oil Recovery Market Revenue Share (%), by Country 2024 & 2032
- Figure 12: Oman Middle-East Enhanced Oil Recovery Market Revenue (Million), by Technique 2024 & 2032
- Figure 13: Oman Middle-East Enhanced Oil Recovery Market Revenue Share (%), by Technique 2024 & 2032
- Figure 14: Oman Middle-East Enhanced Oil Recovery Market Revenue (Million), by Geography 2024 & 2032
- Figure 15: Oman Middle-East Enhanced Oil Recovery Market Revenue Share (%), by Geography 2024 & 2032
- Figure 16: Oman Middle-East Enhanced Oil Recovery Market Revenue (Million), by Country 2024 & 2032
- Figure 17: Oman Middle-East Enhanced Oil Recovery Market Revenue Share (%), by Country 2024 & 2032
- Figure 18: United Arab Emirates Middle-East Enhanced Oil Recovery Market Revenue (Million), by Technique 2024 & 2032
- Figure 19: United Arab Emirates Middle-East Enhanced Oil Recovery Market Revenue Share (%), by Technique 2024 & 2032
- Figure 20: United Arab Emirates Middle-East Enhanced Oil Recovery Market Revenue (Million), by Geography 2024 & 2032
- Figure 21: United Arab Emirates Middle-East Enhanced Oil Recovery Market Revenue Share (%), by Geography 2024 & 2032
- Figure 22: United Arab Emirates Middle-East Enhanced Oil Recovery Market Revenue (Million), by Country 2024 & 2032
- Figure 23: United Arab Emirates Middle-East Enhanced Oil Recovery Market Revenue Share (%), by Country 2024 & 2032
- Figure 24: Qatar Middle-East Enhanced Oil Recovery Market Revenue (Million), by Technique 2024 & 2032
- Figure 25: Qatar Middle-East Enhanced Oil Recovery Market Revenue Share (%), by Technique 2024 & 2032
- Figure 26: Qatar Middle-East Enhanced Oil Recovery Market Revenue (Million), by Geography 2024 & 2032
- Figure 27: Qatar Middle-East Enhanced Oil Recovery Market Revenue Share (%), by Geography 2024 & 2032
- Figure 28: Qatar Middle-East Enhanced Oil Recovery Market Revenue (Million), by Country 2024 & 2032
- Figure 29: Qatar Middle-East Enhanced Oil Recovery Market Revenue Share (%), by Country 2024 & 2032
- Figure 30: Rest of Middle East Middle-East Enhanced Oil Recovery Market Revenue (Million), by Technique 2024 & 2032
- Figure 31: Rest of Middle East Middle-East Enhanced Oil Recovery Market Revenue Share (%), by Technique 2024 & 2032
- Figure 32: Rest of Middle East Middle-East Enhanced Oil Recovery Market Revenue (Million), by Geography 2024 & 2032
- Figure 33: Rest of Middle East Middle-East Enhanced Oil Recovery Market Revenue Share (%), by Geography 2024 & 2032
- Figure 34: Rest of Middle East Middle-East Enhanced Oil Recovery Market Revenue (Million), by Country 2024 & 2032
- Figure 35: Rest of Middle East Middle-East Enhanced Oil Recovery Market Revenue Share (%), by Country 2024 & 2032
List of Tables
- Table 1: Global Middle-East Enhanced Oil Recovery Market Revenue Million Forecast, by Region 2019 & 2032
- Table 2: Global Middle-East Enhanced Oil Recovery Market Revenue Million Forecast, by Technique 2019 & 2032
- Table 3: Global Middle-East Enhanced Oil Recovery Market Revenue Million Forecast, by Geography 2019 & 2032
- Table 4: Global Middle-East Enhanced Oil Recovery Market Revenue Million Forecast, by Region 2019 & 2032
- Table 5: Global Middle-East Enhanced Oil Recovery Market Revenue Million Forecast, by Country 2019 & 2032
- Table 6: United States Middle-East Enhanced Oil Recovery Market Revenue (Million) Forecast, by Application 2019 & 2032
- Table 7: Canada Middle-East Enhanced Oil Recovery Market Revenue (Million) Forecast, by Application 2019 & 2032
- Table 8: Mexico Middle-East Enhanced Oil Recovery Market Revenue (Million) Forecast, by Application 2019 & 2032
- Table 9: Global Middle-East Enhanced Oil Recovery Market Revenue Million Forecast, by Country 2019 & 2032
- Table 10: Germany Middle-East Enhanced Oil Recovery Market Revenue (Million) Forecast, by Application 2019 & 2032
- Table 11: United Kingdom Middle-East Enhanced Oil Recovery Market Revenue (Million) Forecast, by Application 2019 & 2032
- Table 12: France Middle-East Enhanced Oil Recovery Market Revenue (Million) Forecast, by Application 2019 & 2032
- Table 13: Spain Middle-East Enhanced Oil Recovery Market Revenue (Million) Forecast, by Application 2019 & 2032
- Table 14: Italy Middle-East Enhanced Oil Recovery Market Revenue (Million) Forecast, by Application 2019 & 2032
- Table 15: Spain Middle-East Enhanced Oil Recovery Market Revenue (Million) Forecast, by Application 2019 & 2032
- Table 16: Belgium Middle-East Enhanced Oil Recovery Market Revenue (Million) Forecast, by Application 2019 & 2032
- Table 17: Netherland Middle-East Enhanced Oil Recovery Market Revenue (Million) Forecast, by Application 2019 & 2032
- Table 18: Nordics Middle-East Enhanced Oil Recovery Market Revenue (Million) Forecast, by Application 2019 & 2032
- Table 19: Rest of Europe Middle-East Enhanced Oil Recovery Market Revenue (Million) Forecast, by Application 2019 & 2032
- Table 20: Global Middle-East Enhanced Oil Recovery Market Revenue Million Forecast, by Country 2019 & 2032
- Table 21: China Middle-East Enhanced Oil Recovery Market Revenue (Million) Forecast, by Application 2019 & 2032
- Table 22: Japan Middle-East Enhanced Oil Recovery Market Revenue (Million) Forecast, by Application 2019 & 2032
- Table 23: India Middle-East Enhanced Oil Recovery Market Revenue (Million) Forecast, by Application 2019 & 2032
- Table 24: South Korea Middle-East Enhanced Oil Recovery Market Revenue (Million) Forecast, by Application 2019 & 2032
- Table 25: Southeast Asia Middle-East Enhanced Oil Recovery Market Revenue (Million) Forecast, by Application 2019 & 2032
- Table 26: Australia Middle-East Enhanced Oil Recovery Market Revenue (Million) Forecast, by Application 2019 & 2032
- Table 27: Indonesia Middle-East Enhanced Oil Recovery Market Revenue (Million) Forecast, by Application 2019 & 2032
- Table 28: Phillipes Middle-East Enhanced Oil Recovery Market Revenue (Million) Forecast, by Application 2019 & 2032
- Table 29: Singapore Middle-East Enhanced Oil Recovery Market Revenue (Million) Forecast, by Application 2019 & 2032
- Table 30: Thailandc Middle-East Enhanced Oil Recovery Market Revenue (Million) Forecast, by Application 2019 & 2032
- Table 31: Rest of Asia Pacific Middle-East Enhanced Oil Recovery Market Revenue (Million) Forecast, by Application 2019 & 2032
- Table 32: Global Middle-East Enhanced Oil Recovery Market Revenue Million Forecast, by Country 2019 & 2032
- Table 33: Brazil Middle-East Enhanced Oil Recovery Market Revenue (Million) Forecast, by Application 2019 & 2032
- Table 34: Argentina Middle-East Enhanced Oil Recovery Market Revenue (Million) Forecast, by Application 2019 & 2032
- Table 35: Peru Middle-East Enhanced Oil Recovery Market Revenue (Million) Forecast, by Application 2019 & 2032
- Table 36: Chile Middle-East Enhanced Oil Recovery Market Revenue (Million) Forecast, by Application 2019 & 2032
- Table 37: Colombia Middle-East Enhanced Oil Recovery Market Revenue (Million) Forecast, by Application 2019 & 2032
- Table 38: Ecuador Middle-East Enhanced Oil Recovery Market Revenue (Million) Forecast, by Application 2019 & 2032
- Table 39: Venezuela Middle-East Enhanced Oil Recovery Market Revenue (Million) Forecast, by Application 2019 & 2032
- Table 40: Rest of South America Middle-East Enhanced Oil Recovery Market Revenue (Million) Forecast, by Application 2019 & 2032
- Table 41: Global Middle-East Enhanced Oil Recovery Market Revenue Million Forecast, by Country 2019 & 2032
- Table 42: United Arab Emirates Middle-East Enhanced Oil Recovery Market Revenue (Million) Forecast, by Application 2019 & 2032
- Table 43: Saudi Arabia Middle-East Enhanced Oil Recovery Market Revenue (Million) Forecast, by Application 2019 & 2032
- Table 44: South Africa Middle-East Enhanced Oil Recovery Market Revenue (Million) Forecast, by Application 2019 & 2032
- Table 45: Rest of Middle East and Africa Middle-East Enhanced Oil Recovery Market Revenue (Million) Forecast, by Application 2019 & 2032
- Table 46: Global Middle-East Enhanced Oil Recovery Market Revenue Million Forecast, by Technique 2019 & 2032
- Table 47: Global Middle-East Enhanced Oil Recovery Market Revenue Million Forecast, by Geography 2019 & 2032
- Table 48: Global Middle-East Enhanced Oil Recovery Market Revenue Million Forecast, by Country 2019 & 2032
- Table 49: Global Middle-East Enhanced Oil Recovery Market Revenue Million Forecast, by Technique 2019 & 2032
- Table 50: Global Middle-East Enhanced Oil Recovery Market Revenue Million Forecast, by Geography 2019 & 2032
- Table 51: Global Middle-East Enhanced Oil Recovery Market Revenue Million Forecast, by Country 2019 & 2032
- Table 52: Global Middle-East Enhanced Oil Recovery Market Revenue Million Forecast, by Technique 2019 & 2032
- Table 53: Global Middle-East Enhanced Oil Recovery Market Revenue Million Forecast, by Geography 2019 & 2032
- Table 54: Global Middle-East Enhanced Oil Recovery Market Revenue Million Forecast, by Country 2019 & 2032
- Table 55: Global Middle-East Enhanced Oil Recovery Market Revenue Million Forecast, by Technique 2019 & 2032
- Table 56: Global Middle-East Enhanced Oil Recovery Market Revenue Million Forecast, by Geography 2019 & 2032
- Table 57: Global Middle-East Enhanced Oil Recovery Market Revenue Million Forecast, by Country 2019 & 2032
Frequently Asked Questions
1. What is the projected Compound Annual Growth Rate (CAGR) of the Middle-East Enhanced Oil Recovery Market?
The projected CAGR is approximately > 6.00%.
2. Which companies are prominent players in the Middle-East Enhanced Oil Recovery Market?
Key companies in the market include Kemira Oyj, Dubai Petroleum Co, BP Plc, Schlumberger NV, SGS SA, Linde Plc*List Not Exhaustive, Saudi Aramco, China National Offshore Oil Corporation, Abu Dhabi National Oil Company (ADNOC), Petroleum Development Oman.
3. What are the main segments of the Middle-East Enhanced Oil Recovery Market?
The market segments include Technique, Geography.
4. Can you provide details about the market size?
The market size is estimated to be USD XX Million as of 2022.
5. What are some drivers contributing to market growth?
4.; Recovering Number of Air Passengers. on Account of the Cheaper Airfare in Recent Times4.; Increasing Disposable Income of Population.
6. What are the notable trends driving market growth?
Gas Injection Expected to Witness Significant Growth.
7. Are there any restraints impacting market growth?
4.; High Share of Fossil-Fuel-Based Aviation Fuels in South American Countries.
8. Can you provide examples of recent developments in the market?
In November 2021, Qatar Petroleum planned the CO2 dehydration project with Axens, an IFP group company, for the upcoming EOR projects and the CO2 sequestration process. The Medgulf Construction company was selected as the EPC contractor.
9. What pricing options are available for accessing the report?
Pricing options include single-user, multi-user, and enterprise licenses priced at USD 4750, USD 5250, and USD 8750 respectively.
10. Is the market size provided in terms of value or volume?
The market size is provided in terms of value, measured in Million.
11. Are there any specific market keywords associated with the report?
Yes, the market keyword associated with the report is "Middle-East Enhanced Oil Recovery Market," which aids in identifying and referencing the specific market segment covered.
12. How do I determine which pricing option suits my needs best?
The pricing options vary based on user requirements and access needs. Individual users may opt for single-user licenses, while businesses requiring broader access may choose multi-user or enterprise licenses for cost-effective access to the report.
13. Are there any additional resources or data provided in the Middle-East Enhanced Oil Recovery Market report?
While the report offers comprehensive insights, it's advisable to review the specific contents or supplementary materials provided to ascertain if additional resources or data are available.
14. How can I stay updated on further developments or reports in the Middle-East Enhanced Oil Recovery Market?
To stay informed about further developments, trends, and reports in the Middle-East Enhanced Oil Recovery Market, consider subscribing to industry newsletters, following relevant companies and organizations, or regularly checking reputable industry news sources and publications.
Methodology
Step 1 - Identification of Relevant Samples Size from Population Database


Step 2 - Approaches for Defining Global Market Size (Value, Volume* & Price*)

Note*: In applicable scenarios
Step 3 - Data Sources
Primary Research
- Web Analytics
- Survey Reports
- Research Institute
- Latest Research Reports
- Opinion Leaders
Secondary Research
- Annual Reports
- White Paper
- Latest Press Release
- Industry Association
- Paid Database
- Investor Presentations

Step 4 - Data Triangulation
Involves using different sources of information in order to increase the validity of a study
These sources are likely to be stakeholders in a program - participants, other researchers, program staff, other community members, and so on.
Then we put all data in single framework & apply various statistical tools to find out the dynamic on the market.
During the analysis stage, feedback from the stakeholder groups would be compared to determine areas of agreement as well as areas of divergence


