
Key Insights
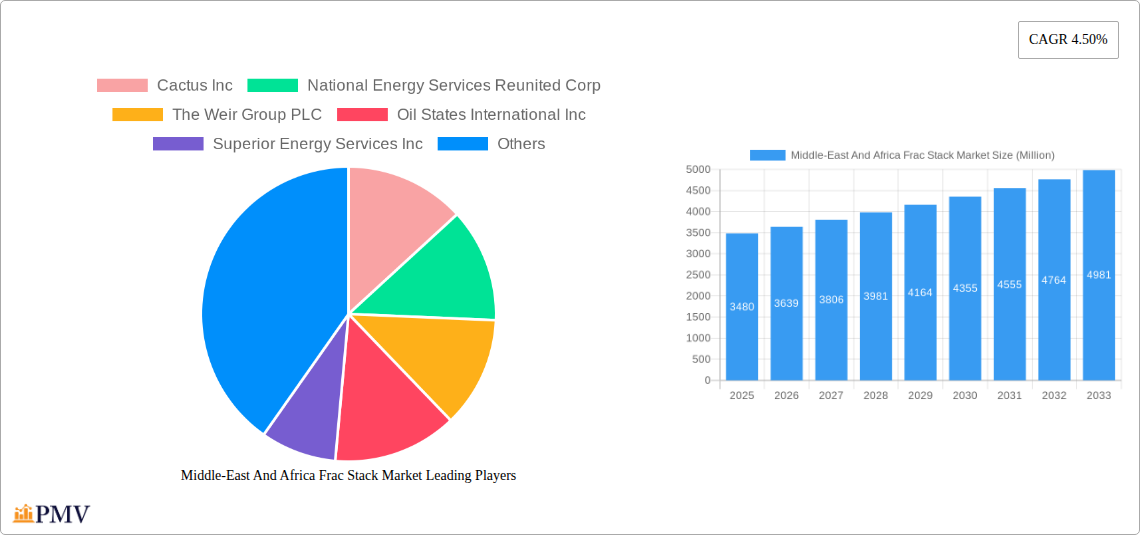
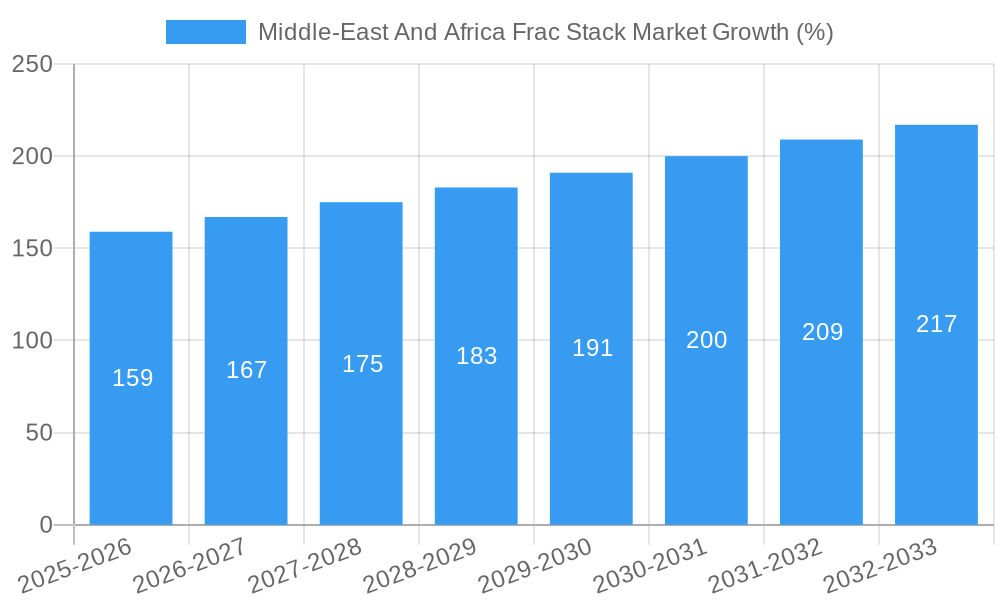
The Middle East and Africa frac stack market, valued at $3.48 billion in 2025, is projected to experience robust growth, driven by increasing oil and gas exploration and production activities across the region. The compound annual growth rate (CAGR) of 4.50% from 2025 to 2033 indicates a significant expansion in market size. This growth is fueled by several factors: the rising demand for energy, particularly in rapidly developing economies within the Middle East and Africa; substantial investments in unconventional oil and gas reserves; and technological advancements leading to improved efficiency and reduced costs associated with hydraulic fracturing. The market segmentation, encompassing onshore and offshore deployment locations and various well types (horizontal, deviated, and vertical), presents diverse opportunities for market players. The prevalence of horizontal and deviated wells, often more resource-intensive and thus requiring sophisticated frac stacks, will likely be a significant driver of market expansion. Competition amongst established players like Baker Hughes, Halliburton, Schlumberger, and NOV, alongside regional and specialized companies, is anticipated to remain intense, leading to innovation and price competitiveness.
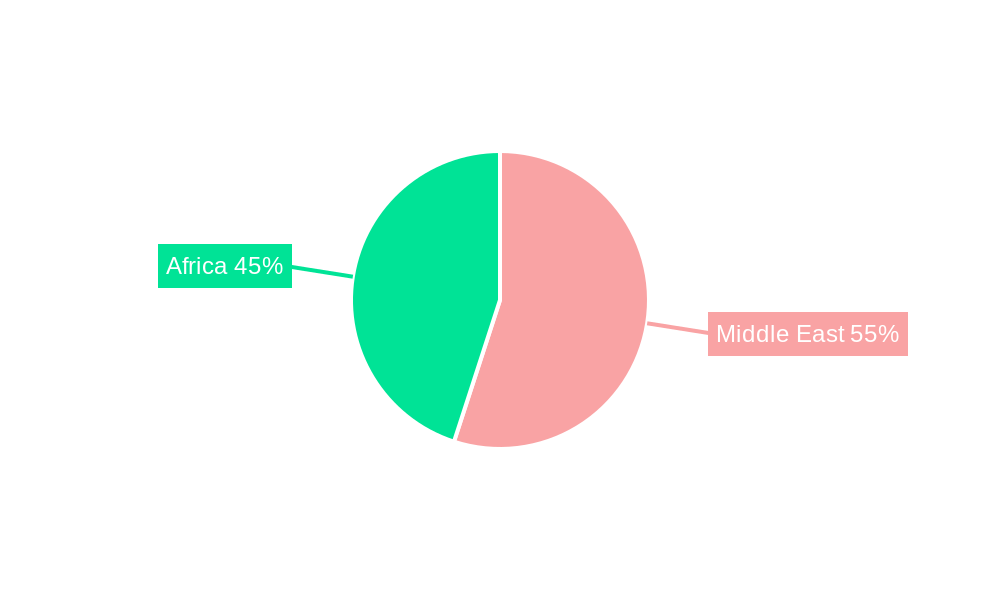
However, the market also faces challenges. Fluctuations in global oil prices can significantly impact investment decisions in exploration and production, potentially affecting demand for frac stacks. Furthermore, regulatory frameworks and environmental concerns surrounding hydraulic fracturing may impose constraints on market growth in certain regions. The uneven distribution of resources across the Middle East and Africa also presents logistical and operational complexities for service providers. Nevertheless, the long-term outlook for the Middle East and Africa frac stack market remains positive, supported by consistent growth in energy demand and ongoing investments in oil and gas infrastructure development. Specific regional growth will depend on factors such as individual country policies, investment in energy infrastructure, and geological factors affecting the ease and viability of hydraulic fracturing.
This comprehensive report provides an in-depth analysis of the Middle East & Africa frac stack market, offering crucial insights for businesses operating in or planning to enter this dynamic sector. The study period spans from 2019 to 2033, with 2025 serving as the base and estimated year. The report leverages extensive data analysis and expert insights to forecast market trends from 2025 to 2033. Key players, including Cactus Inc, National Energy Services Reunited Corp, The Weir Group PLC, Oil States International Inc, Superior Energy Services Inc, Baker Hughes Company, Halliburton Company, SPM Oil & Gas Inc, Schlumberger Limited, and NOV Inc, are meticulously examined for their market positions and strategies.
Middle-East And Africa Frac Stack Market Market Structure & Competitive Dynamics
This section delves into the competitive landscape of the Middle East & Africa frac stack market, analyzing market concentration, innovation, regulatory influences, and market dynamics. The market is moderately concentrated, with the top 5 players holding an estimated xx% market share in 2025. Innovation is driven by the need for efficient and cost-effective fracturing solutions, particularly in challenging geological conditions. Regulatory frameworks vary significantly across the region, impacting market access and operational costs. Product substitution is limited, with specialized frac stack components and services primarily determining competitiveness. M&A activity has been moderate in recent years, with deal values totaling approximately xx Million USD in the last five years, largely focused on strengthening technological capabilities and expanding regional reach. End-user trends indicate a growing preference for comprehensive service packages and integrated solutions.
- Market Concentration: Moderately concentrated, top 5 players hold xx% market share (2025).
- Innovation Ecosystems: Strong emphasis on efficiency and cost-effectiveness in challenging geological conditions.
- Regulatory Frameworks: Vary widely across the region, impacting market access and operational costs.
- M&A Activity (2020-2024): xx Million USD, focused on technology and regional expansion.
Middle-East And Africa Frac Stack Market Industry Trends & Insights
The Middle East & Africa frac stack market is projected to experience a CAGR of xx% during the forecast period (2025-2033), driven by increasing oil and gas exploration and production activities. Technological advancements, such as improved fracturing fluids and advanced stimulation techniques, are boosting efficiency and reducing costs. Growing demand for unconventional resources, particularly shale gas, is also fueling market growth. However, fluctuating oil prices and geopolitical instability pose challenges. Market penetration of advanced frac stack technologies remains relatively low in some regions, presenting significant growth opportunities. The onshore segment is expected to dominate the market, primarily due to the extensive presence of unconventional hydrocarbon reserves in several countries.
Dominant Markets & Segments in Middle East & Africa Frac Stack Market
The onshore segment currently dominates the Middle East & Africa frac stack market, accounting for an estimated xx% of the total market value in 2025. This dominance is primarily attributed to the vast onshore reserves of oil and gas, particularly unconventional resources like shale gas, that necessitate extensive hydraulic fracturing. Within the onshore segment, several Middle Eastern and North African countries, particularly those with significant shale gas reserves (xx Million barrels), are major contributors to market growth. The horizontal and deviated well type segment also holds a significant share (xx%) driven by the increasing adoption of horizontal drilling techniques to optimize production from unconventional reservoirs.
- Onshore Dominance: Driven by extensive unconventional hydrocarbon reserves.
- Horizontal & Deviated Wells: High share due to increasing adoption of horizontal drilling.
- Key Drivers (Onshore): Abundant shale gas reserves, government incentives for energy exploration.
Middle-East And Africa Frac Stack Market Product Innovations
Recent product innovations in the frac stack market focus on enhanced efficiency, durability, and reduced environmental impact. Manufacturers are developing lighter, more robust components with improved pressure tolerance and increased operational lifespan. The integration of advanced sensors and data analytics is improving the precision and effectiveness of hydraulic fracturing operations. These innovations are aimed at optimizing well completion time, reducing operational costs, and minimizing environmental footprint.
Report Segmentation & Scope
This report segments the Middle East & Africa frac stack market based on location of deployment (onshore and offshore) and well type (horizontal and deviated, vertical). The onshore segment is projected to witness significant growth due to the abundance of unconventional resources. The offshore segment, while smaller, is anticipated to experience moderate growth driven by deepwater exploration activities. The horizontal and deviated well type segment is projected to dominate due to its effectiveness in unconventional reservoirs. The vertical well type segment holds a smaller share, with relatively slower growth projections.
Key Drivers of Middle East & Africa Frac Stack Market Growth
Several factors drive the growth of the Middle East & Africa frac stack market. Increased exploration and production of unconventional resources like shale gas and tight oil is a primary driver. Government support and investment in the oil and gas sector, along with favorable regulatory environments in certain countries, further contribute to market expansion. Technological advancements leading to improved efficiency and reduced costs play a vital role in market growth.
Challenges in the Middle East & Africa Frac Stack Market Sector
The Middle East & Africa frac stack market faces challenges, including fluctuating oil prices, geopolitical instability, and varying regulatory frameworks across the region, which adds complexity to operations. Supply chain constraints, particularly in securing specialized equipment and materials, can impact market growth. Intense competition among established and emerging players also poses a challenge. Environmental concerns regarding the environmental impact of hydraulic fracturing present another hurdle. These factors could potentially restrain market growth in certain regions by xx% by 2033.
Leading Players in the Middle East & Africa Frac Stack Market Market
- Cactus Inc
- National Energy Services Reunited Corp
- The Weir Group PLC
- Oil States International Inc
- Superior Energy Services Inc
- Baker Hughes Company
- Halliburton Company
- SPM Oil & Gas Inc
- Schlumberger Limited
- NOV Inc
Key Developments in Middle East & Africa Frac Stack Market Sector
- April 2023: Afro Energy's successful development of 30 pilot wells in South Africa's Mpumalanga province for coal bed methane fracking signals potential market expansion in the region. The vast reserves (4.9 trillion cubic feet) highlight significant growth opportunities.
- February 2023: Tethys Oil's planned fracking operation in Oman's Thameem-1 well demonstrates the increasing adoption of stimulation techniques to enhance oil recovery and underscores the market's technological advancements.
Strategic Middle East & Africa Frac Stack Market Outlook
The Middle East & Africa frac stack market presents significant growth potential, driven by increasing energy demand, exploration of unconventional resources, and technological advancements. Companies focusing on innovative solutions, efficient operations, and adaptation to regional regulatory landscapes are poised to capitalize on this growth. The market is expected to witness continued consolidation, with strategic partnerships and M&A activity shaping the competitive dynamics. Companies offering integrated solutions and services will likely gain a competitive edge.
Middle-East And Africa Frac Stack Market Segmentation
-
1. Location of Deployment
- 1.1. Onshore
- 1.2. Offshore
-
2. Well Type
- 2.1. Horizontal and Deviated
- 2.2. Vertical
Middle-East And Africa Frac Stack Market Segmentation By Geography
- 1. Saudi Arabia
- 2. United Arab Emirates
- 3. Nigeria
- 4. Rest of Middle East and Africa
Middle-East And Africa Frac Stack Market REPORT HIGHLIGHTS
| Aspects | Details |
|---|---|
| Study Period | 2019-2033 |
| Base Year | 2024 |
| Estimated Year | 2025 |
| Forecast Period | 2025-2033 |
| Historical Period | 2019-2024 |
| Growth Rate | CAGR of 4.50% from 2019-2033 |
| Segmentation |
|
Table of Contents
- 1. Introduction
- 1.1. Research Scope
- 1.2. Market Segmentation
- 1.3. Research Methodology
- 1.4. Definitions and Assumptions
- 2. Executive Summary
- 2.1. Introduction
- 3. Market Dynamics
- 3.1. Introduction
- 3.2. Market Drivers
- 3.2.1. 4.; Increasing Production from Unconventional Sources4.; Growing Energy Demand in the Region
- 3.3. Market Restrains
- 3.3.1. 4.; Environmental Concerns
- 3.4. Market Trends
- 3.4.1. The Onshore Sector is Expected to Dominate the Market
- 4. Market Factor Analysis
- 4.1. Porters Five Forces
- 4.2. Supply/Value Chain
- 4.3. PESTEL analysis
- 4.4. Market Entropy
- 4.5. Patent/Trademark Analysis
- 5. Middle-East And Africa Frac Stack Market Analysis, Insights and Forecast, 2019-2031
- 5.1. Market Analysis, Insights and Forecast - by Location of Deployment
- 5.1.1. Onshore
- 5.1.2. Offshore
- 5.2. Market Analysis, Insights and Forecast - by Well Type
- 5.2.1. Horizontal and Deviated
- 5.2.2. Vertical
- 5.3. Market Analysis, Insights and Forecast - by Region
- 5.3.1. Saudi Arabia
- 5.3.2. United Arab Emirates
- 5.3.3. Nigeria
- 5.3.4. Rest of Middle East and Africa
- 5.1. Market Analysis, Insights and Forecast - by Location of Deployment
- 6. Saudi Arabia Middle-East And Africa Frac Stack Market Analysis, Insights and Forecast, 2019-2031
- 6.1. Market Analysis, Insights and Forecast - by Location of Deployment
- 6.1.1. Onshore
- 6.1.2. Offshore
- 6.2. Market Analysis, Insights and Forecast - by Well Type
- 6.2.1. Horizontal and Deviated
- 6.2.2. Vertical
- 6.1. Market Analysis, Insights and Forecast - by Location of Deployment
- 7. United Arab Emirates Middle-East And Africa Frac Stack Market Analysis, Insights and Forecast, 2019-2031
- 7.1. Market Analysis, Insights and Forecast - by Location of Deployment
- 7.1.1. Onshore
- 7.1.2. Offshore
- 7.2. Market Analysis, Insights and Forecast - by Well Type
- 7.2.1. Horizontal and Deviated
- 7.2.2. Vertical
- 7.1. Market Analysis, Insights and Forecast - by Location of Deployment
- 8. Nigeria Middle-East And Africa Frac Stack Market Analysis, Insights and Forecast, 2019-2031
- 8.1. Market Analysis, Insights and Forecast - by Location of Deployment
- 8.1.1. Onshore
- 8.1.2. Offshore
- 8.2. Market Analysis, Insights and Forecast - by Well Type
- 8.2.1. Horizontal and Deviated
- 8.2.2. Vertical
- 8.1. Market Analysis, Insights and Forecast - by Location of Deployment
- 9. Rest of Middle East and Africa Middle-East And Africa Frac Stack Market Analysis, Insights and Forecast, 2019-2031
- 9.1. Market Analysis, Insights and Forecast - by Location of Deployment
- 9.1.1. Onshore
- 9.1.2. Offshore
- 9.2. Market Analysis, Insights and Forecast - by Well Type
- 9.2.1. Horizontal and Deviated
- 9.2.2. Vertical
- 9.1. Market Analysis, Insights and Forecast - by Location of Deployment
- 10. South Africa Middle-East And Africa Frac Stack Market Analysis, Insights and Forecast, 2019-2031
- 11. Sudan Middle-East And Africa Frac Stack Market Analysis, Insights and Forecast, 2019-2031
- 12. Uganda Middle-East And Africa Frac Stack Market Analysis, Insights and Forecast, 2019-2031
- 13. Tanzania Middle-East And Africa Frac Stack Market Analysis, Insights and Forecast, 2019-2031
- 14. Kenya Middle-East And Africa Frac Stack Market Analysis, Insights and Forecast, 2019-2031
- 15. Rest of Africa Middle-East And Africa Frac Stack Market Analysis, Insights and Forecast, 2019-2031
- 16. Competitive Analysis
- 16.1. Market Share Analysis 2024
- 16.2. Company Profiles
- 16.2.1 Cactus Inc
- 16.2.1.1. Overview
- 16.2.1.2. Products
- 16.2.1.3. SWOT Analysis
- 16.2.1.4. Recent Developments
- 16.2.1.5. Financials (Based on Availability)
- 16.2.2 National Energy Services Reunited Corp
- 16.2.2.1. Overview
- 16.2.2.2. Products
- 16.2.2.3. SWOT Analysis
- 16.2.2.4. Recent Developments
- 16.2.2.5. Financials (Based on Availability)
- 16.2.3 The Weir Group PLC
- 16.2.3.1. Overview
- 16.2.3.2. Products
- 16.2.3.3. SWOT Analysis
- 16.2.3.4. Recent Developments
- 16.2.3.5. Financials (Based on Availability)
- 16.2.4 Oil States International Inc
- 16.2.4.1. Overview
- 16.2.4.2. Products
- 16.2.4.3. SWOT Analysis
- 16.2.4.4. Recent Developments
- 16.2.4.5. Financials (Based on Availability)
- 16.2.5 Superior Energy Services Inc
- 16.2.5.1. Overview
- 16.2.5.2. Products
- 16.2.5.3. SWOT Analysis
- 16.2.5.4. Recent Developments
- 16.2.5.5. Financials (Based on Availability)
- 16.2.6 Baker Hughes Company
- 16.2.6.1. Overview
- 16.2.6.2. Products
- 16.2.6.3. SWOT Analysis
- 16.2.6.4. Recent Developments
- 16.2.6.5. Financials (Based on Availability)
- 16.2.7 Halliburton Company
- 16.2.7.1. Overview
- 16.2.7.2. Products
- 16.2.7.3. SWOT Analysis
- 16.2.7.4. Recent Developments
- 16.2.7.5. Financials (Based on Availability)
- 16.2.8 SPM Oil & Gas Inc
- 16.2.8.1. Overview
- 16.2.8.2. Products
- 16.2.8.3. SWOT Analysis
- 16.2.8.4. Recent Developments
- 16.2.8.5. Financials (Based on Availability)
- 16.2.9 Schlumberger Limited
- 16.2.9.1. Overview
- 16.2.9.2. Products
- 16.2.9.3. SWOT Analysis
- 16.2.9.4. Recent Developments
- 16.2.9.5. Financials (Based on Availability)
- 16.2.10 NOV Inc
- 16.2.10.1. Overview
- 16.2.10.2. Products
- 16.2.10.3. SWOT Analysis
- 16.2.10.4. Recent Developments
- 16.2.10.5. Financials (Based on Availability)
- 16.2.1 Cactus Inc
List of Figures
- Figure 1: Middle-East And Africa Frac Stack Market Revenue Breakdown (Million, %) by Product 2024 & 2032
- Figure 2: Middle-East And Africa Frac Stack Market Share (%) by Company 2024
List of Tables
- Table 1: Middle-East And Africa Frac Stack Market Revenue Million Forecast, by Region 2019 & 2032
- Table 2: Middle-East And Africa Frac Stack Market Revenue Million Forecast, by Location of Deployment 2019 & 2032
- Table 3: Middle-East And Africa Frac Stack Market Revenue Million Forecast, by Well Type 2019 & 2032
- Table 4: Middle-East And Africa Frac Stack Market Revenue Million Forecast, by Region 2019 & 2032
- Table 5: Middle-East And Africa Frac Stack Market Revenue Million Forecast, by Country 2019 & 2032
- Table 6: South Africa Middle-East And Africa Frac Stack Market Revenue (Million) Forecast, by Application 2019 & 2032
- Table 7: Sudan Middle-East And Africa Frac Stack Market Revenue (Million) Forecast, by Application 2019 & 2032
- Table 8: Uganda Middle-East And Africa Frac Stack Market Revenue (Million) Forecast, by Application 2019 & 2032
- Table 9: Tanzania Middle-East And Africa Frac Stack Market Revenue (Million) Forecast, by Application 2019 & 2032
- Table 10: Kenya Middle-East And Africa Frac Stack Market Revenue (Million) Forecast, by Application 2019 & 2032
- Table 11: Rest of Africa Middle-East And Africa Frac Stack Market Revenue (Million) Forecast, by Application 2019 & 2032
- Table 12: Middle-East And Africa Frac Stack Market Revenue Million Forecast, by Location of Deployment 2019 & 2032
- Table 13: Middle-East And Africa Frac Stack Market Revenue Million Forecast, by Well Type 2019 & 2032
- Table 14: Middle-East And Africa Frac Stack Market Revenue Million Forecast, by Country 2019 & 2032
- Table 15: Middle-East And Africa Frac Stack Market Revenue Million Forecast, by Location of Deployment 2019 & 2032
- Table 16: Middle-East And Africa Frac Stack Market Revenue Million Forecast, by Well Type 2019 & 2032
- Table 17: Middle-East And Africa Frac Stack Market Revenue Million Forecast, by Country 2019 & 2032
- Table 18: Middle-East And Africa Frac Stack Market Revenue Million Forecast, by Location of Deployment 2019 & 2032
- Table 19: Middle-East And Africa Frac Stack Market Revenue Million Forecast, by Well Type 2019 & 2032
- Table 20: Middle-East And Africa Frac Stack Market Revenue Million Forecast, by Country 2019 & 2032
- Table 21: Middle-East And Africa Frac Stack Market Revenue Million Forecast, by Location of Deployment 2019 & 2032
- Table 22: Middle-East And Africa Frac Stack Market Revenue Million Forecast, by Well Type 2019 & 2032
- Table 23: Middle-East And Africa Frac Stack Market Revenue Million Forecast, by Country 2019 & 2032
Frequently Asked Questions
1. What is the projected Compound Annual Growth Rate (CAGR) of the Middle-East And Africa Frac Stack Market?
The projected CAGR is approximately 4.50%.
2. Which companies are prominent players in the Middle-East And Africa Frac Stack Market?
Key companies in the market include Cactus Inc, National Energy Services Reunited Corp, The Weir Group PLC, Oil States International Inc, Superior Energy Services Inc, Baker Hughes Company, Halliburton Company, SPM Oil & Gas Inc, Schlumberger Limited, NOV Inc.
3. What are the main segments of the Middle-East And Africa Frac Stack Market?
The market segments include Location of Deployment, Well Type.
4. Can you provide details about the market size?
The market size is estimated to be USD 3.48 Million as of 2022.
5. What are some drivers contributing to market growth?
4.; Increasing Production from Unconventional Sources4.; Growing Energy Demand in the Region.
6. What are the notable trends driving market growth?
The Onshore Sector is Expected to Dominate the Market.
7. Are there any restraints impacting market growth?
4.; Environmental Concerns.
8. Can you provide examples of recent developments in the market?
Apr 2023: Afro Energy, the local subsidiary of Australian gas explorer Kinetiko Energy, successfully developed 30 pilot wells in the Amersfoort area of South Africa's Mpumalanga province. The intention is to conduct fracking for coal bed methane in this region. Afro Energy holds exploration rights over an extensive 7,000 square kilometers (2,700 square miles) of the province. It asserts that the gas resources beneath this vast expanse could potentially amount to 4.9 trillion cubic feet.
9. What pricing options are available for accessing the report?
Pricing options include single-user, multi-user, and enterprise licenses priced at USD 4750, USD 5250, and USD 8750 respectively.
10. Is the market size provided in terms of value or volume?
The market size is provided in terms of value, measured in Million.
11. Are there any specific market keywords associated with the report?
Yes, the market keyword associated with the report is "Middle-East And Africa Frac Stack Market," which aids in identifying and referencing the specific market segment covered.
12. How do I determine which pricing option suits my needs best?
The pricing options vary based on user requirements and access needs. Individual users may opt for single-user licenses, while businesses requiring broader access may choose multi-user or enterprise licenses for cost-effective access to the report.
13. Are there any additional resources or data provided in the Middle-East And Africa Frac Stack Market report?
While the report offers comprehensive insights, it's advisable to review the specific contents or supplementary materials provided to ascertain if additional resources or data are available.
14. How can I stay updated on further developments or reports in the Middle-East And Africa Frac Stack Market?
To stay informed about further developments, trends, and reports in the Middle-East And Africa Frac Stack Market, consider subscribing to industry newsletters, following relevant companies and organizations, or regularly checking reputable industry news sources and publications.
Methodology
Step 1 - Identification of Relevant Samples Size from Population Database


Step 2 - Approaches for Defining Global Market Size (Value, Volume* & Price*)

Note*: In applicable scenarios
Step 3 - Data Sources
Primary Research
- Web Analytics
- Survey Reports
- Research Institute
- Latest Research Reports
- Opinion Leaders
Secondary Research
- Annual Reports
- White Paper
- Latest Press Release
- Industry Association
- Paid Database
- Investor Presentations

Step 4 - Data Triangulation
Involves using different sources of information in order to increase the validity of a study
These sources are likely to be stakeholders in a program - participants, other researchers, program staff, other community members, and so on.
Then we put all data in single framework & apply various statistical tools to find out the dynamic on the market.
During the analysis stage, feedback from the stakeholder groups would be compared to determine areas of agreement as well as areas of divergence


