
Key Insights
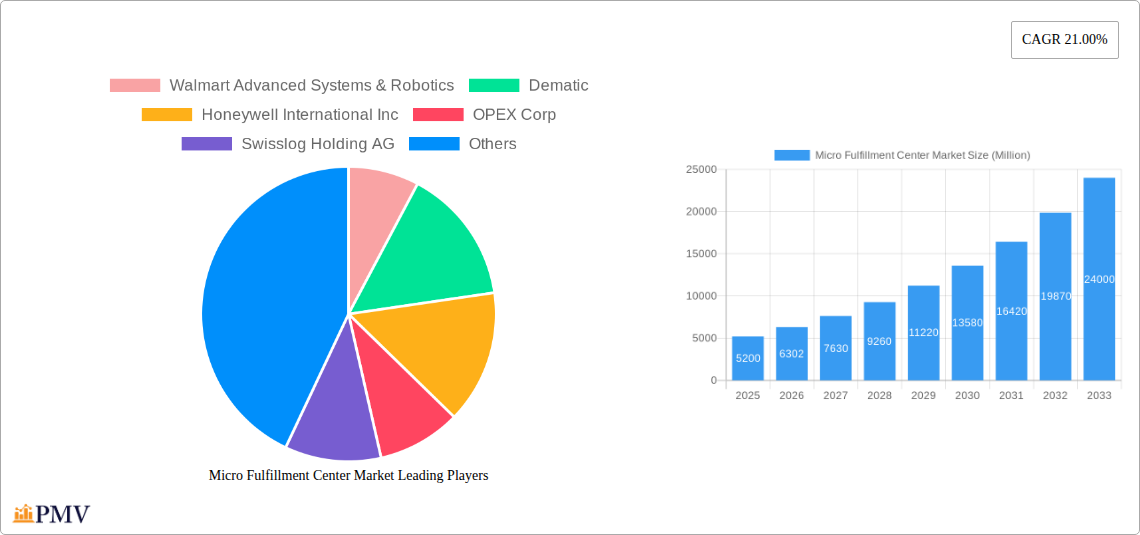
The micro-fulfillment center (MFC) market is experiencing explosive growth, projected to reach $5.20 billion in 2025 and exhibiting a robust Compound Annual Growth Rate (CAGR) of 21.00%. This surge is driven by the escalating demand for faster, more convenient e-commerce deliveries, particularly in densely populated urban areas. Consumers increasingly expect same-day or next-day delivery, pushing retailers and logistics providers to adopt MFCs as a strategic solution. These smaller, automated warehouses located closer to consumers enable quicker order fulfillment and reduce last-mile delivery costs. Key trends fueling this growth include the rise of automated picking and sorting systems, the integration of artificial intelligence and machine learning for optimized inventory management, and the increasing adoption of robotics for improved efficiency and reduced labor costs. While the initial investment in MFC infrastructure can be significant, the long-term return on investment is attractive, considering the potential for increased sales, reduced operational expenses, and enhanced customer satisfaction.
The market's competitive landscape is dynamic, with established players like Walmart Advanced Systems & Robotics, Dematic, and Honeywell International Inc. competing alongside emerging technology providers such as Exotec SAS and AutoStore Holdings. The success of individual companies depends on their ability to offer innovative solutions, integrate seamlessly with existing retail infrastructure, and provide flexible and scalable systems capable of adapting to evolving consumer demands. Future growth will likely be influenced by advancements in automation technologies, the development of more sophisticated warehouse management systems (WMS), and the expansion of MFCs into new geographic markets. Further, the increasing focus on sustainability and the integration of environmentally friendly technologies within MFC operations will play a crucial role in shaping the future of this rapidly expanding market. The market is expected to continue its significant growth throughout the forecast period (2025-2033), driven by the ongoing e-commerce boom and the persistent need for faster and more efficient delivery options.
Micro Fulfillment Center (MFC) Market: A Comprehensive Report (2019-2033)
This in-depth report provides a comprehensive analysis of the Micro Fulfillment Center (MFC) market, offering valuable insights into market dynamics, competitive landscapes, and future growth prospects. The study period covers 2019-2033, with 2025 as the base year and a forecast period of 2025-2033. The report is essential for businesses, investors, and stakeholders seeking to understand and capitalize on opportunities within this rapidly evolving sector. The global MFC market is projected to reach xx Million by 2033, exhibiting a CAGR of xx% during the forecast period.
Micro Fulfillment Center Market Market Structure & Competitive Dynamics
The Micro Fulfillment Center market exhibits a moderately consolidated structure, with several key players vying for market share. Market concentration is influenced by factors such as technological advancements, geographic expansion, and strategic mergers and acquisitions (M&A). The report analyzes the competitive landscape, examining market share held by prominent players like Walmart Advanced Systems & Robotics, Dematic, Honeywell International Inc, OPEX Corp, Swisslog Holding AG, AutoStore Holdings, Exotec SAS, Takeoff Technologies Inc, TGW Logistic Group GmbH, Get Fabric Inc, KPI Solutions, and Instacart. While precise market share figures are proprietary data within the full report, we can observe a trend toward increasing consolidation through M&A activities. For example, the xx Million deal between [Company A] and [Company B] in [Year] significantly reshaped the competitive landscape. The report further details the impact of innovation ecosystems, regulatory frameworks, and the emergence of substitute products on market structure. Analysis of end-user trends, such as the increasing demand for faster delivery and personalized services, is also included. The influence of these factors on market competition and future growth trajectories is thoroughly examined.
Micro Fulfillment Center Market Industry Trends & Insights
The MFC market is experiencing robust growth driven by several key factors. The increasing popularity of e-commerce and the rising consumer demand for faster, more convenient deliveries are major catalysts. Technological advancements, such as the implementation of automation and robotics in MFCs, significantly enhance operational efficiency and reduce costs. Consumer preferences for same-day and next-day delivery are further fueling the growth of this market. The report delves into these trends, providing a detailed analysis of market growth drivers, technological disruptions impacting the industry, evolving consumer preferences, and their influence on competitive dynamics. Quantitative data, such as the CAGR and market penetration rates for different MFC technologies, are presented to illustrate the market's growth trajectory. Furthermore, the report analyzes emerging trends such as the integration of AI and machine learning to optimize inventory management and order fulfillment. The impact of these trends on the market's competitive landscape and future growth is meticulously analyzed, providing actionable insights for stakeholders.

Dominant Markets & Segments in Micro Fulfillment Center Market
The North American region currently dominates the Micro Fulfillment Center market, driven by robust e-commerce growth, advanced infrastructure, and supportive regulatory policies. However, the Asia-Pacific region is poised for significant expansion due to its burgeoning e-commerce sector and increasing adoption of automation technologies.
- Key Drivers in North America: Strong e-commerce presence, established logistics infrastructure, favorable regulatory environment, high disposable income.
- Key Drivers in Asia-Pacific: Rapid e-commerce growth, rising middle class, government initiatives promoting automation, cost-effective labor.
This dominance analysis also extends to specific segments within the MFC market, such as the type of goods handled (e.g., grocery, pharmaceuticals), the size of the MFC, and the technology used. The report provides a detailed breakdown of these segments, analyzing their individual growth trajectories and competitive dynamics. The impact of economic policies, technological advancements, and infrastructure developments on market dominance is extensively analyzed to provide a comprehensive understanding of the market landscape.
Micro Fulfillment Center Market Product Innovations
Recent innovations in the Micro Fulfillment Center market focus on enhancing efficiency and scalability through automation and robotics. New product developments include autonomous mobile robots (AMRs), advanced warehouse management systems (WMS), and improved inventory management software. These advancements offer significant competitive advantages, enabling faster order fulfillment, reduced operational costs, and increased flexibility. The integration of AI and machine learning into MFC operations is also transforming the industry, improving order accuracy and optimizing resource allocation. This technological progress directly addresses the demands of the market, aligning product development with evolving customer expectations and operational requirements.
Report Segmentation & Scope
The report segments the Micro Fulfillment Center market based on several factors, including:
- By Type: Automated MFCs, Semi-automated MFCs
- By Application: Grocery, Pharmaceuticals, General Merchandise
- By Technology: Robotics, Automation, AI-powered systems
- By Region: North America, Europe, Asia-Pacific, Middle East & Africa, South America.
Each segment's growth projections, market size, and competitive dynamics are analyzed, providing a comprehensive understanding of the market's diverse components.
Key Drivers of Micro Fulfillment Center Market Growth
The growth of the Micro Fulfillment Center market is primarily driven by the exponential rise of e-commerce and the increasing demand for quick and convenient deliveries. Technological advancements, particularly in robotics and automation, significantly enhance efficiency and reduce operational costs. Supportive government policies and initiatives aimed at promoting logistics and e-commerce further contribute to market expansion. For example, tax incentives offered by various governments for businesses investing in automation technologies are driving adoption of MFCs.
Challenges in the Micro Fulfillment Center Market Sector
The Micro Fulfillment Center market faces challenges including high initial investment costs for implementing automation technologies, the complexities of integrating various systems and technologies within the MFCs, and the need for skilled labor to operate and maintain automated systems. Supply chain disruptions, especially the availability of crucial components for robotics and automation, pose further obstacles to growth. Regulatory hurdles and compliance requirements can also delay implementation and increase operational costs. These challenges have quantifiable impacts, potentially affecting market growth and profitability.
Leading Players in the Micro Fulfillment Center Market Market
- Walmart Advanced Systems & Robotics
- Dematic
- Honeywell International Inc
- OPEX Corp
- Swisslog Holding AG
- AutoStore Holdings
- Exotec SAS
- Takeoff Technologies Inc
- TGW Logistic Group GmbH
- Get Fabric Inc
- KPI Solutions
- Instacart
*List Not Exhaustive
Key Developments in Micro Fulfillment Center Market Sector
- September 2024: OrionStar Robotics launched CarryBot, a logistics robot designed for MFCs, improving efficiency and flexibility in logistics and delivery.
- April 2024: Dematic opened a new office in Saudi Arabia, expanding its presence in the Middle East and enhancing its ability to serve the local market.
- January 2024: Giant Eagle opened its first automated micro fulfillment center in Pittsburgh, showcasing the growing adoption of automated MFCs in the grocery sector.
Strategic Micro Fulfillment Center Market Market Outlook
The Micro Fulfillment Center market is poised for continued expansion, driven by sustained e-commerce growth and increasing consumer demand for rapid delivery. Strategic opportunities lie in developing innovative technologies, optimizing operational efficiency, and expanding into emerging markets. Companies that effectively leverage automation, AI, and data analytics will gain a competitive edge. The market's future growth potential is significant, with opportunities for both established players and new entrants to participate in shaping the future of fulfillment.
Micro Fulfillment Center Market Segmentation
-
1. Component
- 1.1. Hardware
- 1.2. Software
- 1.3. Services
-
2. Type
- 2.1. Standalone MFCs
- 2.2. Store-Integrated MFCs
- 2.3. Dark Stores
-
3. End User
- 3.1. Traditional Retailers and Distributors
- 3.2. E-commerce
- 3.3. Manufacturers
Micro Fulfillment Center Market Segmentation By Geography
- 1. North America
- 2. Europe
- 3. Asia
- 4. Australia and New Zealand
- 5. Latin America
- 6. Middle East and Africa

Micro Fulfillment Center Market REPORT HIGHLIGHTS
| Aspects | Details |
|---|---|
| Study Period | 2019-2033 |
| Base Year | 2024 |
| Estimated Year | 2025 |
| Forecast Period | 2025-2033 |
| Historical Period | 2019-2024 |
| Growth Rate | CAGR of 21.00% from 2019-2033 |
| Segmentation |
|
Table of Contents
- 1. Introduction
- 1.1. Research Scope
- 1.2. Market Segmentation
- 1.3. Research Methodology
- 1.4. Definitions and Assumptions
- 2. Executive Summary
- 2.1. Introduction
- 3. Market Dynamics
- 3.1. Introduction
- 3.2. Market Drivers
- 3.2.1. An Increase in the Demand for Online Shopping will Drive the Market Growth; Rising Urbanisation will Support the Market Growth
- 3.3. Market Restrains
- 3.3.1. An Increase in the Demand for Online Shopping will Drive the Market Growth; Rising Urbanisation will Support the Market Growth
- 3.4. Market Trends
- 3.4.1. The E-commerce Segment is Expected to Hold Significant Share in the Market
- 4. Market Factor Analysis
- 4.1. Porters Five Forces
- 4.2. Supply/Value Chain
- 4.3. PESTEL analysis
- 4.4. Market Entropy
- 4.5. Patent/Trademark Analysis
- 5. Global Micro Fulfillment Center Market Analysis, Insights and Forecast, 2019-2031
- 5.1. Market Analysis, Insights and Forecast - by Component
- 5.1.1. Hardware
- 5.1.2. Software
- 5.1.3. Services
- 5.2. Market Analysis, Insights and Forecast - by Type
- 5.2.1. Standalone MFCs
- 5.2.2. Store-Integrated MFCs
- 5.2.3. Dark Stores
- 5.3. Market Analysis, Insights and Forecast - by End User
- 5.3.1. Traditional Retailers and Distributors
- 5.3.2. E-commerce
- 5.3.3. Manufacturers
- 5.4. Market Analysis, Insights and Forecast - by Region
- 5.4.1. North America
- 5.4.2. Europe
- 5.4.3. Asia
- 5.4.4. Australia and New Zealand
- 5.4.5. Latin America
- 5.4.6. Middle East and Africa
- 5.1. Market Analysis, Insights and Forecast - by Component
- 6. North America Micro Fulfillment Center Market Analysis, Insights and Forecast, 2019-2031
- 6.1. Market Analysis, Insights and Forecast - by Component
- 6.1.1. Hardware
- 6.1.2. Software
- 6.1.3. Services
- 6.2. Market Analysis, Insights and Forecast - by Type
- 6.2.1. Standalone MFCs
- 6.2.2. Store-Integrated MFCs
- 6.2.3. Dark Stores
- 6.3. Market Analysis, Insights and Forecast - by End User
- 6.3.1. Traditional Retailers and Distributors
- 6.3.2. E-commerce
- 6.3.3. Manufacturers
- 6.1. Market Analysis, Insights and Forecast - by Component
- 7. Europe Micro Fulfillment Center Market Analysis, Insights and Forecast, 2019-2031
- 7.1. Market Analysis, Insights and Forecast - by Component
- 7.1.1. Hardware
- 7.1.2. Software
- 7.1.3. Services
- 7.2. Market Analysis, Insights and Forecast - by Type
- 7.2.1. Standalone MFCs
- 7.2.2. Store-Integrated MFCs
- 7.2.3. Dark Stores
- 7.3. Market Analysis, Insights and Forecast - by End User
- 7.3.1. Traditional Retailers and Distributors
- 7.3.2. E-commerce
- 7.3.3. Manufacturers
- 7.1. Market Analysis, Insights and Forecast - by Component
- 8. Asia Micro Fulfillment Center Market Analysis, Insights and Forecast, 2019-2031
- 8.1. Market Analysis, Insights and Forecast - by Component
- 8.1.1. Hardware
- 8.1.2. Software
- 8.1.3. Services
- 8.2. Market Analysis, Insights and Forecast - by Type
- 8.2.1. Standalone MFCs
- 8.2.2. Store-Integrated MFCs
- 8.2.3. Dark Stores
- 8.3. Market Analysis, Insights and Forecast - by End User
- 8.3.1. Traditional Retailers and Distributors
- 8.3.2. E-commerce
- 8.3.3. Manufacturers
- 8.1. Market Analysis, Insights and Forecast - by Component
- 9. Australia and New Zealand Micro Fulfillment Center Market Analysis, Insights and Forecast, 2019-2031
- 9.1. Market Analysis, Insights and Forecast - by Component
- 9.1.1. Hardware
- 9.1.2. Software
- 9.1.3. Services
- 9.2. Market Analysis, Insights and Forecast - by Type
- 9.2.1. Standalone MFCs
- 9.2.2. Store-Integrated MFCs
- 9.2.3. Dark Stores
- 9.3. Market Analysis, Insights and Forecast - by End User
- 9.3.1. Traditional Retailers and Distributors
- 9.3.2. E-commerce
- 9.3.3. Manufacturers
- 9.1. Market Analysis, Insights and Forecast - by Component
- 10. Latin America Micro Fulfillment Center Market Analysis, Insights and Forecast, 2019-2031
- 10.1. Market Analysis, Insights and Forecast - by Component
- 10.1.1. Hardware
- 10.1.2. Software
- 10.1.3. Services
- 10.2. Market Analysis, Insights and Forecast - by Type
- 10.2.1. Standalone MFCs
- 10.2.2. Store-Integrated MFCs
- 10.2.3. Dark Stores
- 10.3. Market Analysis, Insights and Forecast - by End User
- 10.3.1. Traditional Retailers and Distributors
- 10.3.2. E-commerce
- 10.3.3. Manufacturers
- 10.1. Market Analysis, Insights and Forecast - by Component
- 11. Middle East and Africa Micro Fulfillment Center Market Analysis, Insights and Forecast, 2019-2031
- 11.1. Market Analysis, Insights and Forecast - by Component
- 11.1.1. Hardware
- 11.1.2. Software
- 11.1.3. Services
- 11.2. Market Analysis, Insights and Forecast - by Type
- 11.2.1. Standalone MFCs
- 11.2.2. Store-Integrated MFCs
- 11.2.3. Dark Stores
- 11.3. Market Analysis, Insights and Forecast - by End User
- 11.3.1. Traditional Retailers and Distributors
- 11.3.2. E-commerce
- 11.3.3. Manufacturers
- 11.1. Market Analysis, Insights and Forecast - by Component
- 12. Competitive Analysis
- 12.1. Global Market Share Analysis 2024
- 12.2. Company Profiles
- 12.2.1 Walmart Advanced Systems & Robotics
- 12.2.1.1. Overview
- 12.2.1.2. Products
- 12.2.1.3. SWOT Analysis
- 12.2.1.4. Recent Developments
- 12.2.1.5. Financials (Based on Availability)
- 12.2.2 Dematic
- 12.2.2.1. Overview
- 12.2.2.2. Products
- 12.2.2.3. SWOT Analysis
- 12.2.2.4. Recent Developments
- 12.2.2.5. Financials (Based on Availability)
- 12.2.3 Honeywell International Inc
- 12.2.3.1. Overview
- 12.2.3.2. Products
- 12.2.3.3. SWOT Analysis
- 12.2.3.4. Recent Developments
- 12.2.3.5. Financials (Based on Availability)
- 12.2.4 OPEX Corp
- 12.2.4.1. Overview
- 12.2.4.2. Products
- 12.2.4.3. SWOT Analysis
- 12.2.4.4. Recent Developments
- 12.2.4.5. Financials (Based on Availability)
- 12.2.5 Swisslog Holding AG
- 12.2.5.1. Overview
- 12.2.5.2. Products
- 12.2.5.3. SWOT Analysis
- 12.2.5.4. Recent Developments
- 12.2.5.5. Financials (Based on Availability)
- 12.2.6 AutoStore Holdings
- 12.2.6.1. Overview
- 12.2.6.2. Products
- 12.2.6.3. SWOT Analysis
- 12.2.6.4. Recent Developments
- 12.2.6.5. Financials (Based on Availability)
- 12.2.7 Exotec SAS
- 12.2.7.1. Overview
- 12.2.7.2. Products
- 12.2.7.3. SWOT Analysis
- 12.2.7.4. Recent Developments
- 12.2.7.5. Financials (Based on Availability)
- 12.2.8 Takeoff Technologies Inc
- 12.2.8.1. Overview
- 12.2.8.2. Products
- 12.2.8.3. SWOT Analysis
- 12.2.8.4. Recent Developments
- 12.2.8.5. Financials (Based on Availability)
- 12.2.9 TGW Logistic Group GmbH
- 12.2.9.1. Overview
- 12.2.9.2. Products
- 12.2.9.3. SWOT Analysis
- 12.2.9.4. Recent Developments
- 12.2.9.5. Financials (Based on Availability)
- 12.2.10 Get Fabric Inc
- 12.2.10.1. Overview
- 12.2.10.2. Products
- 12.2.10.3. SWOT Analysis
- 12.2.10.4. Recent Developments
- 12.2.10.5. Financials (Based on Availability)
- 12.2.11 KPI Solutions
- 12.2.11.1. Overview
- 12.2.11.2. Products
- 12.2.11.3. SWOT Analysis
- 12.2.11.4. Recent Developments
- 12.2.11.5. Financials (Based on Availability)
- 12.2.12 Instacart*List Not Exhaustive
- 12.2.12.1. Overview
- 12.2.12.2. Products
- 12.2.12.3. SWOT Analysis
- 12.2.12.4. Recent Developments
- 12.2.12.5. Financials (Based on Availability)
- 12.2.1 Walmart Advanced Systems & Robotics
List of Figures
- Figure 1: Global Micro Fulfillment Center Market Revenue Breakdown (Million, %) by Region 2024 & 2032
- Figure 2: Global Micro Fulfillment Center Market Volume Breakdown (Billion, %) by Region 2024 & 2032
- Figure 3: North America Micro Fulfillment Center Market Revenue (Million), by Component 2024 & 2032
- Figure 4: North America Micro Fulfillment Center Market Volume (Billion), by Component 2024 & 2032
- Figure 5: North America Micro Fulfillment Center Market Revenue Share (%), by Component 2024 & 2032
- Figure 6: North America Micro Fulfillment Center Market Volume Share (%), by Component 2024 & 2032
- Figure 7: North America Micro Fulfillment Center Market Revenue (Million), by Type 2024 & 2032
- Figure 8: North America Micro Fulfillment Center Market Volume (Billion), by Type 2024 & 2032
- Figure 9: North America Micro Fulfillment Center Market Revenue Share (%), by Type 2024 & 2032
- Figure 10: North America Micro Fulfillment Center Market Volume Share (%), by Type 2024 & 2032
- Figure 11: North America Micro Fulfillment Center Market Revenue (Million), by End User 2024 & 2032
- Figure 12: North America Micro Fulfillment Center Market Volume (Billion), by End User 2024 & 2032
- Figure 13: North America Micro Fulfillment Center Market Revenue Share (%), by End User 2024 & 2032
- Figure 14: North America Micro Fulfillment Center Market Volume Share (%), by End User 2024 & 2032
- Figure 15: North America Micro Fulfillment Center Market Revenue (Million), by Country 2024 & 2032
- Figure 16: North America Micro Fulfillment Center Market Volume (Billion), by Country 2024 & 2032
- Figure 17: North America Micro Fulfillment Center Market Revenue Share (%), by Country 2024 & 2032
- Figure 18: North America Micro Fulfillment Center Market Volume Share (%), by Country 2024 & 2032
- Figure 19: Europe Micro Fulfillment Center Market Revenue (Million), by Component 2024 & 2032
- Figure 20: Europe Micro Fulfillment Center Market Volume (Billion), by Component 2024 & 2032
- Figure 21: Europe Micro Fulfillment Center Market Revenue Share (%), by Component 2024 & 2032
- Figure 22: Europe Micro Fulfillment Center Market Volume Share (%), by Component 2024 & 2032
- Figure 23: Europe Micro Fulfillment Center Market Revenue (Million), by Type 2024 & 2032
- Figure 24: Europe Micro Fulfillment Center Market Volume (Billion), by Type 2024 & 2032
- Figure 25: Europe Micro Fulfillment Center Market Revenue Share (%), by Type 2024 & 2032
- Figure 26: Europe Micro Fulfillment Center Market Volume Share (%), by Type 2024 & 2032
- Figure 27: Europe Micro Fulfillment Center Market Revenue (Million), by End User 2024 & 2032
- Figure 28: Europe Micro Fulfillment Center Market Volume (Billion), by End User 2024 & 2032
- Figure 29: Europe Micro Fulfillment Center Market Revenue Share (%), by End User 2024 & 2032
- Figure 30: Europe Micro Fulfillment Center Market Volume Share (%), by End User 2024 & 2032
- Figure 31: Europe Micro Fulfillment Center Market Revenue (Million), by Country 2024 & 2032
- Figure 32: Europe Micro Fulfillment Center Market Volume (Billion), by Country 2024 & 2032
- Figure 33: Europe Micro Fulfillment Center Market Revenue Share (%), by Country 2024 & 2032
- Figure 34: Europe Micro Fulfillment Center Market Volume Share (%), by Country 2024 & 2032
- Figure 35: Asia Micro Fulfillment Center Market Revenue (Million), by Component 2024 & 2032
- Figure 36: Asia Micro Fulfillment Center Market Volume (Billion), by Component 2024 & 2032
- Figure 37: Asia Micro Fulfillment Center Market Revenue Share (%), by Component 2024 & 2032
- Figure 38: Asia Micro Fulfillment Center Market Volume Share (%), by Component 2024 & 2032
- Figure 39: Asia Micro Fulfillment Center Market Revenue (Million), by Type 2024 & 2032
- Figure 40: Asia Micro Fulfillment Center Market Volume (Billion), by Type 2024 & 2032
- Figure 41: Asia Micro Fulfillment Center Market Revenue Share (%), by Type 2024 & 2032
- Figure 42: Asia Micro Fulfillment Center Market Volume Share (%), by Type 2024 & 2032
- Figure 43: Asia Micro Fulfillment Center Market Revenue (Million), by End User 2024 & 2032
- Figure 44: Asia Micro Fulfillment Center Market Volume (Billion), by End User 2024 & 2032
- Figure 45: Asia Micro Fulfillment Center Market Revenue Share (%), by End User 2024 & 2032
- Figure 46: Asia Micro Fulfillment Center Market Volume Share (%), by End User 2024 & 2032
- Figure 47: Asia Micro Fulfillment Center Market Revenue (Million), by Country 2024 & 2032
- Figure 48: Asia Micro Fulfillment Center Market Volume (Billion), by Country 2024 & 2032
- Figure 49: Asia Micro Fulfillment Center Market Revenue Share (%), by Country 2024 & 2032
- Figure 50: Asia Micro Fulfillment Center Market Volume Share (%), by Country 2024 & 2032
- Figure 51: Australia and New Zealand Micro Fulfillment Center Market Revenue (Million), by Component 2024 & 2032
- Figure 52: Australia and New Zealand Micro Fulfillment Center Market Volume (Billion), by Component 2024 & 2032
- Figure 53: Australia and New Zealand Micro Fulfillment Center Market Revenue Share (%), by Component 2024 & 2032
- Figure 54: Australia and New Zealand Micro Fulfillment Center Market Volume Share (%), by Component 2024 & 2032
- Figure 55: Australia and New Zealand Micro Fulfillment Center Market Revenue (Million), by Type 2024 & 2032
- Figure 56: Australia and New Zealand Micro Fulfillment Center Market Volume (Billion), by Type 2024 & 2032
- Figure 57: Australia and New Zealand Micro Fulfillment Center Market Revenue Share (%), by Type 2024 & 2032
- Figure 58: Australia and New Zealand Micro Fulfillment Center Market Volume Share (%), by Type 2024 & 2032
- Figure 59: Australia and New Zealand Micro Fulfillment Center Market Revenue (Million), by End User 2024 & 2032
- Figure 60: Australia and New Zealand Micro Fulfillment Center Market Volume (Billion), by End User 2024 & 2032
- Figure 61: Australia and New Zealand Micro Fulfillment Center Market Revenue Share (%), by End User 2024 & 2032
- Figure 62: Australia and New Zealand Micro Fulfillment Center Market Volume Share (%), by End User 2024 & 2032
- Figure 63: Australia and New Zealand Micro Fulfillment Center Market Revenue (Million), by Country 2024 & 2032
- Figure 64: Australia and New Zealand Micro Fulfillment Center Market Volume (Billion), by Country 2024 & 2032
- Figure 65: Australia and New Zealand Micro Fulfillment Center Market Revenue Share (%), by Country 2024 & 2032
- Figure 66: Australia and New Zealand Micro Fulfillment Center Market Volume Share (%), by Country 2024 & 2032
- Figure 67: Latin America Micro Fulfillment Center Market Revenue (Million), by Component 2024 & 2032
- Figure 68: Latin America Micro Fulfillment Center Market Volume (Billion), by Component 2024 & 2032
- Figure 69: Latin America Micro Fulfillment Center Market Revenue Share (%), by Component 2024 & 2032
- Figure 70: Latin America Micro Fulfillment Center Market Volume Share (%), by Component 2024 & 2032
- Figure 71: Latin America Micro Fulfillment Center Market Revenue (Million), by Type 2024 & 2032
- Figure 72: Latin America Micro Fulfillment Center Market Volume (Billion), by Type 2024 & 2032
- Figure 73: Latin America Micro Fulfillment Center Market Revenue Share (%), by Type 2024 & 2032
- Figure 74: Latin America Micro Fulfillment Center Market Volume Share (%), by Type 2024 & 2032
- Figure 75: Latin America Micro Fulfillment Center Market Revenue (Million), by End User 2024 & 2032
- Figure 76: Latin America Micro Fulfillment Center Market Volume (Billion), by End User 2024 & 2032
- Figure 77: Latin America Micro Fulfillment Center Market Revenue Share (%), by End User 2024 & 2032
- Figure 78: Latin America Micro Fulfillment Center Market Volume Share (%), by End User 2024 & 2032
- Figure 79: Latin America Micro Fulfillment Center Market Revenue (Million), by Country 2024 & 2032
- Figure 80: Latin America Micro Fulfillment Center Market Volume (Billion), by Country 2024 & 2032
- Figure 81: Latin America Micro Fulfillment Center Market Revenue Share (%), by Country 2024 & 2032
- Figure 82: Latin America Micro Fulfillment Center Market Volume Share (%), by Country 2024 & 2032
- Figure 83: Middle East and Africa Micro Fulfillment Center Market Revenue (Million), by Component 2024 & 2032
- Figure 84: Middle East and Africa Micro Fulfillment Center Market Volume (Billion), by Component 2024 & 2032
- Figure 85: Middle East and Africa Micro Fulfillment Center Market Revenue Share (%), by Component 2024 & 2032
- Figure 86: Middle East and Africa Micro Fulfillment Center Market Volume Share (%), by Component 2024 & 2032
- Figure 87: Middle East and Africa Micro Fulfillment Center Market Revenue (Million), by Type 2024 & 2032
- Figure 88: Middle East and Africa Micro Fulfillment Center Market Volume (Billion), by Type 2024 & 2032
- Figure 89: Middle East and Africa Micro Fulfillment Center Market Revenue Share (%), by Type 2024 & 2032
- Figure 90: Middle East and Africa Micro Fulfillment Center Market Volume Share (%), by Type 2024 & 2032
- Figure 91: Middle East and Africa Micro Fulfillment Center Market Revenue (Million), by End User 2024 & 2032
- Figure 92: Middle East and Africa Micro Fulfillment Center Market Volume (Billion), by End User 2024 & 2032
- Figure 93: Middle East and Africa Micro Fulfillment Center Market Revenue Share (%), by End User 2024 & 2032
- Figure 94: Middle East and Africa Micro Fulfillment Center Market Volume Share (%), by End User 2024 & 2032
- Figure 95: Middle East and Africa Micro Fulfillment Center Market Revenue (Million), by Country 2024 & 2032
- Figure 96: Middle East and Africa Micro Fulfillment Center Market Volume (Billion), by Country 2024 & 2032
- Figure 97: Middle East and Africa Micro Fulfillment Center Market Revenue Share (%), by Country 2024 & 2032
- Figure 98: Middle East and Africa Micro Fulfillment Center Market Volume Share (%), by Country 2024 & 2032
List of Tables
- Table 1: Global Micro Fulfillment Center Market Revenue Million Forecast, by Region 2019 & 2032
- Table 2: Global Micro Fulfillment Center Market Volume Billion Forecast, by Region 2019 & 2032
- Table 3: Global Micro Fulfillment Center Market Revenue Million Forecast, by Component 2019 & 2032
- Table 4: Global Micro Fulfillment Center Market Volume Billion Forecast, by Component 2019 & 2032
- Table 5: Global Micro Fulfillment Center Market Revenue Million Forecast, by Type 2019 & 2032
- Table 6: Global Micro Fulfillment Center Market Volume Billion Forecast, by Type 2019 & 2032
- Table 7: Global Micro Fulfillment Center Market Revenue Million Forecast, by End User 2019 & 2032
- Table 8: Global Micro Fulfillment Center Market Volume Billion Forecast, by End User 2019 & 2032
- Table 9: Global Micro Fulfillment Center Market Revenue Million Forecast, by Region 2019 & 2032
- Table 10: Global Micro Fulfillment Center Market Volume Billion Forecast, by Region 2019 & 2032
- Table 11: Global Micro Fulfillment Center Market Revenue Million Forecast, by Component 2019 & 2032
- Table 12: Global Micro Fulfillment Center Market Volume Billion Forecast, by Component 2019 & 2032
- Table 13: Global Micro Fulfillment Center Market Revenue Million Forecast, by Type 2019 & 2032
- Table 14: Global Micro Fulfillment Center Market Volume Billion Forecast, by Type 2019 & 2032
- Table 15: Global Micro Fulfillment Center Market Revenue Million Forecast, by End User 2019 & 2032
- Table 16: Global Micro Fulfillment Center Market Volume Billion Forecast, by End User 2019 & 2032
- Table 17: Global Micro Fulfillment Center Market Revenue Million Forecast, by Country 2019 & 2032
- Table 18: Global Micro Fulfillment Center Market Volume Billion Forecast, by Country 2019 & 2032
- Table 19: Global Micro Fulfillment Center Market Revenue Million Forecast, by Component 2019 & 2032
- Table 20: Global Micro Fulfillment Center Market Volume Billion Forecast, by Component 2019 & 2032
- Table 21: Global Micro Fulfillment Center Market Revenue Million Forecast, by Type 2019 & 2032
- Table 22: Global Micro Fulfillment Center Market Volume Billion Forecast, by Type 2019 & 2032
- Table 23: Global Micro Fulfillment Center Market Revenue Million Forecast, by End User 2019 & 2032
- Table 24: Global Micro Fulfillment Center Market Volume Billion Forecast, by End User 2019 & 2032
- Table 25: Global Micro Fulfillment Center Market Revenue Million Forecast, by Country 2019 & 2032
- Table 26: Global Micro Fulfillment Center Market Volume Billion Forecast, by Country 2019 & 2032
- Table 27: Global Micro Fulfillment Center Market Revenue Million Forecast, by Component 2019 & 2032
- Table 28: Global Micro Fulfillment Center Market Volume Billion Forecast, by Component 2019 & 2032
- Table 29: Global Micro Fulfillment Center Market Revenue Million Forecast, by Type 2019 & 2032
- Table 30: Global Micro Fulfillment Center Market Volume Billion Forecast, by Type 2019 & 2032
- Table 31: Global Micro Fulfillment Center Market Revenue Million Forecast, by End User 2019 & 2032
- Table 32: Global Micro Fulfillment Center Market Volume Billion Forecast, by End User 2019 & 2032
- Table 33: Global Micro Fulfillment Center Market Revenue Million Forecast, by Country 2019 & 2032
- Table 34: Global Micro Fulfillment Center Market Volume Billion Forecast, by Country 2019 & 2032
- Table 35: Global Micro Fulfillment Center Market Revenue Million Forecast, by Component 2019 & 2032
- Table 36: Global Micro Fulfillment Center Market Volume Billion Forecast, by Component 2019 & 2032
- Table 37: Global Micro Fulfillment Center Market Revenue Million Forecast, by Type 2019 & 2032
- Table 38: Global Micro Fulfillment Center Market Volume Billion Forecast, by Type 2019 & 2032
- Table 39: Global Micro Fulfillment Center Market Revenue Million Forecast, by End User 2019 & 2032
- Table 40: Global Micro Fulfillment Center Market Volume Billion Forecast, by End User 2019 & 2032
- Table 41: Global Micro Fulfillment Center Market Revenue Million Forecast, by Country 2019 & 2032
- Table 42: Global Micro Fulfillment Center Market Volume Billion Forecast, by Country 2019 & 2032
- Table 43: Global Micro Fulfillment Center Market Revenue Million Forecast, by Component 2019 & 2032
- Table 44: Global Micro Fulfillment Center Market Volume Billion Forecast, by Component 2019 & 2032
- Table 45: Global Micro Fulfillment Center Market Revenue Million Forecast, by Type 2019 & 2032
- Table 46: Global Micro Fulfillment Center Market Volume Billion Forecast, by Type 2019 & 2032
- Table 47: Global Micro Fulfillment Center Market Revenue Million Forecast, by End User 2019 & 2032
- Table 48: Global Micro Fulfillment Center Market Volume Billion Forecast, by End User 2019 & 2032
- Table 49: Global Micro Fulfillment Center Market Revenue Million Forecast, by Country 2019 & 2032
- Table 50: Global Micro Fulfillment Center Market Volume Billion Forecast, by Country 2019 & 2032
- Table 51: Global Micro Fulfillment Center Market Revenue Million Forecast, by Component 2019 & 2032
- Table 52: Global Micro Fulfillment Center Market Volume Billion Forecast, by Component 2019 & 2032
- Table 53: Global Micro Fulfillment Center Market Revenue Million Forecast, by Type 2019 & 2032
- Table 54: Global Micro Fulfillment Center Market Volume Billion Forecast, by Type 2019 & 2032
- Table 55: Global Micro Fulfillment Center Market Revenue Million Forecast, by End User 2019 & 2032
- Table 56: Global Micro Fulfillment Center Market Volume Billion Forecast, by End User 2019 & 2032
- Table 57: Global Micro Fulfillment Center Market Revenue Million Forecast, by Country 2019 & 2032
- Table 58: Global Micro Fulfillment Center Market Volume Billion Forecast, by Country 2019 & 2032
Frequently Asked Questions
1. What is the projected Compound Annual Growth Rate (CAGR) of the Micro Fulfillment Center Market?
The projected CAGR is approximately 21.00%.
2. Which companies are prominent players in the Micro Fulfillment Center Market?
Key companies in the market include Walmart Advanced Systems & Robotics, Dematic, Honeywell International Inc, OPEX Corp, Swisslog Holding AG, AutoStore Holdings, Exotec SAS, Takeoff Technologies Inc, TGW Logistic Group GmbH, Get Fabric Inc, KPI Solutions, Instacart*List Not Exhaustive.
3. What are the main segments of the Micro Fulfillment Center Market?
The market segments include Component, Type, End User.
4. Can you provide details about the market size?
The market size is estimated to be USD 5.20 Million as of 2022.
5. What are some drivers contributing to market growth?
An Increase in the Demand for Online Shopping will Drive the Market Growth; Rising Urbanisation will Support the Market Growth.
6. What are the notable trends driving market growth?
The E-commerce Segment is Expected to Hold Significant Share in the Market.
7. Are there any restraints impacting market growth?
An Increase in the Demand for Online Shopping will Drive the Market Growth; Rising Urbanisation will Support the Market Growth.
8. Can you provide examples of recent developments in the market?
September 2024: OrionStar Robotics introduced CarryBot, a logistics robot for microfulfillment centers (MFCs). CarryBot is meticulously designed to address the unique requirements of these compact and efficient logistics settings. Its transport capabilities, adaptability, and safety features represent a notable progression in warehouse automation, enhancing efficiency and flexibility in logistics and delivery.April 2024: Dematic announced the inauguration of its new office in the Kingdom of Saudi Arabia. This strategic move reinforces Dematic's commitment to the Middle East and demonstrates its dedication to offering innovative solutions that cater to the specific needs of the local market.January 2024: Giant Eagle announced the opening of its first automated micro fulfillment center in Pittsburgh. This facility will stock various items, including center store goods and chilled and frozen products, to serve curbside pickup orders. To support the operation of the MFC, Giant Eagle is seeking candidates for several positions and will host an open house for interested individuals at the facility.
9. What pricing options are available for accessing the report?
Pricing options include single-user, multi-user, and enterprise licenses priced at USD 4750, USD 5250, and USD 8750 respectively.
10. Is the market size provided in terms of value or volume?
The market size is provided in terms of value, measured in Million and volume, measured in Billion.
11. Are there any specific market keywords associated with the report?
Yes, the market keyword associated with the report is "Micro Fulfillment Center Market," which aids in identifying and referencing the specific market segment covered.
12. How do I determine which pricing option suits my needs best?
The pricing options vary based on user requirements and access needs. Individual users may opt for single-user licenses, while businesses requiring broader access may choose multi-user or enterprise licenses for cost-effective access to the report.
13. Are there any additional resources or data provided in the Micro Fulfillment Center Market report?
While the report offers comprehensive insights, it's advisable to review the specific contents or supplementary materials provided to ascertain if additional resources or data are available.
14. How can I stay updated on further developments or reports in the Micro Fulfillment Center Market?
To stay informed about further developments, trends, and reports in the Micro Fulfillment Center Market, consider subscribing to industry newsletters, following relevant companies and organizations, or regularly checking reputable industry news sources and publications.
Methodology
Step 1 - Identification of Relevant Samples Size from Population Database


Step 2 - Approaches for Defining Global Market Size (Value, Volume* & Price*)

Note*: In applicable scenarios
Step 3 - Data Sources
Primary Research
- Web Analytics
- Survey Reports
- Research Institute
- Latest Research Reports
- Opinion Leaders
Secondary Research
- Annual Reports
- White Paper
- Latest Press Release
- Industry Association
- Paid Database
- Investor Presentations

Step 4 - Data Triangulation
Involves using different sources of information in order to increase the validity of a study
These sources are likely to be stakeholders in a program - participants, other researchers, program staff, other community members, and so on.
Then we put all data in single framework & apply various statistical tools to find out the dynamic on the market.
During the analysis stage, feedback from the stakeholder groups would be compared to determine areas of agreement as well as areas of divergence


