
Key Insights
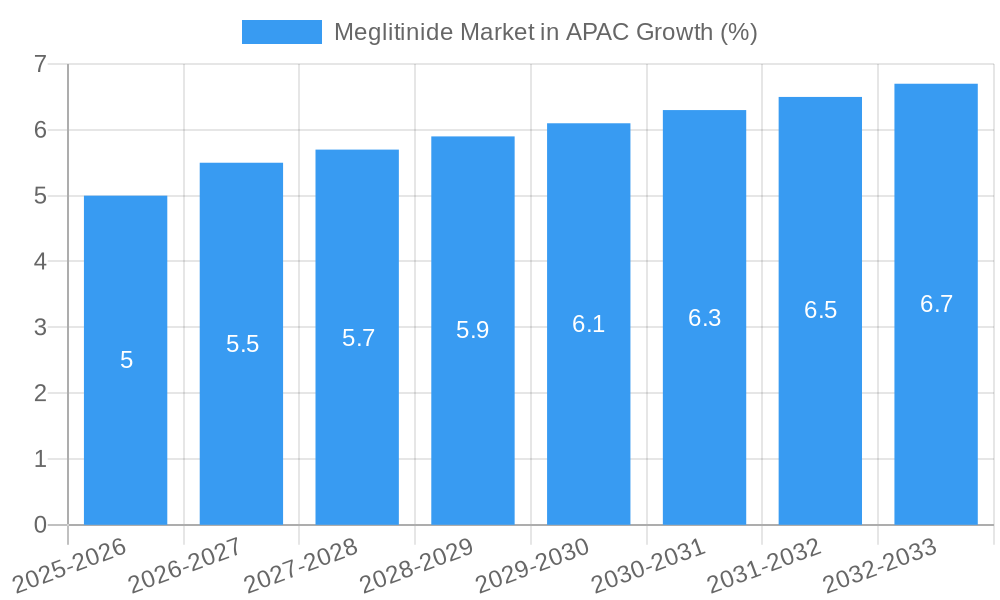
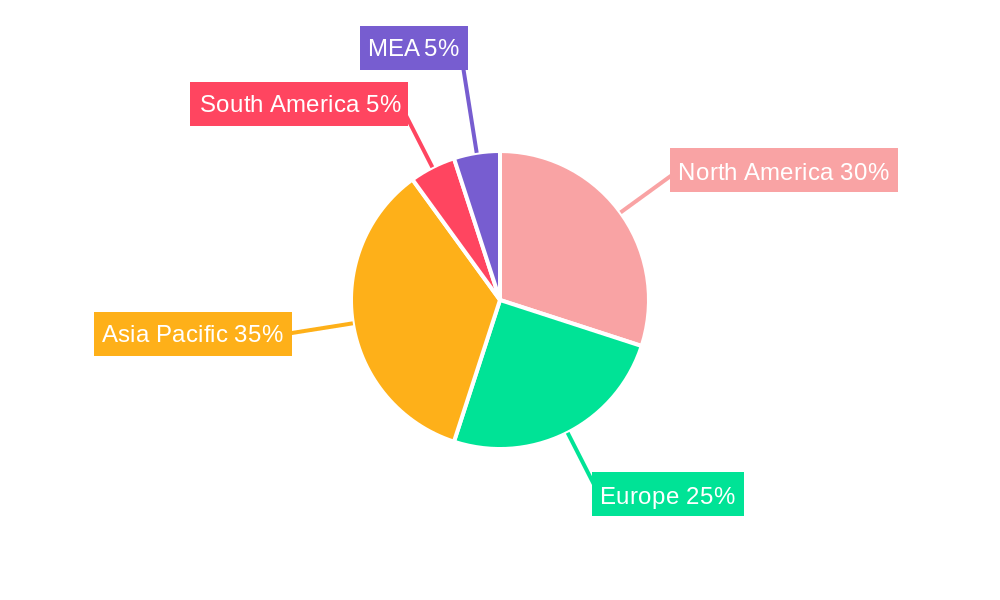
The Asia-Pacific (APAC) meglitinide market presents a compelling growth opportunity, driven by rising diabetes prevalence, particularly in countries like China, India, and Japan. The aging population within this region significantly contributes to the increased demand for effective diabetes management solutions, including meglitinides. While the global CAGR is 1.70%, APAC's growth is likely to outpace this figure, owing to factors such as increasing healthcare expenditure, rising awareness about diabetes, and improved access to healthcare facilities in several key markets. However, the market faces challenges such as the growing preference for newer, once-daily oral antidiabetic drugs (like DPP-4 inhibitors and SGLT-2 inhibitors) and the potential for generic competition impacting pricing strategies. Nevertheless, the substantial patient population with type 2 diabetes within APAC, coupled with a growing understanding of the benefits and efficacy of meglitinides in specific patient subpopulations, will fuel market expansion. The presence of established pharmaceutical companies like Novo Nordisk and others actively engaged in marketing and distribution within the region further supports a positive outlook for growth. Successful strategies will involve targeted marketing campaigns emphasizing the unique advantages of meglitinides in specific treatment scenarios, alongside strategic partnerships with local healthcare providers to enhance patient access and affordability.
Furthermore, the market segmentation within APAC will play a crucial role in shaping its future trajectory. Variations in healthcare infrastructure and regulatory landscapes across different APAC nations will necessitate a differentiated approach by pharmaceutical companies. Focusing on specific high-growth markets with substantial unmet needs and adapting marketing and pricing strategies accordingly will be vital for achieving commercial success. Government initiatives aimed at improving diabetes management and control in several APAC countries will also serve as catalysts for market expansion. Ongoing research and development focused on improving the efficacy and safety profiles of meglitinides, combined with efforts to reduce associated side effects, will further contribute to the sustained growth of the APAC meglitinide market.

Meglitinide Market in APAC: A Comprehensive Market Report (2019-2033)
This detailed report provides a comprehensive analysis of the Meglitinide market in the Asia-Pacific (APAC) region, covering the historical period (2019-2024), base year (2025), estimated year (2025), and forecast period (2025-2033). The report offers in-depth insights into market dynamics, competitive landscape, and future growth prospects, making it an essential resource for industry stakeholders, investors, and researchers. The study period is 2019-2033.
Meglitinide Market in APAC Market Structure & Competitive Dynamics
This section analyzes the structure and competitive dynamics of the APAC meglitinide market. We examine market concentration, revealing the dominance of key players like Novartis, Biocon, Glenmark, Novo Nordisk, Kissei Pharmaceuticals, and Boehringer Ingelheim. Market share data for each player will be presented, detailing their respective contributions to overall market revenue (xx Million for each company in 2025). The report also explores the innovation ecosystem, regulatory frameworks impacting market access and pricing, and the presence of potential product substitutes. We assess end-user trends, including changing treatment patterns for type 2 diabetes, and analyze recent mergers and acquisitions (M&A) activities within the industry, including deal values (xx Million for total M&A value in the past 5 years). The analysis incorporates the impact of these factors on market growth and competitive positioning. The high concentration of the market is indicated by a Herfindahl-Hirschman Index (HHI) of xx.
Meglitinide Market in APAC Industry Trends & Insights
This section dives into the key trends shaping the APAC meglitinide market. We analyze market growth drivers such as the rising prevalence of type 2 diabetes, particularly in rapidly aging populations across the region. Technological advancements, like novel drug delivery systems, will also be discussed. Consumer preferences, including demands for more convenient and effective treatments, are analyzed alongside their influence on market demand. The competitive landscape, marked by both established players and emerging generic manufacturers, is explored in detail. We project a Compound Annual Growth Rate (CAGR) of xx% during the forecast period (2025-2033), with market penetration reaching xx% by 2033. Specific regional variations in growth rates will be explored, highlighting key factors driving differences across APAC countries.
Dominant Markets & Segments in Meglitinide Market in APAC
This section identifies the leading markets and segments within the APAC meglitinide market. Detailed analysis focuses on the dominant region/country, providing a deep dive into the factors behind its market leadership.
- Key Drivers:
- Favorable economic policies supporting healthcare infrastructure development.
- Robust healthcare infrastructure facilitating greater accessibility to medications.
- Strong government initiatives promoting diabetes awareness and management.
- High prevalence of type 2 diabetes within the population.
The dominance of this region is attributed to a confluence of factors, including robust healthcare infrastructure, increasing awareness of diabetes management, and government support for improved healthcare access. We will compare this region’s performance with other major markets within APAC, illustrating the disparities and their underlying reasons.
Meglitinide Market in APAC Product Innovations
This section examines recent product innovations in the APAC meglitinide market. We discuss advancements in formulation, delivery systems, and combination therapies aimed at improving efficacy and patient compliance. The competitive advantages offered by these innovations, such as extended release formulations or improved bioavailability, are also highlighted. We assess the market fit of these new products based on unmet clinical needs and their potential to disrupt existing treatment paradigms.
Report Segmentation & Scope
The report segments the APAC meglitinide market by drug type (Meglitinides), providing detailed analysis for each segment. This includes growth projections, market size estimations (in Million), and competitive dynamics within each segment. The report will present granular data for each sub-segment, enabling a precise understanding of the market structure. Detailed regional breakdowns are also included, allowing readers to analyze trends across different countries within the APAC region.
Key Drivers of Meglitinide Market in APAC Growth
The growth of the APAC meglitinide market is driven by several factors. The rising prevalence of type 2 diabetes, fueled by lifestyle changes and an aging population, presents a significant driver. Technological advancements, including the development of novel formulations and improved drug delivery systems, contribute to improved treatment options. Furthermore, supportive government policies and initiatives aimed at improving healthcare access play a crucial role in market expansion.
Challenges in the Meglitinide Market in APAC Sector
Several challenges impede the growth of the APAC meglitinide market. These include regulatory hurdles in obtaining approvals for new drugs and variations in pricing and reimbursement policies across the region. Supply chain disruptions and the increasing competition from generic drug manufacturers also pose considerable challenges. The presence of cost-effective alternative treatments also impacts market expansion. These factors affect market accessibility and market potential.
Leading Players in the Meglitinide Market in APAC Market
- Novartis
- Biocon
- Glenmark
- Novo Nordisk
- Kissei Pharmaceuticals
- Boehringer Ingelheim
Key Developments in Meglitinide Market in APAC Sector
March 2023: A randomized, open-label, controlled, parallel-group, multicenter trial was conducted to evaluate the efficacy and safety of INS068 once daily (QD) in subjects with type-2 diabetes not adequately controlled with oral antidiabetic drugs compared to insulin Glargine QD for 26+26 weeks. This trial highlights ongoing research efforts to improve treatment options for type 2 diabetes.
January 2023: OXJournal reviewed the effects of meglitinides as a class of oral medications for treating type 2 diabetes, especially in young adults. This review reinforces the ongoing clinical relevance of meglitinides and their importance within the therapeutic landscape.
Strategic Meglitinide Market in APAC Market Outlook
The APAC meglitinide market presents significant opportunities for growth in the coming years. The continuing rise in diabetes prevalence, coupled with advancements in drug development and improved healthcare access, offers strong growth potential. Strategic partnerships and collaborations among pharmaceutical companies and healthcare providers are expected to play a crucial role in shaping future market dynamics. Investments in R&D to develop more effective and convenient meglitinide-based therapies will be critical to sustaining market growth and competitiveness.
Meglitinide Market in APAC Segmentation
-
1. Drug
- 1.1. Meglitinides
-
2. Geography
- 2.1. Japan
- 2.2. China
- 2.3. South Korea
- 2.4. India
- 2.5. Australia
- 2.6. Malaysia
- 2.7. Indonesia
- 2.8. Philippines
- 2.9. Thailand
- 2.10. Rest of Asia-Pacific
Meglitinide Market in APAC Segmentation By Geography
- 1. Japan
- 2. China
- 3. South Korea
- 4. India
- 5. Australia
- 6. Malaysia
- 7. Indonesia
- 8. Philippines
- 9. Thailand
- 10. Rest of Asia Pacific
Meglitinide Market in APAC REPORT HIGHLIGHTS
| Aspects | Details |
|---|---|
| Study Period | 2019-2033 |
| Base Year | 2024 |
| Estimated Year | 2025 |
| Forecast Period | 2025-2033 |
| Historical Period | 2019-2024 |
| Growth Rate | CAGR of 1.70% from 2019-2033 |
| Segmentation |
|
Table of Contents
- 1. Introduction
- 1.1. Research Scope
- 1.2. Market Segmentation
- 1.3. Research Methodology
- 1.4. Definitions and Assumptions
- 2. Executive Summary
- 2.1. Introduction
- 3. Market Dynamics
- 3.1. Introduction
- 3.2. Market Drivers
- 3.2.1. ; The Rise in Global Prevalence of Cases of Obesity due to Modern Sedentary Lifestyles; Rise in Awareness and Disposable Income in Developed Economies
- 3.3. Market Restrains
- 3.3.1 ; Highly Cost of Branded Products in Emerging Countries; Severe Adverse Associated with Medication Including Seizures
- 3.3.2 Suicidal Attempts and Even Death; Adoption of Traditional Yoga and Herbal Products
- 3.4. Market Trends
- 3.4.1. Rising Diabetes Prevalence in Asia-Pacific Region
- 4. Market Factor Analysis
- 4.1. Porters Five Forces
- 4.2. Supply/Value Chain
- 4.3. PESTEL analysis
- 4.4. Market Entropy
- 4.5. Patent/Trademark Analysis
- 5. Global Meglitinide Market in APAC Analysis, Insights and Forecast, 2019-2031
- 5.1. Market Analysis, Insights and Forecast - by Drug
- 5.1.1. Meglitinides
- 5.2. Market Analysis, Insights and Forecast - by Geography
- 5.2.1. Japan
- 5.2.2. China
- 5.2.3. South Korea
- 5.2.4. India
- 5.2.5. Australia
- 5.2.6. Malaysia
- 5.2.7. Indonesia
- 5.2.8. Philippines
- 5.2.9. Thailand
- 5.2.10. Rest of Asia-Pacific
- 5.3. Market Analysis, Insights and Forecast - by Region
- 5.3.1. Japan
- 5.3.2. China
- 5.3.3. South Korea
- 5.3.4. India
- 5.3.5. Australia
- 5.3.6. Malaysia
- 5.3.7. Indonesia
- 5.3.8. Philippines
- 5.3.9. Thailand
- 5.3.10. Rest of Asia Pacific
- 5.1. Market Analysis, Insights and Forecast - by Drug
- 6. Japan Meglitinide Market in APAC Analysis, Insights and Forecast, 2019-2031
- 6.1. Market Analysis, Insights and Forecast - by Drug
- 6.1.1. Meglitinides
- 6.2. Market Analysis, Insights and Forecast - by Geography
- 6.2.1. Japan
- 6.2.2. China
- 6.2.3. South Korea
- 6.2.4. India
- 6.2.5. Australia
- 6.2.6. Malaysia
- 6.2.7. Indonesia
- 6.2.8. Philippines
- 6.2.9. Thailand
- 6.2.10. Rest of Asia-Pacific
- 6.1. Market Analysis, Insights and Forecast - by Drug
- 7. China Meglitinide Market in APAC Analysis, Insights and Forecast, 2019-2031
- 7.1. Market Analysis, Insights and Forecast - by Drug
- 7.1.1. Meglitinides
- 7.2. Market Analysis, Insights and Forecast - by Geography
- 7.2.1. Japan
- 7.2.2. China
- 7.2.3. South Korea
- 7.2.4. India
- 7.2.5. Australia
- 7.2.6. Malaysia
- 7.2.7. Indonesia
- 7.2.8. Philippines
- 7.2.9. Thailand
- 7.2.10. Rest of Asia-Pacific
- 7.1. Market Analysis, Insights and Forecast - by Drug
- 8. South Korea Meglitinide Market in APAC Analysis, Insights and Forecast, 2019-2031
- 8.1. Market Analysis, Insights and Forecast - by Drug
- 8.1.1. Meglitinides
- 8.2. Market Analysis, Insights and Forecast - by Geography
- 8.2.1. Japan
- 8.2.2. China
- 8.2.3. South Korea
- 8.2.4. India
- 8.2.5. Australia
- 8.2.6. Malaysia
- 8.2.7. Indonesia
- 8.2.8. Philippines
- 8.2.9. Thailand
- 8.2.10. Rest of Asia-Pacific
- 8.1. Market Analysis, Insights and Forecast - by Drug
- 9. India Meglitinide Market in APAC Analysis, Insights and Forecast, 2019-2031
- 9.1. Market Analysis, Insights and Forecast - by Drug
- 9.1.1. Meglitinides
- 9.2. Market Analysis, Insights and Forecast - by Geography
- 9.2.1. Japan
- 9.2.2. China
- 9.2.3. South Korea
- 9.2.4. India
- 9.2.5. Australia
- 9.2.6. Malaysia
- 9.2.7. Indonesia
- 9.2.8. Philippines
- 9.2.9. Thailand
- 9.2.10. Rest of Asia-Pacific
- 9.1. Market Analysis, Insights and Forecast - by Drug
- 10. Australia Meglitinide Market in APAC Analysis, Insights and Forecast, 2019-2031
- 10.1. Market Analysis, Insights and Forecast - by Drug
- 10.1.1. Meglitinides
- 10.2. Market Analysis, Insights and Forecast - by Geography
- 10.2.1. Japan
- 10.2.2. China
- 10.2.3. South Korea
- 10.2.4. India
- 10.2.5. Australia
- 10.2.6. Malaysia
- 10.2.7. Indonesia
- 10.2.8. Philippines
- 10.2.9. Thailand
- 10.2.10. Rest of Asia-Pacific
- 10.1. Market Analysis, Insights and Forecast - by Drug
- 11. Malaysia Meglitinide Market in APAC Analysis, Insights and Forecast, 2019-2031
- 11.1. Market Analysis, Insights and Forecast - by Drug
- 11.1.1. Meglitinides
- 11.2. Market Analysis, Insights and Forecast - by Geography
- 11.2.1. Japan
- 11.2.2. China
- 11.2.3. South Korea
- 11.2.4. India
- 11.2.5. Australia
- 11.2.6. Malaysia
- 11.2.7. Indonesia
- 11.2.8. Philippines
- 11.2.9. Thailand
- 11.2.10. Rest of Asia-Pacific
- 11.1. Market Analysis, Insights and Forecast - by Drug
- 12. Indonesia Meglitinide Market in APAC Analysis, Insights and Forecast, 2019-2031
- 12.1. Market Analysis, Insights and Forecast - by Drug
- 12.1.1. Meglitinides
- 12.2. Market Analysis, Insights and Forecast - by Geography
- 12.2.1. Japan
- 12.2.2. China
- 12.2.3. South Korea
- 12.2.4. India
- 12.2.5. Australia
- 12.2.6. Malaysia
- 12.2.7. Indonesia
- 12.2.8. Philippines
- 12.2.9. Thailand
- 12.2.10. Rest of Asia-Pacific
- 12.1. Market Analysis, Insights and Forecast - by Drug
- 13. Philippines Meglitinide Market in APAC Analysis, Insights and Forecast, 2019-2031
- 13.1. Market Analysis, Insights and Forecast - by Drug
- 13.1.1. Meglitinides
- 13.2. Market Analysis, Insights and Forecast - by Geography
- 13.2.1. Japan
- 13.2.2. China
- 13.2.3. South Korea
- 13.2.4. India
- 13.2.5. Australia
- 13.2.6. Malaysia
- 13.2.7. Indonesia
- 13.2.8. Philippines
- 13.2.9. Thailand
- 13.2.10. Rest of Asia-Pacific
- 13.1. Market Analysis, Insights and Forecast - by Drug
- 14. Thailand Meglitinide Market in APAC Analysis, Insights and Forecast, 2019-2031
- 14.1. Market Analysis, Insights and Forecast - by Drug
- 14.1.1. Meglitinides
- 14.2. Market Analysis, Insights and Forecast - by Geography
- 14.2.1. Japan
- 14.2.2. China
- 14.2.3. South Korea
- 14.2.4. India
- 14.2.5. Australia
- 14.2.6. Malaysia
- 14.2.7. Indonesia
- 14.2.8. Philippines
- 14.2.9. Thailand
- 14.2.10. Rest of Asia-Pacific
- 14.1. Market Analysis, Insights and Forecast - by Drug
- 15. Rest of Asia Pacific Meglitinide Market in APAC Analysis, Insights and Forecast, 2019-2031
- 15.1. Market Analysis, Insights and Forecast - by Drug
- 15.1.1. Meglitinides
- 15.2. Market Analysis, Insights and Forecast - by Geography
- 15.2.1. Japan
- 15.2.2. China
- 15.2.3. South Korea
- 15.2.4. India
- 15.2.5. Australia
- 15.2.6. Malaysia
- 15.2.7. Indonesia
- 15.2.8. Philippines
- 15.2.9. Thailand
- 15.2.10. Rest of Asia-Pacific
- 15.1. Market Analysis, Insights and Forecast - by Drug
- 16. North America Meglitinide Market in APAC Analysis, Insights and Forecast, 2019-2031
- 16.1. Market Analysis, Insights and Forecast - By Country/Sub-region
- 16.1.1 United States
- 16.1.2 Canada
- 16.1.3 Mexico
- 17. Europe Meglitinide Market in APAC Analysis, Insights and Forecast, 2019-2031
- 17.1. Market Analysis, Insights and Forecast - By Country/Sub-region
- 17.1.1 Germany
- 17.1.2 United Kingdom
- 17.1.3 France
- 17.1.4 Spain
- 17.1.5 Italy
- 17.1.6 Spain
- 17.1.7 Belgium
- 17.1.8 Netherland
- 17.1.9 Nordics
- 17.1.10 Rest of Europe
- 18. Asia Pacific Meglitinide Market in APAC Analysis, Insights and Forecast, 2019-2031
- 18.1. Market Analysis, Insights and Forecast - By Country/Sub-region
- 18.1.1 China
- 18.1.2 Japan
- 18.1.3 India
- 18.1.4 South Korea
- 18.1.5 Southeast Asia
- 18.1.6 Australia
- 18.1.7 Indonesia
- 18.1.8 Phillipes
- 18.1.9 Singapore
- 18.1.10 Thailandc
- 18.1.11 Rest of Asia Pacific
- 19. South America Meglitinide Market in APAC Analysis, Insights and Forecast, 2019-2031
- 19.1. Market Analysis, Insights and Forecast - By Country/Sub-region
- 19.1.1 Brazil
- 19.1.2 Argentina
- 19.1.3 Peru
- 19.1.4 Chile
- 19.1.5 Colombia
- 19.1.6 Ecuador
- 19.1.7 Venezuela
- 19.1.8 Rest of South America
- 20. North America Meglitinide Market in APAC Analysis, Insights and Forecast, 2019-2031
- 20.1. Market Analysis, Insights and Forecast - By Country/Sub-region
- 20.1.1 United States
- 20.1.2 Canada
- 20.1.3 Mexico
- 21. MEA Meglitinide Market in APAC Analysis, Insights and Forecast, 2019-2031
- 21.1. Market Analysis, Insights and Forecast - By Country/Sub-region
- 21.1.1 United Arab Emirates
- 21.1.2 Saudi Arabia
- 21.1.3 South Africa
- 21.1.4 Rest of Middle East and Africa
- 22. Competitive Analysis
- 22.1. Global Market Share Analysis 2024
- 22.2. Company Profiles
- 22.2.1 Novartis
- 22.2.1.1. Overview
- 22.2.1.2. Products
- 22.2.1.3. SWOT Analysis
- 22.2.1.4. Recent Developments
- 22.2.1.5. Financials (Based on Availability)
- 22.2.2 Biocon
- 22.2.2.1. Overview
- 22.2.2.2. Products
- 22.2.2.3. SWOT Analysis
- 22.2.2.4. Recent Developments
- 22.2.2.5. Financials (Based on Availability)
- 22.2.3 Glenmark
- 22.2.3.1. Overview
- 22.2.3.2. Products
- 22.2.3.3. SWOT Analysis
- 22.2.3.4. Recent Developments
- 22.2.3.5. Financials (Based on Availability)
- 22.2.4 Novo Nordisk
- 22.2.4.1. Overview
- 22.2.4.2. Products
- 22.2.4.3. SWOT Analysis
- 22.2.4.4. Recent Developments
- 22.2.4.5. Financials (Based on Availability)
- 22.2.5 Kissei Pharmaceuticals
- 22.2.5.1. Overview
- 22.2.5.2. Products
- 22.2.5.3. SWOT Analysis
- 22.2.5.4. Recent Developments
- 22.2.5.5. Financials (Based on Availability)
- 22.2.6 Boehringer Ingelheim
- 22.2.6.1. Overview
- 22.2.6.2. Products
- 22.2.6.3. SWOT Analysis
- 22.2.6.4. Recent Developments
- 22.2.6.5. Financials (Based on Availability)
- 22.2.1 Novartis
List of Figures
- Figure 1: Global Meglitinide Market in APAC Revenue Breakdown (Million, %) by Region 2024 & 2032
- Figure 2: Global Meglitinide Market in APAC Volume Breakdown (K Unit, %) by Region 2024 & 2032
- Figure 3: North America Meglitinide Market in APAC Revenue (Million), by Country 2024 & 2032
- Figure 4: North America Meglitinide Market in APAC Volume (K Unit), by Country 2024 & 2032
- Figure 5: North America Meglitinide Market in APAC Revenue Share (%), by Country 2024 & 2032
- Figure 6: North America Meglitinide Market in APAC Volume Share (%), by Country 2024 & 2032
- Figure 7: Europe Meglitinide Market in APAC Revenue (Million), by Country 2024 & 2032
- Figure 8: Europe Meglitinide Market in APAC Volume (K Unit), by Country 2024 & 2032
- Figure 9: Europe Meglitinide Market in APAC Revenue Share (%), by Country 2024 & 2032
- Figure 10: Europe Meglitinide Market in APAC Volume Share (%), by Country 2024 & 2032
- Figure 11: Asia Pacific Meglitinide Market in APAC Revenue (Million), by Country 2024 & 2032
- Figure 12: Asia Pacific Meglitinide Market in APAC Volume (K Unit), by Country 2024 & 2032
- Figure 13: Asia Pacific Meglitinide Market in APAC Revenue Share (%), by Country 2024 & 2032
- Figure 14: Asia Pacific Meglitinide Market in APAC Volume Share (%), by Country 2024 & 2032
- Figure 15: South America Meglitinide Market in APAC Revenue (Million), by Country 2024 & 2032
- Figure 16: South America Meglitinide Market in APAC Volume (K Unit), by Country 2024 & 2032
- Figure 17: South America Meglitinide Market in APAC Revenue Share (%), by Country 2024 & 2032
- Figure 18: South America Meglitinide Market in APAC Volume Share (%), by Country 2024 & 2032
- Figure 19: North America Meglitinide Market in APAC Revenue (Million), by Country 2024 & 2032
- Figure 20: North America Meglitinide Market in APAC Volume (K Unit), by Country 2024 & 2032
- Figure 21: North America Meglitinide Market in APAC Revenue Share (%), by Country 2024 & 2032
- Figure 22: North America Meglitinide Market in APAC Volume Share (%), by Country 2024 & 2032
- Figure 23: MEA Meglitinide Market in APAC Revenue (Million), by Country 2024 & 2032
- Figure 24: MEA Meglitinide Market in APAC Volume (K Unit), by Country 2024 & 2032
- Figure 25: MEA Meglitinide Market in APAC Revenue Share (%), by Country 2024 & 2032
- Figure 26: MEA Meglitinide Market in APAC Volume Share (%), by Country 2024 & 2032
- Figure 27: Japan Meglitinide Market in APAC Revenue (Million), by Drug 2024 & 2032
- Figure 28: Japan Meglitinide Market in APAC Volume (K Unit), by Drug 2024 & 2032
- Figure 29: Japan Meglitinide Market in APAC Revenue Share (%), by Drug 2024 & 2032
- Figure 30: Japan Meglitinide Market in APAC Volume Share (%), by Drug 2024 & 2032
- Figure 31: Japan Meglitinide Market in APAC Revenue (Million), by Geography 2024 & 2032
- Figure 32: Japan Meglitinide Market in APAC Volume (K Unit), by Geography 2024 & 2032
- Figure 33: Japan Meglitinide Market in APAC Revenue Share (%), by Geography 2024 & 2032
- Figure 34: Japan Meglitinide Market in APAC Volume Share (%), by Geography 2024 & 2032
- Figure 35: Japan Meglitinide Market in APAC Revenue (Million), by Country 2024 & 2032
- Figure 36: Japan Meglitinide Market in APAC Volume (K Unit), by Country 2024 & 2032
- Figure 37: Japan Meglitinide Market in APAC Revenue Share (%), by Country 2024 & 2032
- Figure 38: Japan Meglitinide Market in APAC Volume Share (%), by Country 2024 & 2032
- Figure 39: China Meglitinide Market in APAC Revenue (Million), by Drug 2024 & 2032
- Figure 40: China Meglitinide Market in APAC Volume (K Unit), by Drug 2024 & 2032
- Figure 41: China Meglitinide Market in APAC Revenue Share (%), by Drug 2024 & 2032
- Figure 42: China Meglitinide Market in APAC Volume Share (%), by Drug 2024 & 2032
- Figure 43: China Meglitinide Market in APAC Revenue (Million), by Geography 2024 & 2032
- Figure 44: China Meglitinide Market in APAC Volume (K Unit), by Geography 2024 & 2032
- Figure 45: China Meglitinide Market in APAC Revenue Share (%), by Geography 2024 & 2032
- Figure 46: China Meglitinide Market in APAC Volume Share (%), by Geography 2024 & 2032
- Figure 47: China Meglitinide Market in APAC Revenue (Million), by Country 2024 & 2032
- Figure 48: China Meglitinide Market in APAC Volume (K Unit), by Country 2024 & 2032
- Figure 49: China Meglitinide Market in APAC Revenue Share (%), by Country 2024 & 2032
- Figure 50: China Meglitinide Market in APAC Volume Share (%), by Country 2024 & 2032
- Figure 51: South Korea Meglitinide Market in APAC Revenue (Million), by Drug 2024 & 2032
- Figure 52: South Korea Meglitinide Market in APAC Volume (K Unit), by Drug 2024 & 2032
- Figure 53: South Korea Meglitinide Market in APAC Revenue Share (%), by Drug 2024 & 2032
- Figure 54: South Korea Meglitinide Market in APAC Volume Share (%), by Drug 2024 & 2032
- Figure 55: South Korea Meglitinide Market in APAC Revenue (Million), by Geography 2024 & 2032
- Figure 56: South Korea Meglitinide Market in APAC Volume (K Unit), by Geography 2024 & 2032
- Figure 57: South Korea Meglitinide Market in APAC Revenue Share (%), by Geography 2024 & 2032
- Figure 58: South Korea Meglitinide Market in APAC Volume Share (%), by Geography 2024 & 2032
- Figure 59: South Korea Meglitinide Market in APAC Revenue (Million), by Country 2024 & 2032
- Figure 60: South Korea Meglitinide Market in APAC Volume (K Unit), by Country 2024 & 2032
- Figure 61: South Korea Meglitinide Market in APAC Revenue Share (%), by Country 2024 & 2032
- Figure 62: South Korea Meglitinide Market in APAC Volume Share (%), by Country 2024 & 2032
- Figure 63: India Meglitinide Market in APAC Revenue (Million), by Drug 2024 & 2032
- Figure 64: India Meglitinide Market in APAC Volume (K Unit), by Drug 2024 & 2032
- Figure 65: India Meglitinide Market in APAC Revenue Share (%), by Drug 2024 & 2032
- Figure 66: India Meglitinide Market in APAC Volume Share (%), by Drug 2024 & 2032
- Figure 67: India Meglitinide Market in APAC Revenue (Million), by Geography 2024 & 2032
- Figure 68: India Meglitinide Market in APAC Volume (K Unit), by Geography 2024 & 2032
- Figure 69: India Meglitinide Market in APAC Revenue Share (%), by Geography 2024 & 2032
- Figure 70: India Meglitinide Market in APAC Volume Share (%), by Geography 2024 & 2032
- Figure 71: India Meglitinide Market in APAC Revenue (Million), by Country 2024 & 2032
- Figure 72: India Meglitinide Market in APAC Volume (K Unit), by Country 2024 & 2032
- Figure 73: India Meglitinide Market in APAC Revenue Share (%), by Country 2024 & 2032
- Figure 74: India Meglitinide Market in APAC Volume Share (%), by Country 2024 & 2032
- Figure 75: Australia Meglitinide Market in APAC Revenue (Million), by Drug 2024 & 2032
- Figure 76: Australia Meglitinide Market in APAC Volume (K Unit), by Drug 2024 & 2032
- Figure 77: Australia Meglitinide Market in APAC Revenue Share (%), by Drug 2024 & 2032
- Figure 78: Australia Meglitinide Market in APAC Volume Share (%), by Drug 2024 & 2032
- Figure 79: Australia Meglitinide Market in APAC Revenue (Million), by Geography 2024 & 2032
- Figure 80: Australia Meglitinide Market in APAC Volume (K Unit), by Geography 2024 & 2032
- Figure 81: Australia Meglitinide Market in APAC Revenue Share (%), by Geography 2024 & 2032
- Figure 82: Australia Meglitinide Market in APAC Volume Share (%), by Geography 2024 & 2032
- Figure 83: Australia Meglitinide Market in APAC Revenue (Million), by Country 2024 & 2032
- Figure 84: Australia Meglitinide Market in APAC Volume (K Unit), by Country 2024 & 2032
- Figure 85: Australia Meglitinide Market in APAC Revenue Share (%), by Country 2024 & 2032
- Figure 86: Australia Meglitinide Market in APAC Volume Share (%), by Country 2024 & 2032
- Figure 87: Malaysia Meglitinide Market in APAC Revenue (Million), by Drug 2024 & 2032
- Figure 88: Malaysia Meglitinide Market in APAC Volume (K Unit), by Drug 2024 & 2032
- Figure 89: Malaysia Meglitinide Market in APAC Revenue Share (%), by Drug 2024 & 2032
- Figure 90: Malaysia Meglitinide Market in APAC Volume Share (%), by Drug 2024 & 2032
- Figure 91: Malaysia Meglitinide Market in APAC Revenue (Million), by Geography 2024 & 2032
- Figure 92: Malaysia Meglitinide Market in APAC Volume (K Unit), by Geography 2024 & 2032
- Figure 93: Malaysia Meglitinide Market in APAC Revenue Share (%), by Geography 2024 & 2032
- Figure 94: Malaysia Meglitinide Market in APAC Volume Share (%), by Geography 2024 & 2032
- Figure 95: Malaysia Meglitinide Market in APAC Revenue (Million), by Country 2024 & 2032
- Figure 96: Malaysia Meglitinide Market in APAC Volume (K Unit), by Country 2024 & 2032
- Figure 97: Malaysia Meglitinide Market in APAC Revenue Share (%), by Country 2024 & 2032
- Figure 98: Malaysia Meglitinide Market in APAC Volume Share (%), by Country 2024 & 2032
- Figure 99: Indonesia Meglitinide Market in APAC Revenue (Million), by Drug 2024 & 2032
- Figure 100: Indonesia Meglitinide Market in APAC Volume (K Unit), by Drug 2024 & 2032
- Figure 101: Indonesia Meglitinide Market in APAC Revenue Share (%), by Drug 2024 & 2032
- Figure 102: Indonesia Meglitinide Market in APAC Volume Share (%), by Drug 2024 & 2032
- Figure 103: Indonesia Meglitinide Market in APAC Revenue (Million), by Geography 2024 & 2032
- Figure 104: Indonesia Meglitinide Market in APAC Volume (K Unit), by Geography 2024 & 2032
- Figure 105: Indonesia Meglitinide Market in APAC Revenue Share (%), by Geography 2024 & 2032
- Figure 106: Indonesia Meglitinide Market in APAC Volume Share (%), by Geography 2024 & 2032
- Figure 107: Indonesia Meglitinide Market in APAC Revenue (Million), by Country 2024 & 2032
- Figure 108: Indonesia Meglitinide Market in APAC Volume (K Unit), by Country 2024 & 2032
- Figure 109: Indonesia Meglitinide Market in APAC Revenue Share (%), by Country 2024 & 2032
- Figure 110: Indonesia Meglitinide Market in APAC Volume Share (%), by Country 2024 & 2032
- Figure 111: Philippines Meglitinide Market in APAC Revenue (Million), by Drug 2024 & 2032
- Figure 112: Philippines Meglitinide Market in APAC Volume (K Unit), by Drug 2024 & 2032
- Figure 113: Philippines Meglitinide Market in APAC Revenue Share (%), by Drug 2024 & 2032
- Figure 114: Philippines Meglitinide Market in APAC Volume Share (%), by Drug 2024 & 2032
- Figure 115: Philippines Meglitinide Market in APAC Revenue (Million), by Geography 2024 & 2032
- Figure 116: Philippines Meglitinide Market in APAC Volume (K Unit), by Geography 2024 & 2032
- Figure 117: Philippines Meglitinide Market in APAC Revenue Share (%), by Geography 2024 & 2032
- Figure 118: Philippines Meglitinide Market in APAC Volume Share (%), by Geography 2024 & 2032
- Figure 119: Philippines Meglitinide Market in APAC Revenue (Million), by Country 2024 & 2032
- Figure 120: Philippines Meglitinide Market in APAC Volume (K Unit), by Country 2024 & 2032
- Figure 121: Philippines Meglitinide Market in APAC Revenue Share (%), by Country 2024 & 2032
- Figure 122: Philippines Meglitinide Market in APAC Volume Share (%), by Country 2024 & 2032
- Figure 123: Thailand Meglitinide Market in APAC Revenue (Million), by Drug 2024 & 2032
- Figure 124: Thailand Meglitinide Market in APAC Volume (K Unit), by Drug 2024 & 2032
- Figure 125: Thailand Meglitinide Market in APAC Revenue Share (%), by Drug 2024 & 2032
- Figure 126: Thailand Meglitinide Market in APAC Volume Share (%), by Drug 2024 & 2032
- Figure 127: Thailand Meglitinide Market in APAC Revenue (Million), by Geography 2024 & 2032
- Figure 128: Thailand Meglitinide Market in APAC Volume (K Unit), by Geography 2024 & 2032
- Figure 129: Thailand Meglitinide Market in APAC Revenue Share (%), by Geography 2024 & 2032
- Figure 130: Thailand Meglitinide Market in APAC Volume Share (%), by Geography 2024 & 2032
- Figure 131: Thailand Meglitinide Market in APAC Revenue (Million), by Country 2024 & 2032
- Figure 132: Thailand Meglitinide Market in APAC Volume (K Unit), by Country 2024 & 2032
- Figure 133: Thailand Meglitinide Market in APAC Revenue Share (%), by Country 2024 & 2032
- Figure 134: Thailand Meglitinide Market in APAC Volume Share (%), by Country 2024 & 2032
- Figure 135: Rest of Asia Pacific Meglitinide Market in APAC Revenue (Million), by Drug 2024 & 2032
- Figure 136: Rest of Asia Pacific Meglitinide Market in APAC Volume (K Unit), by Drug 2024 & 2032
- Figure 137: Rest of Asia Pacific Meglitinide Market in APAC Revenue Share (%), by Drug 2024 & 2032
- Figure 138: Rest of Asia Pacific Meglitinide Market in APAC Volume Share (%), by Drug 2024 & 2032
- Figure 139: Rest of Asia Pacific Meglitinide Market in APAC Revenue (Million), by Geography 2024 & 2032
- Figure 140: Rest of Asia Pacific Meglitinide Market in APAC Volume (K Unit), by Geography 2024 & 2032
- Figure 141: Rest of Asia Pacific Meglitinide Market in APAC Revenue Share (%), by Geography 2024 & 2032
- Figure 142: Rest of Asia Pacific Meglitinide Market in APAC Volume Share (%), by Geography 2024 & 2032
- Figure 143: Rest of Asia Pacific Meglitinide Market in APAC Revenue (Million), by Country 2024 & 2032
- Figure 144: Rest of Asia Pacific Meglitinide Market in APAC Volume (K Unit), by Country 2024 & 2032
- Figure 145: Rest of Asia Pacific Meglitinide Market in APAC Revenue Share (%), by Country 2024 & 2032
- Figure 146: Rest of Asia Pacific Meglitinide Market in APAC Volume Share (%), by Country 2024 & 2032
List of Tables
- Table 1: Global Meglitinide Market in APAC Revenue Million Forecast, by Region 2019 & 2032
- Table 2: Global Meglitinide Market in APAC Volume K Unit Forecast, by Region 2019 & 2032
- Table 3: Global Meglitinide Market in APAC Revenue Million Forecast, by Drug 2019 & 2032
- Table 4: Global Meglitinide Market in APAC Volume K Unit Forecast, by Drug 2019 & 2032
- Table 5: Global Meglitinide Market in APAC Revenue Million Forecast, by Geography 2019 & 2032
- Table 6: Global Meglitinide Market in APAC Volume K Unit Forecast, by Geography 2019 & 2032
- Table 7: Global Meglitinide Market in APAC Revenue Million Forecast, by Region 2019 & 2032
- Table 8: Global Meglitinide Market in APAC Volume K Unit Forecast, by Region 2019 & 2032
- Table 9: Global Meglitinide Market in APAC Revenue Million Forecast, by Country 2019 & 2032
- Table 10: Global Meglitinide Market in APAC Volume K Unit Forecast, by Country 2019 & 2032
- Table 11: United States Meglitinide Market in APAC Revenue (Million) Forecast, by Application 2019 & 2032
- Table 12: United States Meglitinide Market in APAC Volume (K Unit) Forecast, by Application 2019 & 2032
- Table 13: Canada Meglitinide Market in APAC Revenue (Million) Forecast, by Application 2019 & 2032
- Table 14: Canada Meglitinide Market in APAC Volume (K Unit) Forecast, by Application 2019 & 2032
- Table 15: Mexico Meglitinide Market in APAC Revenue (Million) Forecast, by Application 2019 & 2032
- Table 16: Mexico Meglitinide Market in APAC Volume (K Unit) Forecast, by Application 2019 & 2032
- Table 17: Global Meglitinide Market in APAC Revenue Million Forecast, by Country 2019 & 2032
- Table 18: Global Meglitinide Market in APAC Volume K Unit Forecast, by Country 2019 & 2032
- Table 19: Germany Meglitinide Market in APAC Revenue (Million) Forecast, by Application 2019 & 2032
- Table 20: Germany Meglitinide Market in APAC Volume (K Unit) Forecast, by Application 2019 & 2032
- Table 21: United Kingdom Meglitinide Market in APAC Revenue (Million) Forecast, by Application 2019 & 2032
- Table 22: United Kingdom Meglitinide Market in APAC Volume (K Unit) Forecast, by Application 2019 & 2032
- Table 23: France Meglitinide Market in APAC Revenue (Million) Forecast, by Application 2019 & 2032
- Table 24: France Meglitinide Market in APAC Volume (K Unit) Forecast, by Application 2019 & 2032
- Table 25: Spain Meglitinide Market in APAC Revenue (Million) Forecast, by Application 2019 & 2032
- Table 26: Spain Meglitinide Market in APAC Volume (K Unit) Forecast, by Application 2019 & 2032
- Table 27: Italy Meglitinide Market in APAC Revenue (Million) Forecast, by Application 2019 & 2032
- Table 28: Italy Meglitinide Market in APAC Volume (K Unit) Forecast, by Application 2019 & 2032
- Table 29: Spain Meglitinide Market in APAC Revenue (Million) Forecast, by Application 2019 & 2032
- Table 30: Spain Meglitinide Market in APAC Volume (K Unit) Forecast, by Application 2019 & 2032
- Table 31: Belgium Meglitinide Market in APAC Revenue (Million) Forecast, by Application 2019 & 2032
- Table 32: Belgium Meglitinide Market in APAC Volume (K Unit) Forecast, by Application 2019 & 2032
- Table 33: Netherland Meglitinide Market in APAC Revenue (Million) Forecast, by Application 2019 & 2032
- Table 34: Netherland Meglitinide Market in APAC Volume (K Unit) Forecast, by Application 2019 & 2032
- Table 35: Nordics Meglitinide Market in APAC Revenue (Million) Forecast, by Application 2019 & 2032
- Table 36: Nordics Meglitinide Market in APAC Volume (K Unit) Forecast, by Application 2019 & 2032
- Table 37: Rest of Europe Meglitinide Market in APAC Revenue (Million) Forecast, by Application 2019 & 2032
- Table 38: Rest of Europe Meglitinide Market in APAC Volume (K Unit) Forecast, by Application 2019 & 2032
- Table 39: Global Meglitinide Market in APAC Revenue Million Forecast, by Country 2019 & 2032
- Table 40: Global Meglitinide Market in APAC Volume K Unit Forecast, by Country 2019 & 2032
- Table 41: China Meglitinide Market in APAC Revenue (Million) Forecast, by Application 2019 & 2032
- Table 42: China Meglitinide Market in APAC Volume (K Unit) Forecast, by Application 2019 & 2032
- Table 43: Japan Meglitinide Market in APAC Revenue (Million) Forecast, by Application 2019 & 2032
- Table 44: Japan Meglitinide Market in APAC Volume (K Unit) Forecast, by Application 2019 & 2032
- Table 45: India Meglitinide Market in APAC Revenue (Million) Forecast, by Application 2019 & 2032
- Table 46: India Meglitinide Market in APAC Volume (K Unit) Forecast, by Application 2019 & 2032
- Table 47: South Korea Meglitinide Market in APAC Revenue (Million) Forecast, by Application 2019 & 2032
- Table 48: South Korea Meglitinide Market in APAC Volume (K Unit) Forecast, by Application 2019 & 2032
- Table 49: Southeast Asia Meglitinide Market in APAC Revenue (Million) Forecast, by Application 2019 & 2032
- Table 50: Southeast Asia Meglitinide Market in APAC Volume (K Unit) Forecast, by Application 2019 & 2032
- Table 51: Australia Meglitinide Market in APAC Revenue (Million) Forecast, by Application 2019 & 2032
- Table 52: Australia Meglitinide Market in APAC Volume (K Unit) Forecast, by Application 2019 & 2032
- Table 53: Indonesia Meglitinide Market in APAC Revenue (Million) Forecast, by Application 2019 & 2032
- Table 54: Indonesia Meglitinide Market in APAC Volume (K Unit) Forecast, by Application 2019 & 2032
- Table 55: Phillipes Meglitinide Market in APAC Revenue (Million) Forecast, by Application 2019 & 2032
- Table 56: Phillipes Meglitinide Market in APAC Volume (K Unit) Forecast, by Application 2019 & 2032
- Table 57: Singapore Meglitinide Market in APAC Revenue (Million) Forecast, by Application 2019 & 2032
- Table 58: Singapore Meglitinide Market in APAC Volume (K Unit) Forecast, by Application 2019 & 2032
- Table 59: Thailandc Meglitinide Market in APAC Revenue (Million) Forecast, by Application 2019 & 2032
- Table 60: Thailandc Meglitinide Market in APAC Volume (K Unit) Forecast, by Application 2019 & 2032
- Table 61: Rest of Asia Pacific Meglitinide Market in APAC Revenue (Million) Forecast, by Application 2019 & 2032
- Table 62: Rest of Asia Pacific Meglitinide Market in APAC Volume (K Unit) Forecast, by Application 2019 & 2032
- Table 63: Global Meglitinide Market in APAC Revenue Million Forecast, by Country 2019 & 2032
- Table 64: Global Meglitinide Market in APAC Volume K Unit Forecast, by Country 2019 & 2032
- Table 65: Brazil Meglitinide Market in APAC Revenue (Million) Forecast, by Application 2019 & 2032
- Table 66: Brazil Meglitinide Market in APAC Volume (K Unit) Forecast, by Application 2019 & 2032
- Table 67: Argentina Meglitinide Market in APAC Revenue (Million) Forecast, by Application 2019 & 2032
- Table 68: Argentina Meglitinide Market in APAC Volume (K Unit) Forecast, by Application 2019 & 2032
- Table 69: Peru Meglitinide Market in APAC Revenue (Million) Forecast, by Application 2019 & 2032
- Table 70: Peru Meglitinide Market in APAC Volume (K Unit) Forecast, by Application 2019 & 2032
- Table 71: Chile Meglitinide Market in APAC Revenue (Million) Forecast, by Application 2019 & 2032
- Table 72: Chile Meglitinide Market in APAC Volume (K Unit) Forecast, by Application 2019 & 2032
- Table 73: Colombia Meglitinide Market in APAC Revenue (Million) Forecast, by Application 2019 & 2032
- Table 74: Colombia Meglitinide Market in APAC Volume (K Unit) Forecast, by Application 2019 & 2032
- Table 75: Ecuador Meglitinide Market in APAC Revenue (Million) Forecast, by Application 2019 & 2032
- Table 76: Ecuador Meglitinide Market in APAC Volume (K Unit) Forecast, by Application 2019 & 2032
- Table 77: Venezuela Meglitinide Market in APAC Revenue (Million) Forecast, by Application 2019 & 2032
- Table 78: Venezuela Meglitinide Market in APAC Volume (K Unit) Forecast, by Application 2019 & 2032
- Table 79: Rest of South America Meglitinide Market in APAC Revenue (Million) Forecast, by Application 2019 & 2032
- Table 80: Rest of South America Meglitinide Market in APAC Volume (K Unit) Forecast, by Application 2019 & 2032
- Table 81: Global Meglitinide Market in APAC Revenue Million Forecast, by Country 2019 & 2032
- Table 82: Global Meglitinide Market in APAC Volume K Unit Forecast, by Country 2019 & 2032
- Table 83: United States Meglitinide Market in APAC Revenue (Million) Forecast, by Application 2019 & 2032
- Table 84: United States Meglitinide Market in APAC Volume (K Unit) Forecast, by Application 2019 & 2032
- Table 85: Canada Meglitinide Market in APAC Revenue (Million) Forecast, by Application 2019 & 2032
- Table 86: Canada Meglitinide Market in APAC Volume (K Unit) Forecast, by Application 2019 & 2032
- Table 87: Mexico Meglitinide Market in APAC Revenue (Million) Forecast, by Application 2019 & 2032
- Table 88: Mexico Meglitinide Market in APAC Volume (K Unit) Forecast, by Application 2019 & 2032
- Table 89: Global Meglitinide Market in APAC Revenue Million Forecast, by Country 2019 & 2032
- Table 90: Global Meglitinide Market in APAC Volume K Unit Forecast, by Country 2019 & 2032
- Table 91: United Arab Emirates Meglitinide Market in APAC Revenue (Million) Forecast, by Application 2019 & 2032
- Table 92: United Arab Emirates Meglitinide Market in APAC Volume (K Unit) Forecast, by Application 2019 & 2032
- Table 93: Saudi Arabia Meglitinide Market in APAC Revenue (Million) Forecast, by Application 2019 & 2032
- Table 94: Saudi Arabia Meglitinide Market in APAC Volume (K Unit) Forecast, by Application 2019 & 2032
- Table 95: South Africa Meglitinide Market in APAC Revenue (Million) Forecast, by Application 2019 & 2032
- Table 96: South Africa Meglitinide Market in APAC Volume (K Unit) Forecast, by Application 2019 & 2032
- Table 97: Rest of Middle East and Africa Meglitinide Market in APAC Revenue (Million) Forecast, by Application 2019 & 2032
- Table 98: Rest of Middle East and Africa Meglitinide Market in APAC Volume (K Unit) Forecast, by Application 2019 & 2032
- Table 99: Global Meglitinide Market in APAC Revenue Million Forecast, by Drug 2019 & 2032
- Table 100: Global Meglitinide Market in APAC Volume K Unit Forecast, by Drug 2019 & 2032
- Table 101: Global Meglitinide Market in APAC Revenue Million Forecast, by Geography 2019 & 2032
- Table 102: Global Meglitinide Market in APAC Volume K Unit Forecast, by Geography 2019 & 2032
- Table 103: Global Meglitinide Market in APAC Revenue Million Forecast, by Country 2019 & 2032
- Table 104: Global Meglitinide Market in APAC Volume K Unit Forecast, by Country 2019 & 2032
- Table 105: Global Meglitinide Market in APAC Revenue Million Forecast, by Drug 2019 & 2032
- Table 106: Global Meglitinide Market in APAC Volume K Unit Forecast, by Drug 2019 & 2032
- Table 107: Global Meglitinide Market in APAC Revenue Million Forecast, by Geography 2019 & 2032
- Table 108: Global Meglitinide Market in APAC Volume K Unit Forecast, by Geography 2019 & 2032
- Table 109: Global Meglitinide Market in APAC Revenue Million Forecast, by Country 2019 & 2032
- Table 110: Global Meglitinide Market in APAC Volume K Unit Forecast, by Country 2019 & 2032
- Table 111: Global Meglitinide Market in APAC Revenue Million Forecast, by Drug 2019 & 2032
- Table 112: Global Meglitinide Market in APAC Volume K Unit Forecast, by Drug 2019 & 2032
- Table 113: Global Meglitinide Market in APAC Revenue Million Forecast, by Geography 2019 & 2032
- Table 114: Global Meglitinide Market in APAC Volume K Unit Forecast, by Geography 2019 & 2032
- Table 115: Global Meglitinide Market in APAC Revenue Million Forecast, by Country 2019 & 2032
- Table 116: Global Meglitinide Market in APAC Volume K Unit Forecast, by Country 2019 & 2032
- Table 117: Global Meglitinide Market in APAC Revenue Million Forecast, by Drug 2019 & 2032
- Table 118: Global Meglitinide Market in APAC Volume K Unit Forecast, by Drug 2019 & 2032
- Table 119: Global Meglitinide Market in APAC Revenue Million Forecast, by Geography 2019 & 2032
- Table 120: Global Meglitinide Market in APAC Volume K Unit Forecast, by Geography 2019 & 2032
- Table 121: Global Meglitinide Market in APAC Revenue Million Forecast, by Country 2019 & 2032
- Table 122: Global Meglitinide Market in APAC Volume K Unit Forecast, by Country 2019 & 2032
- Table 123: Global Meglitinide Market in APAC Revenue Million Forecast, by Drug 2019 & 2032
- Table 124: Global Meglitinide Market in APAC Volume K Unit Forecast, by Drug 2019 & 2032
- Table 125: Global Meglitinide Market in APAC Revenue Million Forecast, by Geography 2019 & 2032
- Table 126: Global Meglitinide Market in APAC Volume K Unit Forecast, by Geography 2019 & 2032
- Table 127: Global Meglitinide Market in APAC Revenue Million Forecast, by Country 2019 & 2032
- Table 128: Global Meglitinide Market in APAC Volume K Unit Forecast, by Country 2019 & 2032
- Table 129: Global Meglitinide Market in APAC Revenue Million Forecast, by Drug 2019 & 2032
- Table 130: Global Meglitinide Market in APAC Volume K Unit Forecast, by Drug 2019 & 2032
- Table 131: Global Meglitinide Market in APAC Revenue Million Forecast, by Geography 2019 & 2032
- Table 132: Global Meglitinide Market in APAC Volume K Unit Forecast, by Geography 2019 & 2032
- Table 133: Global Meglitinide Market in APAC Revenue Million Forecast, by Country 2019 & 2032
- Table 134: Global Meglitinide Market in APAC Volume K Unit Forecast, by Country 2019 & 2032
- Table 135: Global Meglitinide Market in APAC Revenue Million Forecast, by Drug 2019 & 2032
- Table 136: Global Meglitinide Market in APAC Volume K Unit Forecast, by Drug 2019 & 2032
- Table 137: Global Meglitinide Market in APAC Revenue Million Forecast, by Geography 2019 & 2032
- Table 138: Global Meglitinide Market in APAC Volume K Unit Forecast, by Geography 2019 & 2032
- Table 139: Global Meglitinide Market in APAC Revenue Million Forecast, by Country 2019 & 2032
- Table 140: Global Meglitinide Market in APAC Volume K Unit Forecast, by Country 2019 & 2032
- Table 141: Global Meglitinide Market in APAC Revenue Million Forecast, by Drug 2019 & 2032
- Table 142: Global Meglitinide Market in APAC Volume K Unit Forecast, by Drug 2019 & 2032
- Table 143: Global Meglitinide Market in APAC Revenue Million Forecast, by Geography 2019 & 2032
- Table 144: Global Meglitinide Market in APAC Volume K Unit Forecast, by Geography 2019 & 2032
- Table 145: Global Meglitinide Market in APAC Revenue Million Forecast, by Country 2019 & 2032
- Table 146: Global Meglitinide Market in APAC Volume K Unit Forecast, by Country 2019 & 2032
- Table 147: Global Meglitinide Market in APAC Revenue Million Forecast, by Drug 2019 & 2032
- Table 148: Global Meglitinide Market in APAC Volume K Unit Forecast, by Drug 2019 & 2032
- Table 149: Global Meglitinide Market in APAC Revenue Million Forecast, by Geography 2019 & 2032
- Table 150: Global Meglitinide Market in APAC Volume K Unit Forecast, by Geography 2019 & 2032
- Table 151: Global Meglitinide Market in APAC Revenue Million Forecast, by Country 2019 & 2032
- Table 152: Global Meglitinide Market in APAC Volume K Unit Forecast, by Country 2019 & 2032
- Table 153: Global Meglitinide Market in APAC Revenue Million Forecast, by Drug 2019 & 2032
- Table 154: Global Meglitinide Market in APAC Volume K Unit Forecast, by Drug 2019 & 2032
- Table 155: Global Meglitinide Market in APAC Revenue Million Forecast, by Geography 2019 & 2032
- Table 156: Global Meglitinide Market in APAC Volume K Unit Forecast, by Geography 2019 & 2032
- Table 157: Global Meglitinide Market in APAC Revenue Million Forecast, by Country 2019 & 2032
- Table 158: Global Meglitinide Market in APAC Volume K Unit Forecast, by Country 2019 & 2032
Frequently Asked Questions
1. What is the projected Compound Annual Growth Rate (CAGR) of the Meglitinide Market in APAC?
The projected CAGR is approximately 1.70%.
2. Which companies are prominent players in the Meglitinide Market in APAC?
Key companies in the market include Novartis, Biocon, Glenmark, Novo Nordisk, Kissei Pharmaceuticals, Boehringer Ingelheim.
3. What are the main segments of the Meglitinide Market in APAC?
The market segments include Drug, Geography.
4. Can you provide details about the market size?
The market size is estimated to be USD XX Million as of 2022.
5. What are some drivers contributing to market growth?
; The Rise in Global Prevalence of Cases of Obesity due to Modern Sedentary Lifestyles; Rise in Awareness and Disposable Income in Developed Economies.
6. What are the notable trends driving market growth?
Rising Diabetes Prevalence in Asia-Pacific Region.
7. Are there any restraints impacting market growth?
; Highly Cost of Branded Products in Emerging Countries; Severe Adverse Associated with Medication Including Seizures. Suicidal Attempts and Even Death; Adoption of Traditional Yoga and Herbal Products.
8. Can you provide examples of recent developments in the market?
March 2023: A randomized, open-label, controlled, parallel-group, multicenter trial was conducted to evaluate the efficacy and safety of INS068 once daily (QD) in subjects with type-2 diabetes. It is not adequately controlled with oral antidiabetic drugs compared to insulin Glargine QD for 26+26 weeks.
9. What pricing options are available for accessing the report?
Pricing options include single-user, multi-user, and enterprise licenses priced at USD 4750, USD 5250, and USD 8750 respectively.
10. Is the market size provided in terms of value or volume?
The market size is provided in terms of value, measured in Million and volume, measured in K Unit.
11. Are there any specific market keywords associated with the report?
Yes, the market keyword associated with the report is "Meglitinide Market in APAC," which aids in identifying and referencing the specific market segment covered.
12. How do I determine which pricing option suits my needs best?
The pricing options vary based on user requirements and access needs. Individual users may opt for single-user licenses, while businesses requiring broader access may choose multi-user or enterprise licenses for cost-effective access to the report.
13. Are there any additional resources or data provided in the Meglitinide Market in APAC report?
While the report offers comprehensive insights, it's advisable to review the specific contents or supplementary materials provided to ascertain if additional resources or data are available.
14. How can I stay updated on further developments or reports in the Meglitinide Market in APAC?
To stay informed about further developments, trends, and reports in the Meglitinide Market in APAC, consider subscribing to industry newsletters, following relevant companies and organizations, or regularly checking reputable industry news sources and publications.
Methodology
Step 1 - Identification of Relevant Samples Size from Population Database


Step 2 - Approaches for Defining Global Market Size (Value, Volume* & Price*)

Note*: In applicable scenarios
Step 3 - Data Sources
Primary Research
- Web Analytics
- Survey Reports
- Research Institute
- Latest Research Reports
- Opinion Leaders
Secondary Research
- Annual Reports
- White Paper
- Latest Press Release
- Industry Association
- Paid Database
- Investor Presentations

Step 4 - Data Triangulation
Involves using different sources of information in order to increase the validity of a study
These sources are likely to be stakeholders in a program - participants, other researchers, program staff, other community members, and so on.
Then we put all data in single framework & apply various statistical tools to find out the dynamic on the market.
During the analysis stage, feedback from the stakeholder groups would be compared to determine areas of agreement as well as areas of divergence


