


Key Insights
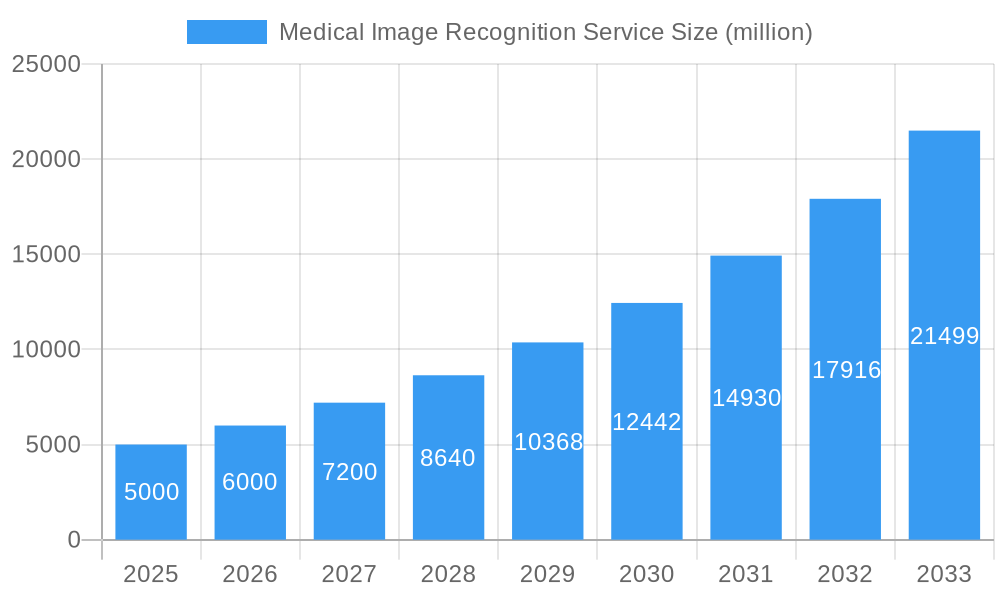
The medical image recognition service market is experiencing robust growth, driven by the increasing volume of medical images generated globally, advancements in artificial intelligence (AI) and machine learning (ML) algorithms, and a rising demand for improved diagnostic accuracy and efficiency. The market, estimated at $5 billion in 2025, is projected to exhibit a Compound Annual Growth Rate (CAGR) of 20% from 2025 to 2033, reaching approximately $20 billion by 2033. Key drivers include the increasing prevalence of chronic diseases necessitating frequent imaging, the integration of AI-powered solutions into existing healthcare workflows, and the growing adoption of cloud-based image analysis platforms enabling remote diagnostics and collaborative care. Significant technological advancements, such as deep learning models capable of identifying subtle anomalies and improving the speed and accuracy of diagnoses are further fueling market expansion. However, challenges remain, including data privacy and security concerns, regulatory hurdles in the adoption of AI-powered medical devices, and the need for robust validation and clinical trials to ensure the reliability of AI-driven diagnostic tools. The market is segmented by technology (deep learning, convolutional neural networks), application (radiology, pathology, ophthalmology), and end-user (hospitals, clinics, diagnostic centers). Major players like Microsoft, NVIDIA, IBM, and Google are actively investing in research and development, driving innovation and competition within the sector. The competitive landscape is marked by a blend of established tech giants and specialized medical AI companies, leading to a dynamic and rapidly evolving market.
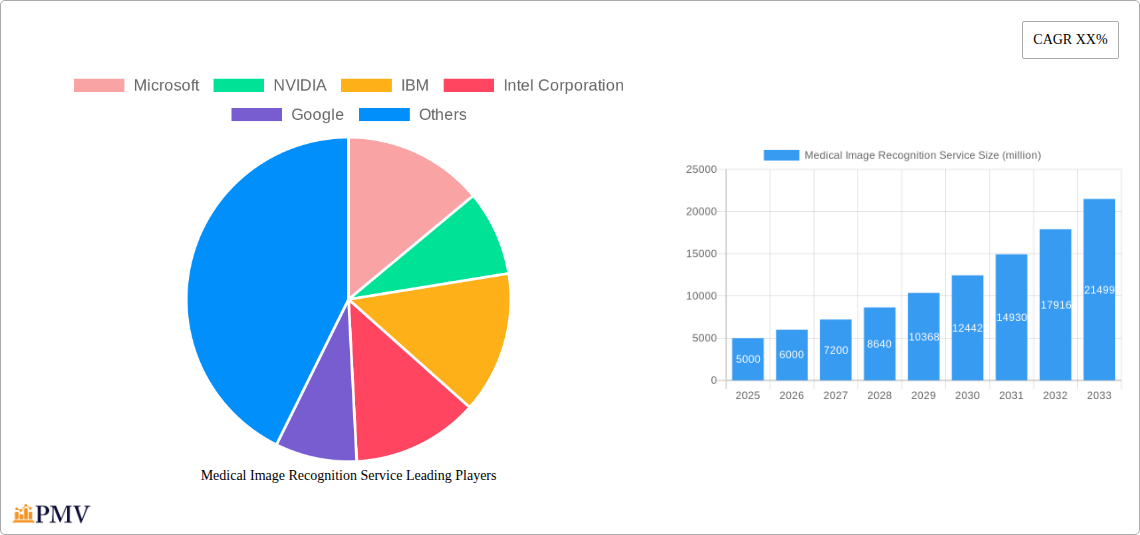
Medical Image Recognition Service Market Size (In Billion)

The success of the medical image recognition service market hinges on addressing the identified restraints effectively. Strategies for mitigating data security risks, navigating regulatory approvals, and demonstrating the clinical efficacy of AI-powered diagnostic tools are crucial for sustainable market growth. Furthermore, efforts to educate healthcare professionals about the benefits and limitations of AI in medical imaging, and to establish standardized protocols for data annotation and model validation, will be essential for broad market adoption. A focus on interoperability and seamless integration of AI solutions within existing healthcare systems will also play a vital role in driving market expansion. Future growth will likely be driven by the development of more sophisticated algorithms capable of handling diverse image modalities, personalized medicine applications, and the increasing use of AI for preventative care.
Medical Image Recognition Service Company Market Share
Medical Image Recognition Service Market Report: 2019-2033
This comprehensive report provides a detailed analysis of the Medical Image Recognition Service market, projecting a market value exceeding $XX million by 2033. The study covers the period from 2019 to 2033, with a base year of 2025 and a forecast period of 2025-2033. It offers actionable insights for industry stakeholders, including technology providers, healthcare institutions, and investors.
Medical Image Recognition Service Market Structure & Competitive Dynamics
The Medical Image Recognition Service market is characterized by a dynamic interplay of established tech giants and emerging AI-focused companies. Market concentration is moderate, with a few dominant players like Microsoft, NVIDIA, and IBM holding significant shares, estimated at xx%, xx%, and xx%, respectively, in 2025. However, a large number of smaller, specialized firms are driving innovation, particularly in niche applications. The regulatory landscape, while evolving, is generally supportive of AI adoption in healthcare, but with varying degrees of stringency across different regions. This leads to regional variations in market penetration. Product substitutes, such as traditional manual image analysis, are gradually losing ground due to the increasing efficiency and accuracy of AI-powered solutions. End-user trends indicate a strong preference for automated, data-driven diagnostic tools that improve efficiency and accuracy. M&A activity has been significant, with several multi-million dollar deals in the historical period (2019-2024), totaling approximately $XX million. These acquisitions have focused primarily on consolidating expertise in specific image modalities or expanding geographic reach. For instance, the acquisition of [Company X] by [Company Y] in [Year] for $XX million expanded [Company Y]'s capabilities in [Specific area].
Medical Image Recognition Service Industry Trends & Insights
The Medical Image Recognition Service market is experiencing robust growth, driven by several key factors. The increasing prevalence of chronic diseases, coupled with the growing volume of medical images generated globally, fuels the demand for efficient and accurate diagnostic tools. Technological advancements, particularly in deep learning and convolutional neural networks (CNNs), are continually improving the accuracy and speed of image analysis. The market is witnessing a surge in cloud-based solutions, enabling cost-effective access to powerful computational resources. Consumer preferences are shifting towards personalized and proactive healthcare, contributing to the demand for AI-powered diagnostics that offer faster and more accurate results. The market is projected to experience a Compound Annual Growth Rate (CAGR) of xx% during the forecast period (2025-2033), with market penetration expected to reach xx% by 2033. Competitive dynamics are marked by fierce competition among established players and innovative startups, spurring continuous improvements in algorithm performance and user experience. Furthermore, the integration of AI into existing clinical workflows is creating new opportunities for market expansion.
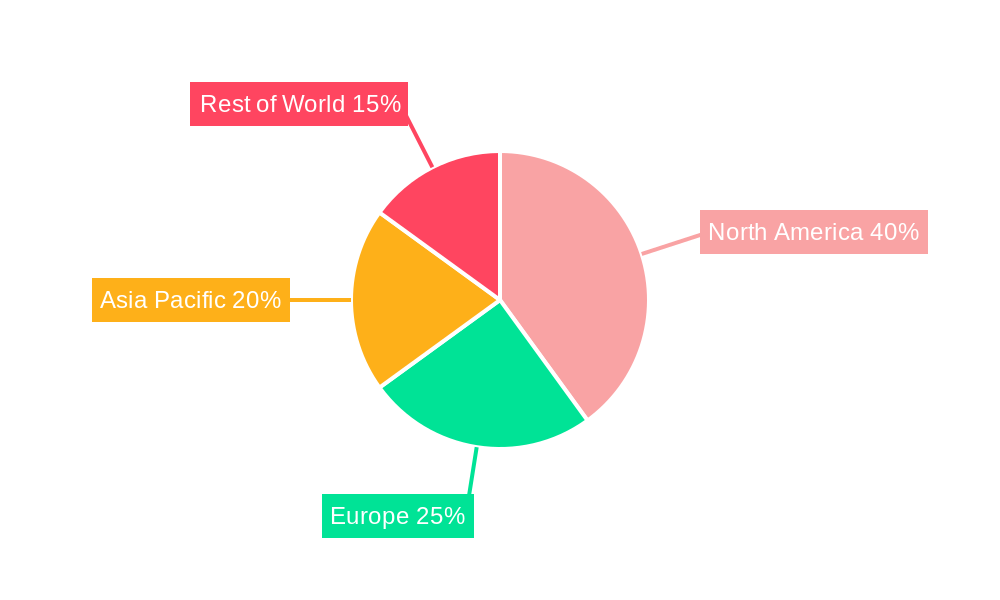
Dominant Markets & Segments in Medical Image Recognition Service
The North American market currently holds the largest share of the Medical Image Recognition Service market, driven by factors such as advanced healthcare infrastructure, high adoption rates of new technologies, and robust funding for AI research.
- Key Drivers in North America:
- Well-established healthcare infrastructure.
- High levels of venture capital funding in AI and healthcare.
- Stringent regulatory frameworks driving quality and adoption of advanced technology.
- High prevalence of chronic diseases.
Detailed dominance analysis indicates that the US specifically contributes the largest portion to this segment owing to its extensive healthcare system, greater technological adoption rate and favorable regulatory environment. Europe follows, exhibiting significant growth potential driven by increasing government investments in digital health initiatives and the expanding prevalence of chronic diseases. However, regional variations exist due to differences in healthcare systems, regulatory landscapes, and levels of technological adoption. The Asia-Pacific region is expected to witness substantial growth in the coming years, fuelled by increasing healthcare spending, rising technological awareness and a large population base.
Medical Image Recognition Service Product Innovations
Recent product innovations focus on enhancing the accuracy, speed, and accessibility of medical image recognition services. This includes the development of more sophisticated deep learning algorithms, improved user interfaces, and the integration of these services into existing Electronic Health Record (EHR) systems. The market is also seeing a rise in specialized solutions targeting specific medical conditions or image modalities. The competitive advantage hinges on superior algorithm performance, integration capabilities, and ease of use for clinicians. This evolution caters to the growing demand for quicker diagnosis and better patient outcomes.
Report Segmentation & Scope
This report segments the Medical Image Recognition Service market based on several factors:
By Modality: X-ray, CT Scan, MRI, Ultrasound, PET Scan, etc. Each modality presents unique challenges and opportunities, with growth projections varying accordingly. Competitive dynamics differ significantly based on the specific modality, with some areas exhibiting higher levels of consolidation than others.
By Application: Oncology, Cardiology, Radiology, Neurology, etc. Different applications have distinct requirements in terms of algorithm performance and data annotation, leading to variations in market size and competitive landscapes.
By End-User: Hospitals, Clinics, Diagnostic Centers, Research Institutes, etc. The needs and purchasing patterns of different end-users significantly influence market dynamics. For instance, large hospital chains may have different procurement processes than smaller clinics.
Key Drivers of Medical Image Recognition Service Growth
Several factors are driving the growth of the Medical Image Recognition Service market. Advancements in artificial intelligence and deep learning are constantly enhancing the accuracy and efficiency of image analysis. The increasing availability of large, annotated medical image datasets is crucial for training sophisticated algorithms. Government initiatives promoting digital health and AI adoption are creating a favorable regulatory environment. Furthermore, cost reductions in computing power and storage are making AI-based solutions more accessible to a broader range of healthcare providers.
Challenges in the Medical Image Recognition Service Sector
Despite its growth potential, the Medical Image Recognition Service sector faces several challenges. Regulatory hurdles surrounding data privacy and algorithm validation pose significant barriers to market entry and expansion. The availability of high-quality, labeled data for training algorithms is limited. Data security and patient privacy are major concerns that need careful attention. The high cost of developing and deploying AI-based solutions can limit adoption, particularly in resource-constrained settings. Competition among various companies is intense, leading to price pressure and the need for continuous innovation.
Leading Players in the Medical Image Recognition Service Market
- Microsoft
- NVIDIA
- IBM
- Intel Corporation
- Google, Inc
- Siemens Healthineers
- GE Healthcare
- Digital Diagnostics, Inc
- Xilinx
- InformAI LLC
- HeartFlow, Inc
- Enlitic, Inc
- Aidence
- Shukun Technology
- Hui Yi Hui Ying
- Quasi-intelligence
- SenseTime Group Co., Ltd
- Yasen Technology
- Haina Medical Letter
- CR Miles Cloud
- Wingspan technology
- Associate Healthcare
- Heart Doctor International
- Kangzhong Optics
Key Developments in Medical Image Recognition Service Sector
- 2022, Q4: Google released an updated version of its medical image analysis algorithm, significantly improving accuracy in detecting [Specific condition].
- 2023, Q1: Siemens Healthineers and NVIDIA announced a partnership to develop a new AI-powered diagnostic platform.
- 2024, Q2: A major acquisition in the medical image analysis sector resulted in [Company X] acquiring [Company Y] for $XX million.
Strategic Medical Image Recognition Service Market Outlook
The future of the Medical Image Recognition Service market appears bright, with continued growth driven by technological innovation, increasing demand for efficient healthcare solutions, and supportive regulatory frameworks. Strategic opportunities lie in developing specialized solutions for niche applications, improving algorithm robustness and explainability, and fostering collaborations between technology companies and healthcare providers. The market's evolution will depend on addressing the challenges related to data privacy, regulatory compliance, and accessibility, particularly in low-resource settings. The continued focus on improving accuracy, reducing costs, and simplifying user interfaces will unlock further market penetration and growth.
Medical Image Recognition Service Segmentation
-
1. Application
- 1.1. Hospital
- 1.2. Clinic
-
2. Types
- 2.1. Radiology Image
- 2.2. Neurology Image
Medical Image Recognition Service Segmentation By Geography
-
1. North America
- 1.1. United States
- 1.2. Canada
- 1.3. Mexico
-
2. South America
- 2.1. Brazil
- 2.2. Argentina
- 2.3. Rest of South America
-
3. Europe
- 3.1. United Kingdom
- 3.2. Germany
- 3.3. France
- 3.4. Italy
- 3.5. Spain
- 3.6. Russia
- 3.7. Benelux
- 3.8. Nordics
- 3.9. Rest of Europe
-
4. Middle East & Africa
- 4.1. Turkey
- 4.2. Israel
- 4.3. GCC
- 4.4. North Africa
- 4.5. South Africa
- 4.6. Rest of Middle East & Africa
-
5. Asia Pacific
- 5.1. China
- 5.2. India
- 5.3. Japan
- 5.4. South Korea
- 5.5. ASEAN
- 5.6. Oceania
- 5.7. Rest of Asia Pacific
Medical Image Recognition Service Regional Market Share
Geographic Coverage of Medical Image Recognition Service
Medical Image Recognition Service REPORT HIGHLIGHTS
| Aspects | Details |
|---|---|
| Study Period | 2020-2034 |
| Base Year | 2025 |
| Estimated Year | 2026 |
| Forecast Period | 2026-2034 |
| Historical Period | 2020-2025 |
| Growth Rate | CAGR of 5.35% from 2020-2034 |
| Segmentation |
|
Table of Contents
- 1. Introduction
- 1.1. Research Scope
- 1.2. Market Segmentation
- 1.3. Research Methodology
- 1.4. Definitions and Assumptions
- 2. Executive Summary
- 2.1. Introduction
- 3. Market Dynamics
- 3.1. Introduction
- 3.2. Market Drivers
- 3.3. Market Restrains
- 3.4. Market Trends
- 4. Market Factor Analysis
- 4.1. Porters Five Forces
- 4.2. Supply/Value Chain
- 4.3. PESTEL analysis
- 4.4. Market Entropy
- 4.5. Patent/Trademark Analysis
- 5. Global Medical Image Recognition Service Analysis, Insights and Forecast, 2020-2032
- 5.1. Market Analysis, Insights and Forecast - by Application
- 5.1.1. Hospital
- 5.1.2. Clinic
- 5.2. Market Analysis, Insights and Forecast - by Types
- 5.2.1. Radiology Image
- 5.2.2. Neurology Image
- 5.3. Market Analysis, Insights and Forecast - by Region
- 5.3.1. North America
- 5.3.2. South America
- 5.3.3. Europe
- 5.3.4. Middle East & Africa
- 5.3.5. Asia Pacific
- 5.1. Market Analysis, Insights and Forecast - by Application
- 6. North America Medical Image Recognition Service Analysis, Insights and Forecast, 2020-2032
- 6.1. Market Analysis, Insights and Forecast - by Application
- 6.1.1. Hospital
- 6.1.2. Clinic
- 6.2. Market Analysis, Insights and Forecast - by Types
- 6.2.1. Radiology Image
- 6.2.2. Neurology Image
- 6.1. Market Analysis, Insights and Forecast - by Application
- 7. South America Medical Image Recognition Service Analysis, Insights and Forecast, 2020-2032
- 7.1. Market Analysis, Insights and Forecast - by Application
- 7.1.1. Hospital
- 7.1.2. Clinic
- 7.2. Market Analysis, Insights and Forecast - by Types
- 7.2.1. Radiology Image
- 7.2.2. Neurology Image
- 7.1. Market Analysis, Insights and Forecast - by Application
- 8. Europe Medical Image Recognition Service Analysis, Insights and Forecast, 2020-2032
- 8.1. Market Analysis, Insights and Forecast - by Application
- 8.1.1. Hospital
- 8.1.2. Clinic
- 8.2. Market Analysis, Insights and Forecast - by Types
- 8.2.1. Radiology Image
- 8.2.2. Neurology Image
- 8.1. Market Analysis, Insights and Forecast - by Application
- 9. Middle East & Africa Medical Image Recognition Service Analysis, Insights and Forecast, 2020-2032
- 9.1. Market Analysis, Insights and Forecast - by Application
- 9.1.1. Hospital
- 9.1.2. Clinic
- 9.2. Market Analysis, Insights and Forecast - by Types
- 9.2.1. Radiology Image
- 9.2.2. Neurology Image
- 9.1. Market Analysis, Insights and Forecast - by Application
- 10. Asia Pacific Medical Image Recognition Service Analysis, Insights and Forecast, 2020-2032
- 10.1. Market Analysis, Insights and Forecast - by Application
- 10.1.1. Hospital
- 10.1.2. Clinic
- 10.2. Market Analysis, Insights and Forecast - by Types
- 10.2.1. Radiology Image
- 10.2.2. Neurology Image
- 10.1. Market Analysis, Insights and Forecast - by Application
- 11. Competitive Analysis
- 11.1. Global Market Share Analysis 2025
- 11.2. Company Profiles
- 11.2.1 Microsoft
- 11.2.1.1. Overview
- 11.2.1.2. Products
- 11.2.1.3. SWOT Analysis
- 11.2.1.4. Recent Developments
- 11.2.1.5. Financials (Based on Availability)
- 11.2.2 NVIDIA
- 11.2.2.1. Overview
- 11.2.2.2. Products
- 11.2.2.3. SWOT Analysis
- 11.2.2.4. Recent Developments
- 11.2.2.5. Financials (Based on Availability)
- 11.2.3 IBM
- 11.2.3.1. Overview
- 11.2.3.2. Products
- 11.2.3.3. SWOT Analysis
- 11.2.3.4. Recent Developments
- 11.2.3.5. Financials (Based on Availability)
- 11.2.4 Intel Corporation
- 11.2.4.1. Overview
- 11.2.4.2. Products
- 11.2.4.3. SWOT Analysis
- 11.2.4.4. Recent Developments
- 11.2.4.5. Financials (Based on Availability)
- 11.2.5 Google
- 11.2.5.1. Overview
- 11.2.5.2. Products
- 11.2.5.3. SWOT Analysis
- 11.2.5.4. Recent Developments
- 11.2.5.5. Financials (Based on Availability)
- 11.2.6 Inc
- 11.2.6.1. Overview
- 11.2.6.2. Products
- 11.2.6.3. SWOT Analysis
- 11.2.6.4. Recent Developments
- 11.2.6.5. Financials (Based on Availability)
- 11.2.7 Siemens Healthineers
- 11.2.7.1. Overview
- 11.2.7.2. Products
- 11.2.7.3. SWOT Analysis
- 11.2.7.4. Recent Developments
- 11.2.7.5. Financials (Based on Availability)
- 11.2.8 GE Healthcare
- 11.2.8.1. Overview
- 11.2.8.2. Products
- 11.2.8.3. SWOT Analysis
- 11.2.8.4. Recent Developments
- 11.2.8.5. Financials (Based on Availability)
- 11.2.9 Digital Diagnostics
- 11.2.9.1. Overview
- 11.2.9.2. Products
- 11.2.9.3. SWOT Analysis
- 11.2.9.4. Recent Developments
- 11.2.9.5. Financials (Based on Availability)
- 11.2.10 Inc
- 11.2.10.1. Overview
- 11.2.10.2. Products
- 11.2.10.3. SWOT Analysis
- 11.2.10.4. Recent Developments
- 11.2.10.5. Financials (Based on Availability)
- 11.2.11 Xilinx
- 11.2.11.1. Overview
- 11.2.11.2. Products
- 11.2.11.3. SWOT Analysis
- 11.2.11.4. Recent Developments
- 11.2.11.5. Financials (Based on Availability)
- 11.2.12 InformAI LLC
- 11.2.12.1. Overview
- 11.2.12.2. Products
- 11.2.12.3. SWOT Analysis
- 11.2.12.4. Recent Developments
- 11.2.12.5. Financials (Based on Availability)
- 11.2.13 HeartFlow
- 11.2.13.1. Overview
- 11.2.13.2. Products
- 11.2.13.3. SWOT Analysis
- 11.2.13.4. Recent Developments
- 11.2.13.5. Financials (Based on Availability)
- 11.2.14 Inc
- 11.2.14.1. Overview
- 11.2.14.2. Products
- 11.2.14.3. SWOT Analysis
- 11.2.14.4. Recent Developments
- 11.2.14.5. Financials (Based on Availability)
- 11.2.15 Enlitic
- 11.2.15.1. Overview
- 11.2.15.2. Products
- 11.2.15.3. SWOT Analysis
- 11.2.15.4. Recent Developments
- 11.2.15.5. Financials (Based on Availability)
- 11.2.16 Inc
- 11.2.16.1. Overview
- 11.2.16.2. Products
- 11.2.16.3. SWOT Analysis
- 11.2.16.4. Recent Developments
- 11.2.16.5. Financials (Based on Availability)
- 11.2.17 Aidence
- 11.2.17.1. Overview
- 11.2.17.2. Products
- 11.2.17.3. SWOT Analysis
- 11.2.17.4. Recent Developments
- 11.2.17.5. Financials (Based on Availability)
- 11.2.18 Shukun Technology
- 11.2.18.1. Overview
- 11.2.18.2. Products
- 11.2.18.3. SWOT Analysis
- 11.2.18.4. Recent Developments
- 11.2.18.5. Financials (Based on Availability)
- 11.2.19 Hui Yi Hui Ying
- 11.2.19.1. Overview
- 11.2.19.2. Products
- 11.2.19.3. SWOT Analysis
- 11.2.19.4. Recent Developments
- 11.2.19.5. Financials (Based on Availability)
- 11.2.20 Quasi-intelligence
- 11.2.20.1. Overview
- 11.2.20.2. Products
- 11.2.20.3. SWOT Analysis
- 11.2.20.4. Recent Developments
- 11.2.20.5. Financials (Based on Availability)
- 11.2.21 SenseTime Group Co.
- 11.2.21.1. Overview
- 11.2.21.2. Products
- 11.2.21.3. SWOT Analysis
- 11.2.21.4. Recent Developments
- 11.2.21.5. Financials (Based on Availability)
- 11.2.22 Ltd
- 11.2.22.1. Overview
- 11.2.22.2. Products
- 11.2.22.3. SWOT Analysis
- 11.2.22.4. Recent Developments
- 11.2.22.5. Financials (Based on Availability)
- 11.2.23 Yasen Technology
- 11.2.23.1. Overview
- 11.2.23.2. Products
- 11.2.23.3. SWOT Analysis
- 11.2.23.4. Recent Developments
- 11.2.23.5. Financials (Based on Availability)
- 11.2.24 Haina Medical Letter
- 11.2.24.1. Overview
- 11.2.24.2. Products
- 11.2.24.3. SWOT Analysis
- 11.2.24.4. Recent Developments
- 11.2.24.5. Financials (Based on Availability)
- 11.2.25 CR Miles Cloud
- 11.2.25.1. Overview
- 11.2.25.2. Products
- 11.2.25.3. SWOT Analysis
- 11.2.25.4. Recent Developments
- 11.2.25.5. Financials (Based on Availability)
- 11.2.26 Wingspan technology
- 11.2.26.1. Overview
- 11.2.26.2. Products
- 11.2.26.3. SWOT Analysis
- 11.2.26.4. Recent Developments
- 11.2.26.5. Financials (Based on Availability)
- 11.2.27 Associate Healthcare
- 11.2.27.1. Overview
- 11.2.27.2. Products
- 11.2.27.3. SWOT Analysis
- 11.2.27.4. Recent Developments
- 11.2.27.5. Financials (Based on Availability)
- 11.2.28 Heart Doctor International
- 11.2.28.1. Overview
- 11.2.28.2. Products
- 11.2.28.3. SWOT Analysis
- 11.2.28.4. Recent Developments
- 11.2.28.5. Financials (Based on Availability)
- 11.2.29 Kangzhong Optics
- 11.2.29.1. Overview
- 11.2.29.2. Products
- 11.2.29.3. SWOT Analysis
- 11.2.29.4. Recent Developments
- 11.2.29.5. Financials (Based on Availability)
- 11.2.1 Microsoft
List of Figures
- Figure 1: Global Medical Image Recognition Service Revenue Breakdown (undefined, %) by Region 2025 & 2033
- Figure 2: North America Medical Image Recognition Service Revenue (undefined), by Application 2025 & 2033
- Figure 3: North America Medical Image Recognition Service Revenue Share (%), by Application 2025 & 2033
- Figure 4: North America Medical Image Recognition Service Revenue (undefined), by Types 2025 & 2033
- Figure 5: North America Medical Image Recognition Service Revenue Share (%), by Types 2025 & 2033
- Figure 6: North America Medical Image Recognition Service Revenue (undefined), by Country 2025 & 2033
- Figure 7: North America Medical Image Recognition Service Revenue Share (%), by Country 2025 & 2033
- Figure 8: South America Medical Image Recognition Service Revenue (undefined), by Application 2025 & 2033
- Figure 9: South America Medical Image Recognition Service Revenue Share (%), by Application 2025 & 2033
- Figure 10: South America Medical Image Recognition Service Revenue (undefined), by Types 2025 & 2033
- Figure 11: South America Medical Image Recognition Service Revenue Share (%), by Types 2025 & 2033
- Figure 12: South America Medical Image Recognition Service Revenue (undefined), by Country 2025 & 2033
- Figure 13: South America Medical Image Recognition Service Revenue Share (%), by Country 2025 & 2033
- Figure 14: Europe Medical Image Recognition Service Revenue (undefined), by Application 2025 & 2033
- Figure 15: Europe Medical Image Recognition Service Revenue Share (%), by Application 2025 & 2033
- Figure 16: Europe Medical Image Recognition Service Revenue (undefined), by Types 2025 & 2033
- Figure 17: Europe Medical Image Recognition Service Revenue Share (%), by Types 2025 & 2033
- Figure 18: Europe Medical Image Recognition Service Revenue (undefined), by Country 2025 & 2033
- Figure 19: Europe Medical Image Recognition Service Revenue Share (%), by Country 2025 & 2033
- Figure 20: Middle East & Africa Medical Image Recognition Service Revenue (undefined), by Application 2025 & 2033
- Figure 21: Middle East & Africa Medical Image Recognition Service Revenue Share (%), by Application 2025 & 2033
- Figure 22: Middle East & Africa Medical Image Recognition Service Revenue (undefined), by Types 2025 & 2033
- Figure 23: Middle East & Africa Medical Image Recognition Service Revenue Share (%), by Types 2025 & 2033
- Figure 24: Middle East & Africa Medical Image Recognition Service Revenue (undefined), by Country 2025 & 2033
- Figure 25: Middle East & Africa Medical Image Recognition Service Revenue Share (%), by Country 2025 & 2033
- Figure 26: Asia Pacific Medical Image Recognition Service Revenue (undefined), by Application 2025 & 2033
- Figure 27: Asia Pacific Medical Image Recognition Service Revenue Share (%), by Application 2025 & 2033
- Figure 28: Asia Pacific Medical Image Recognition Service Revenue (undefined), by Types 2025 & 2033
- Figure 29: Asia Pacific Medical Image Recognition Service Revenue Share (%), by Types 2025 & 2033
- Figure 30: Asia Pacific Medical Image Recognition Service Revenue (undefined), by Country 2025 & 2033
- Figure 31: Asia Pacific Medical Image Recognition Service Revenue Share (%), by Country 2025 & 2033
List of Tables
- Table 1: Global Medical Image Recognition Service Revenue undefined Forecast, by Application 2020 & 2033
- Table 2: Global Medical Image Recognition Service Revenue undefined Forecast, by Types 2020 & 2033
- Table 3: Global Medical Image Recognition Service Revenue undefined Forecast, by Region 2020 & 2033
- Table 4: Global Medical Image Recognition Service Revenue undefined Forecast, by Application 2020 & 2033
- Table 5: Global Medical Image Recognition Service Revenue undefined Forecast, by Types 2020 & 2033
- Table 6: Global Medical Image Recognition Service Revenue undefined Forecast, by Country 2020 & 2033
- Table 7: United States Medical Image Recognition Service Revenue (undefined) Forecast, by Application 2020 & 2033
- Table 8: Canada Medical Image Recognition Service Revenue (undefined) Forecast, by Application 2020 & 2033
- Table 9: Mexico Medical Image Recognition Service Revenue (undefined) Forecast, by Application 2020 & 2033
- Table 10: Global Medical Image Recognition Service Revenue undefined Forecast, by Application 2020 & 2033
- Table 11: Global Medical Image Recognition Service Revenue undefined Forecast, by Types 2020 & 2033
- Table 12: Global Medical Image Recognition Service Revenue undefined Forecast, by Country 2020 & 2033
- Table 13: Brazil Medical Image Recognition Service Revenue (undefined) Forecast, by Application 2020 & 2033
- Table 14: Argentina Medical Image Recognition Service Revenue (undefined) Forecast, by Application 2020 & 2033
- Table 15: Rest of South America Medical Image Recognition Service Revenue (undefined) Forecast, by Application 2020 & 2033
- Table 16: Global Medical Image Recognition Service Revenue undefined Forecast, by Application 2020 & 2033
- Table 17: Global Medical Image Recognition Service Revenue undefined Forecast, by Types 2020 & 2033
- Table 18: Global Medical Image Recognition Service Revenue undefined Forecast, by Country 2020 & 2033
- Table 19: United Kingdom Medical Image Recognition Service Revenue (undefined) Forecast, by Application 2020 & 2033
- Table 20: Germany Medical Image Recognition Service Revenue (undefined) Forecast, by Application 2020 & 2033
- Table 21: France Medical Image Recognition Service Revenue (undefined) Forecast, by Application 2020 & 2033
- Table 22: Italy Medical Image Recognition Service Revenue (undefined) Forecast, by Application 2020 & 2033
- Table 23: Spain Medical Image Recognition Service Revenue (undefined) Forecast, by Application 2020 & 2033
- Table 24: Russia Medical Image Recognition Service Revenue (undefined) Forecast, by Application 2020 & 2033
- Table 25: Benelux Medical Image Recognition Service Revenue (undefined) Forecast, by Application 2020 & 2033
- Table 26: Nordics Medical Image Recognition Service Revenue (undefined) Forecast, by Application 2020 & 2033
- Table 27: Rest of Europe Medical Image Recognition Service Revenue (undefined) Forecast, by Application 2020 & 2033
- Table 28: Global Medical Image Recognition Service Revenue undefined Forecast, by Application 2020 & 2033
- Table 29: Global Medical Image Recognition Service Revenue undefined Forecast, by Types 2020 & 2033
- Table 30: Global Medical Image Recognition Service Revenue undefined Forecast, by Country 2020 & 2033
- Table 31: Turkey Medical Image Recognition Service Revenue (undefined) Forecast, by Application 2020 & 2033
- Table 32: Israel Medical Image Recognition Service Revenue (undefined) Forecast, by Application 2020 & 2033
- Table 33: GCC Medical Image Recognition Service Revenue (undefined) Forecast, by Application 2020 & 2033
- Table 34: North Africa Medical Image Recognition Service Revenue (undefined) Forecast, by Application 2020 & 2033
- Table 35: South Africa Medical Image Recognition Service Revenue (undefined) Forecast, by Application 2020 & 2033
- Table 36: Rest of Middle East & Africa Medical Image Recognition Service Revenue (undefined) Forecast, by Application 2020 & 2033
- Table 37: Global Medical Image Recognition Service Revenue undefined Forecast, by Application 2020 & 2033
- Table 38: Global Medical Image Recognition Service Revenue undefined Forecast, by Types 2020 & 2033
- Table 39: Global Medical Image Recognition Service Revenue undefined Forecast, by Country 2020 & 2033
- Table 40: China Medical Image Recognition Service Revenue (undefined) Forecast, by Application 2020 & 2033
- Table 41: India Medical Image Recognition Service Revenue (undefined) Forecast, by Application 2020 & 2033
- Table 42: Japan Medical Image Recognition Service Revenue (undefined) Forecast, by Application 2020 & 2033
- Table 43: South Korea Medical Image Recognition Service Revenue (undefined) Forecast, by Application 2020 & 2033
- Table 44: ASEAN Medical Image Recognition Service Revenue (undefined) Forecast, by Application 2020 & 2033
- Table 45: Oceania Medical Image Recognition Service Revenue (undefined) Forecast, by Application 2020 & 2033
- Table 46: Rest of Asia Pacific Medical Image Recognition Service Revenue (undefined) Forecast, by Application 2020 & 2033
Frequently Asked Questions
1. What is the projected Compound Annual Growth Rate (CAGR) of the Medical Image Recognition Service?
The projected CAGR is approximately 5.35%.
2. Which companies are prominent players in the Medical Image Recognition Service?
Key companies in the market include Microsoft, NVIDIA, IBM, Intel Corporation, Google, Inc, Siemens Healthineers, GE Healthcare, Digital Diagnostics, Inc, Xilinx, InformAI LLC, HeartFlow, Inc, Enlitic, Inc, Aidence, Shukun Technology, Hui Yi Hui Ying, Quasi-intelligence, SenseTime Group Co., Ltd, Yasen Technology, Haina Medical Letter, CR Miles Cloud, Wingspan technology, Associate Healthcare, Heart Doctor International, Kangzhong Optics.
3. What are the main segments of the Medical Image Recognition Service?
The market segments include Application, Types.
4. Can you provide details about the market size?
The market size is estimated to be USD XXX N/A as of 2022.
5. What are some drivers contributing to market growth?
N/A
6. What are the notable trends driving market growth?
N/A
7. Are there any restraints impacting market growth?
N/A
8. Can you provide examples of recent developments in the market?
N/A
9. What pricing options are available for accessing the report?
Pricing options include single-user, multi-user, and enterprise licenses priced at USD 2900.00, USD 4350.00, and USD 5800.00 respectively.
10. Is the market size provided in terms of value or volume?
The market size is provided in terms of value, measured in N/A.
11. Are there any specific market keywords associated with the report?
Yes, the market keyword associated with the report is "Medical Image Recognition Service," which aids in identifying and referencing the specific market segment covered.
12. How do I determine which pricing option suits my needs best?
The pricing options vary based on user requirements and access needs. Individual users may opt for single-user licenses, while businesses requiring broader access may choose multi-user or enterprise licenses for cost-effective access to the report.
13. Are there any additional resources or data provided in the Medical Image Recognition Service report?
While the report offers comprehensive insights, it's advisable to review the specific contents or supplementary materials provided to ascertain if additional resources or data are available.
14. How can I stay updated on further developments or reports in the Medical Image Recognition Service?
To stay informed about further developments, trends, and reports in the Medical Image Recognition Service, consider subscribing to industry newsletters, following relevant companies and organizations, or regularly checking reputable industry news sources and publications.
Methodology
Step 1 - Identification of Relevant Samples Size from Population Database


Step 2 - Approaches for Defining Global Market Size (Value, Volume* & Price*)

Note*: In applicable scenarios
Step 3 - Data Sources
Primary Research
- Web Analytics
- Survey Reports
- Research Institute
- Latest Research Reports
- Opinion Leaders
Secondary Research
- Annual Reports
- White Paper
- Latest Press Release
- Industry Association
- Paid Database
- Investor Presentations

Step 4 - Data Triangulation
Involves using different sources of information in order to increase the validity of a study
These sources are likely to be stakeholders in a program - participants, other researchers, program staff, other community members, and so on.
Then we put all data in single framework & apply various statistical tools to find out the dynamic on the market.
During the analysis stage, feedback from the stakeholder groups would be compared to determine areas of agreement as well as areas of divergence