
Key Insights
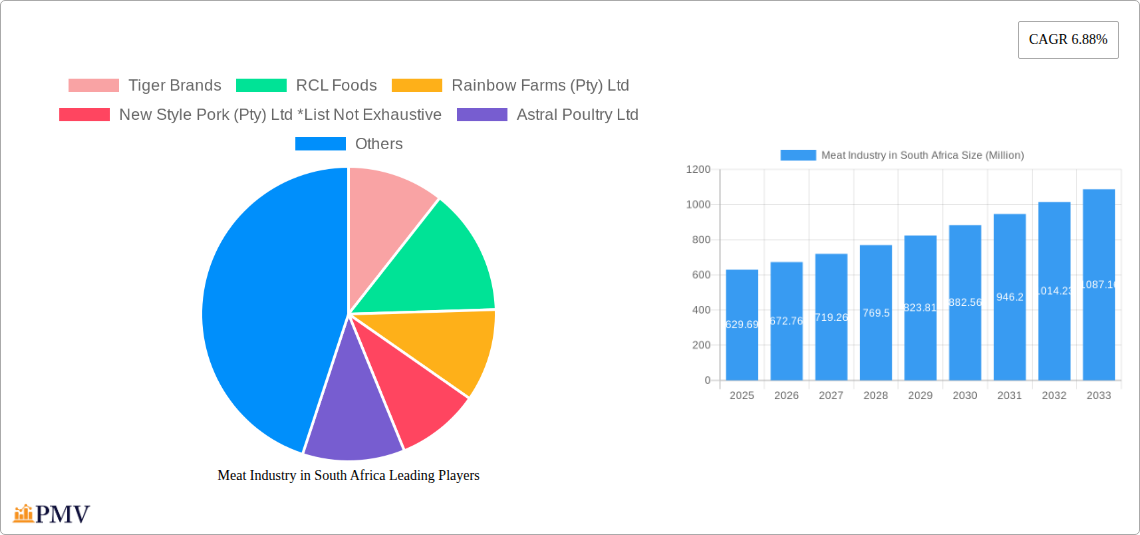
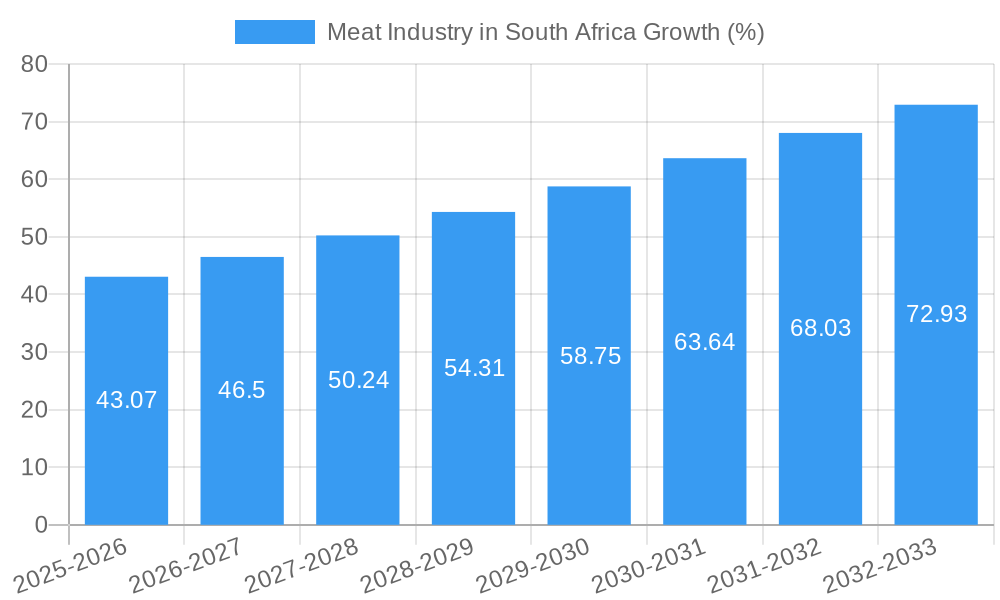
The South African meat industry, valued at $629.69 million in 2025, is projected to experience robust growth, driven by a rising population, increasing urbanization, and a growing preference for convenient, ready-to-eat meat products. The compound annual growth rate (CAGR) of 6.88% from 2025 to 2033 indicates a significant expansion in market size over the forecast period. Key drivers include the increasing demand for poultry, a relatively affordable protein source, and the expanding retail infrastructure, including both online and offline channels. While growth is anticipated, the industry faces challenges such as fluctuating feed prices, potential outbreaks of animal diseases impacting supply, and increasing consumer awareness of health and ethical concerns related to meat production. Segmentation reveals a diverse market with poultry holding a substantial share of the source segment, followed by pork and beef. The chilled meat segment is likely to dominate the product type category, reflecting consumer preference for freshness. The distribution channel is evenly split between offline and online retail, with the latter segment showing faster growth, driven by e-commerce penetration and changing consumer behavior. Major players such as Tiger Brands, RCL Foods, and Astral Poultry, along with international players like JBS SA and Tyson Foods, compete in this dynamic market. Growth in the South African meat market will likely be most pronounced in urban centers and regions with higher disposable incomes.
The success of individual companies will depend on their ability to adapt to changing consumer preferences, maintain efficient supply chains to mitigate price volatility, and implement sustainable farming practices to address ethical and environmental concerns. Regional variations in consumption patterns and economic conditions within South Africa will also influence market dynamics, with potential for higher growth in more developed regions. The industry is expected to see increased investment in processing technologies to enhance efficiency and product quality, along with strategies to cater to the growing demand for value-added meat products like ready meals. Sustained economic growth and stable regulatory frameworks will be vital to ensuring the continued growth of the South African meat industry in the coming years.
Meat Industry in South Africa: A Comprehensive Market Report (2019-2033)
This in-depth report provides a comprehensive analysis of the South African meat industry, covering the period 2019-2033, with a focus on market structure, competitive dynamics, growth drivers, and future outlook. The report utilizes data from 2019-2024 (Historical Period) as a foundation, establishes a Base Year of 2025 and provides detailed forecasts for 2025-2033 (Forecast Period). Key segments analyzed include poultry, pork, beef, and mutton, across chilled, frozen, and shelf-stable product types, and both online and offline retail channels. The report's value lies in its actionable insights for industry players, investors, and stakeholders seeking to understand and navigate this dynamic market. The total market size for meat in South Africa is estimated at xx Million in 2025.
Meat Industry in South Africa Market Structure & Competitive Dynamics
The South African meat industry exhibits a moderately concentrated market structure, with several large players controlling significant market share. Key players include Tiger Brands, RCL Foods, Astral Poultry Ltd, and Eskort Co-operative, among others. The industry is characterized by a complex interplay of factors including regulatory frameworks, innovation ecosystems, and consumer preferences. Market concentration is estimated at xx%, indicating a moderately competitive landscape. Innovation is driven by technological advancements in processing and packaging, as well as evolving consumer demands for healthier and more sustainable meat products. Regulatory frameworks, such as food safety regulations and animal welfare standards, significantly impact industry operations. The presence of product substitutes, like plant-based meat alternatives, is increasing, presenting both challenges and opportunities for traditional meat producers. Mergers and acquisitions (M&A) activity has been moderate in recent years, with deal values averaging xx Million per transaction. End-user trends show a growing preference for convenience and value-added products.
- Market Share: Tiger Brands (xx%), RCL Foods (xx%), Astral Poultry (xx%), Others (xx%).
- M&A Activity (2019-2024): xx deals, with a total value of approximately xx Million.
- Regulatory Framework: Primarily governed by the Department of Agriculture, Forestry and Fisheries.
Meat Industry in South Africa Industry Trends & Insights
The South African meat industry is projected to experience a Compound Annual Growth Rate (CAGR) of xx% during the forecast period (2025-2033). Key growth drivers include increasing per capita consumption, driven by population growth and rising disposable incomes. Technological disruptions, such as automation in processing and improved cold chain logistics, are enhancing efficiency and reducing costs. Consumer preferences are shifting towards healthier and more sustainably produced meat, creating demand for free-range, organic, and ethically sourced products. Competitive dynamics are marked by price competition, innovation in product offerings, and increasing focus on brand building. Market penetration of value-added products is growing steadily, with a projected xx% market share by 2033. The shift towards online retail channels is also a notable trend, although offline channels still dominate the market.
Dominant Markets & Segments in Meat Industry in South Africa
By Source: Poultry remains the dominant segment due to affordability and high consumption, followed by beef and pork. Mutton holds a smaller market share.
By Product Type: Chilled products dominate, driven by consumer preference for freshness. Frozen products are also significant, particularly for storage and distribution. Shelf-stable products hold a smaller share.
By Distribution: Offline retail channels, including supermarkets and butcheries, maintain market leadership due to established infrastructure and consumer habits. Online channels are experiencing growth, but penetration remains limited.
Key drivers for dominance include established distribution networks, strong consumer preferences, and the availability of resources. Poultry’s dominance is linked to its cost-effectiveness, while chilled products benefit from consumer preference for freshness and the existing robust cold chain infrastructure. Offline retail channels benefit from widespread reach and established consumer habits.
Meat Industry in South Africa Product Innovations
Recent innovations focus on convenience, health, and sustainability. This includes ready-to-eat meals, value-added products like marinated meats, and the introduction of plant-based meat alternatives. Technological advancements in processing and packaging extend shelf life and improve product quality. The market is increasingly seeing an emphasis on environmentally friendly packaging and sustainable sourcing practices, aligning with growing consumer preferences for ethically produced meat.
Report Segmentation & Scope
The report segments the South African meat market by source (Poultry, Pork, Beef, Mutton), product type (Chilled, Frozen, Shelf-stable), and distribution channel (Online, Offline). Each segment's growth projections, market size (in Millions), and competitive dynamics are analyzed. Poultry is projected to maintain its dominant position with significant growth, driven by affordability and high demand. Pork and beef markets are expected to grow at a moderate pace. The chilled segment is projected for the highest growth due to preference for freshness. Offline retail continues to dominate but online retail displays strong growth potential.
Key Drivers of Meat Industry in South Africa Growth
Several factors drive growth: rising disposable incomes fueling higher meat consumption; growing population leading to increased demand; technological advancements improving efficiency and reducing costs; and government support for agriculture. Furthermore, increasing urbanization and changing lifestyles are driving demand for convenient, ready-to-eat meat products.
Challenges in the Meat Industry in South Africa Sector
The industry faces challenges including fluctuating raw material prices, animal disease outbreaks affecting supply, and stringent regulatory requirements increasing compliance costs. Competition from imported meat and the emergence of plant-based alternatives pose additional pressures. Supply chain inefficiencies and infrastructure limitations in certain regions also impede growth.
Leading Players in the Meat Industry in South Africa Market
- Tiger Brands
- RCL Foods
- Rainbow Farms (Pty) Ltd
- New Style Pork (Pty) Ltd
- Astral Poultry Ltd
- BRF SA
- JBS SA
- Tyson Foods
- Eskort Co-operative
- Irvin & Johnson ltd
Key Developments in Meat Industry in South Africa Sector
- March 2022: BRF granted a license to export sausages to South Africa.
- April 2022: Mogale Meat Co. created its first cultivated chicken breast product in Africa.
- May 2022: JBS's Seara subsidiary gained approval to export chicken and pork to South Africa.
Strategic Meat Industry in South Africa Market Outlook
The South African meat industry presents significant opportunities for growth, driven by increasing demand, technological advancements, and evolving consumer preferences. Strategic focus should be on innovation, sustainable practices, and effective supply chain management to capitalize on this market potential. Companies embracing technology and catering to the growing preference for healthier and convenient options will be well-positioned for success.
Meat Industry in South Africa Segmentation
-
1. Source
- 1.1. Poultry
- 1.2. Pork
- 1.3. Beef
- 1.4. Mutton
-
2. Product Type
- 2.1. Chilled
- 2.2. Frozen
- 2.3. Shelf Stable
-
3. Distribution
- 3.1. Online Retail Channels
- 3.2. Offline Retail Channels
Meat Industry in South Africa Segmentation By Geography
-
1. North America
- 1.1. United States
- 1.2. Canada
- 1.3. Mexico
-
2. South America
- 2.1. Brazil
- 2.2. Argentina
- 2.3. Rest of South America
-
3. Europe
- 3.1. United Kingdom
- 3.2. Germany
- 3.3. France
- 3.4. Italy
- 3.5. Spain
- 3.6. Russia
- 3.7. Benelux
- 3.8. Nordics
- 3.9. Rest of Europe
-
4. Middle East & Africa
- 4.1. Turkey
- 4.2. Israel
- 4.3. GCC
- 4.4. North Africa
- 4.5. South Africa
- 4.6. Rest of Middle East & Africa
-
5. Asia Pacific
- 5.1. China
- 5.2. India
- 5.3. Japan
- 5.4. South Korea
- 5.5. ASEAN
- 5.6. Oceania
- 5.7. Rest of Asia Pacific
Meat Industry in South Africa REPORT HIGHLIGHTS
| Aspects | Details |
|---|---|
| Study Period | 2019-2033 |
| Base Year | 2024 |
| Estimated Year | 2025 |
| Forecast Period | 2025-2033 |
| Historical Period | 2019-2024 |
| Growth Rate | CAGR of 6.88% from 2019-2033 |
| Segmentation |
|
Table of Contents
- 1. Introduction
- 1.1. Research Scope
- 1.2. Market Segmentation
- 1.3. Research Methodology
- 1.4. Definitions and Assumptions
- 2. Executive Summary
- 2.1. Introduction
- 3. Market Dynamics
- 3.1. Introduction
- 3.2. Market Drivers
- 3.2.1. Increasing Demand for Functional and Fortified Food; Multi-functionality and Wide Application of Riboflavin
- 3.3. Market Restrains
- 3.3.1. Low Stability of Riboflavin on Exposure to Light and Heat
- 3.4. Market Trends
- 3.4.1. Growth of Foodservice Restaurants Increased Meat Consumption
- 4. Market Factor Analysis
- 4.1. Porters Five Forces
- 4.2. Supply/Value Chain
- 4.3. PESTEL analysis
- 4.4. Market Entropy
- 4.5. Patent/Trademark Analysis
- 5. Global Meat Industry in South Africa Analysis, Insights and Forecast, 2019-2031
- 5.1. Market Analysis, Insights and Forecast - by Source
- 5.1.1. Poultry
- 5.1.2. Pork
- 5.1.3. Beef
- 5.1.4. Mutton
- 5.2. Market Analysis, Insights and Forecast - by Product Type
- 5.2.1. Chilled
- 5.2.2. Frozen
- 5.2.3. Shelf Stable
- 5.3. Market Analysis, Insights and Forecast - by Distribution
- 5.3.1. Online Retail Channels
- 5.3.2. Offline Retail Channels
- 5.4. Market Analysis, Insights and Forecast - by Region
- 5.4.1. North America
- 5.4.2. South America
- 5.4.3. Europe
- 5.4.4. Middle East & Africa
- 5.4.5. Asia Pacific
- 5.1. Market Analysis, Insights and Forecast - by Source
- 6. North America Meat Industry in South Africa Analysis, Insights and Forecast, 2019-2031
- 6.1. Market Analysis, Insights and Forecast - by Source
- 6.1.1. Poultry
- 6.1.2. Pork
- 6.1.3. Beef
- 6.1.4. Mutton
- 6.2. Market Analysis, Insights and Forecast - by Product Type
- 6.2.1. Chilled
- 6.2.2. Frozen
- 6.2.3. Shelf Stable
- 6.3. Market Analysis, Insights and Forecast - by Distribution
- 6.3.1. Online Retail Channels
- 6.3.2. Offline Retail Channels
- 6.1. Market Analysis, Insights and Forecast - by Source
- 7. South America Meat Industry in South Africa Analysis, Insights and Forecast, 2019-2031
- 7.1. Market Analysis, Insights and Forecast - by Source
- 7.1.1. Poultry
- 7.1.2. Pork
- 7.1.3. Beef
- 7.1.4. Mutton
- 7.2. Market Analysis, Insights and Forecast - by Product Type
- 7.2.1. Chilled
- 7.2.2. Frozen
- 7.2.3. Shelf Stable
- 7.3. Market Analysis, Insights and Forecast - by Distribution
- 7.3.1. Online Retail Channels
- 7.3.2. Offline Retail Channels
- 7.1. Market Analysis, Insights and Forecast - by Source
- 8. Europe Meat Industry in South Africa Analysis, Insights and Forecast, 2019-2031
- 8.1. Market Analysis, Insights and Forecast - by Source
- 8.1.1. Poultry
- 8.1.2. Pork
- 8.1.3. Beef
- 8.1.4. Mutton
- 8.2. Market Analysis, Insights and Forecast - by Product Type
- 8.2.1. Chilled
- 8.2.2. Frozen
- 8.2.3. Shelf Stable
- 8.3. Market Analysis, Insights and Forecast - by Distribution
- 8.3.1. Online Retail Channels
- 8.3.2. Offline Retail Channels
- 8.1. Market Analysis, Insights and Forecast - by Source
- 9. Middle East & Africa Meat Industry in South Africa Analysis, Insights and Forecast, 2019-2031
- 9.1. Market Analysis, Insights and Forecast - by Source
- 9.1.1. Poultry
- 9.1.2. Pork
- 9.1.3. Beef
- 9.1.4. Mutton
- 9.2. Market Analysis, Insights and Forecast - by Product Type
- 9.2.1. Chilled
- 9.2.2. Frozen
- 9.2.3. Shelf Stable
- 9.3. Market Analysis, Insights and Forecast - by Distribution
- 9.3.1. Online Retail Channels
- 9.3.2. Offline Retail Channels
- 9.1. Market Analysis, Insights and Forecast - by Source
- 10. Asia Pacific Meat Industry in South Africa Analysis, Insights and Forecast, 2019-2031
- 10.1. Market Analysis, Insights and Forecast - by Source
- 10.1.1. Poultry
- 10.1.2. Pork
- 10.1.3. Beef
- 10.1.4. Mutton
- 10.2. Market Analysis, Insights and Forecast - by Product Type
- 10.2.1. Chilled
- 10.2.2. Frozen
- 10.2.3. Shelf Stable
- 10.3. Market Analysis, Insights and Forecast - by Distribution
- 10.3.1. Online Retail Channels
- 10.3.2. Offline Retail Channels
- 10.1. Market Analysis, Insights and Forecast - by Source
- 11. South Africa Meat Industry in South Africa Analysis, Insights and Forecast, 2019-2031
- 12. Sudan Meat Industry in South Africa Analysis, Insights and Forecast, 2019-2031
- 13. Uganda Meat Industry in South Africa Analysis, Insights and Forecast, 2019-2031
- 14. Tanzania Meat Industry in South Africa Analysis, Insights and Forecast, 2019-2031
- 15. Kenya Meat Industry in South Africa Analysis, Insights and Forecast, 2019-2031
- 16. Rest of Africa Meat Industry in South Africa Analysis, Insights and Forecast, 2019-2031
- 17. Competitive Analysis
- 17.1. Global Market Share Analysis 2024
- 17.2. Company Profiles
- 17.2.1 Tiger Brands
- 17.2.1.1. Overview
- 17.2.1.2. Products
- 17.2.1.3. SWOT Analysis
- 17.2.1.4. Recent Developments
- 17.2.1.5. Financials (Based on Availability)
- 17.2.2 RCL Foods
- 17.2.2.1. Overview
- 17.2.2.2. Products
- 17.2.2.3. SWOT Analysis
- 17.2.2.4. Recent Developments
- 17.2.2.5. Financials (Based on Availability)
- 17.2.3 Rainbow Farms (Pty) Ltd
- 17.2.3.1. Overview
- 17.2.3.2. Products
- 17.2.3.3. SWOT Analysis
- 17.2.3.4. Recent Developments
- 17.2.3.5. Financials (Based on Availability)
- 17.2.4 New Style Pork (Pty) Ltd *List Not Exhaustive
- 17.2.4.1. Overview
- 17.2.4.2. Products
- 17.2.4.3. SWOT Analysis
- 17.2.4.4. Recent Developments
- 17.2.4.5. Financials (Based on Availability)
- 17.2.5 Astral Poultry Ltd
- 17.2.5.1. Overview
- 17.2.5.2. Products
- 17.2.5.3. SWOT Analysis
- 17.2.5.4. Recent Developments
- 17.2.5.5. Financials (Based on Availability)
- 17.2.6 BRF SA
- 17.2.6.1. Overview
- 17.2.6.2. Products
- 17.2.6.3. SWOT Analysis
- 17.2.6.4. Recent Developments
- 17.2.6.5. Financials (Based on Availability)
- 17.2.7 JBS SA
- 17.2.7.1. Overview
- 17.2.7.2. Products
- 17.2.7.3. SWOT Analysis
- 17.2.7.4. Recent Developments
- 17.2.7.5. Financials (Based on Availability)
- 17.2.8 Tyson Foods
- 17.2.8.1. Overview
- 17.2.8.2. Products
- 17.2.8.3. SWOT Analysis
- 17.2.8.4. Recent Developments
- 17.2.8.5. Financials (Based on Availability)
- 17.2.9 Eskort Co-operative
- 17.2.9.1. Overview
- 17.2.9.2. Products
- 17.2.9.3. SWOT Analysis
- 17.2.9.4. Recent Developments
- 17.2.9.5. Financials (Based on Availability)
- 17.2.10 Irvin & Johnson ltd
- 17.2.10.1. Overview
- 17.2.10.2. Products
- 17.2.10.3. SWOT Analysis
- 17.2.10.4. Recent Developments
- 17.2.10.5. Financials (Based on Availability)
- 17.2.1 Tiger Brands
List of Figures
- Figure 1: Global Meat Industry in South Africa Revenue Breakdown (Million, %) by Region 2024 & 2032
- Figure 2: Africa Meat Industry in South Africa Revenue (Million), by Country 2024 & 2032
- Figure 3: Africa Meat Industry in South Africa Revenue Share (%), by Country 2024 & 2032
- Figure 4: North America Meat Industry in South Africa Revenue (Million), by Source 2024 & 2032
- Figure 5: North America Meat Industry in South Africa Revenue Share (%), by Source 2024 & 2032
- Figure 6: North America Meat Industry in South Africa Revenue (Million), by Product Type 2024 & 2032
- Figure 7: North America Meat Industry in South Africa Revenue Share (%), by Product Type 2024 & 2032
- Figure 8: North America Meat Industry in South Africa Revenue (Million), by Distribution 2024 & 2032
- Figure 9: North America Meat Industry in South Africa Revenue Share (%), by Distribution 2024 & 2032
- Figure 10: North America Meat Industry in South Africa Revenue (Million), by Country 2024 & 2032
- Figure 11: North America Meat Industry in South Africa Revenue Share (%), by Country 2024 & 2032
- Figure 12: South America Meat Industry in South Africa Revenue (Million), by Source 2024 & 2032
- Figure 13: South America Meat Industry in South Africa Revenue Share (%), by Source 2024 & 2032
- Figure 14: South America Meat Industry in South Africa Revenue (Million), by Product Type 2024 & 2032
- Figure 15: South America Meat Industry in South Africa Revenue Share (%), by Product Type 2024 & 2032
- Figure 16: South America Meat Industry in South Africa Revenue (Million), by Distribution 2024 & 2032
- Figure 17: South America Meat Industry in South Africa Revenue Share (%), by Distribution 2024 & 2032
- Figure 18: South America Meat Industry in South Africa Revenue (Million), by Country 2024 & 2032
- Figure 19: South America Meat Industry in South Africa Revenue Share (%), by Country 2024 & 2032
- Figure 20: Europe Meat Industry in South Africa Revenue (Million), by Source 2024 & 2032
- Figure 21: Europe Meat Industry in South Africa Revenue Share (%), by Source 2024 & 2032
- Figure 22: Europe Meat Industry in South Africa Revenue (Million), by Product Type 2024 & 2032
- Figure 23: Europe Meat Industry in South Africa Revenue Share (%), by Product Type 2024 & 2032
- Figure 24: Europe Meat Industry in South Africa Revenue (Million), by Distribution 2024 & 2032
- Figure 25: Europe Meat Industry in South Africa Revenue Share (%), by Distribution 2024 & 2032
- Figure 26: Europe Meat Industry in South Africa Revenue (Million), by Country 2024 & 2032
- Figure 27: Europe Meat Industry in South Africa Revenue Share (%), by Country 2024 & 2032
- Figure 28: Middle East & Africa Meat Industry in South Africa Revenue (Million), by Source 2024 & 2032
- Figure 29: Middle East & Africa Meat Industry in South Africa Revenue Share (%), by Source 2024 & 2032
- Figure 30: Middle East & Africa Meat Industry in South Africa Revenue (Million), by Product Type 2024 & 2032
- Figure 31: Middle East & Africa Meat Industry in South Africa Revenue Share (%), by Product Type 2024 & 2032
- Figure 32: Middle East & Africa Meat Industry in South Africa Revenue (Million), by Distribution 2024 & 2032
- Figure 33: Middle East & Africa Meat Industry in South Africa Revenue Share (%), by Distribution 2024 & 2032
- Figure 34: Middle East & Africa Meat Industry in South Africa Revenue (Million), by Country 2024 & 2032
- Figure 35: Middle East & Africa Meat Industry in South Africa Revenue Share (%), by Country 2024 & 2032
- Figure 36: Asia Pacific Meat Industry in South Africa Revenue (Million), by Source 2024 & 2032
- Figure 37: Asia Pacific Meat Industry in South Africa Revenue Share (%), by Source 2024 & 2032
- Figure 38: Asia Pacific Meat Industry in South Africa Revenue (Million), by Product Type 2024 & 2032
- Figure 39: Asia Pacific Meat Industry in South Africa Revenue Share (%), by Product Type 2024 & 2032
- Figure 40: Asia Pacific Meat Industry in South Africa Revenue (Million), by Distribution 2024 & 2032
- Figure 41: Asia Pacific Meat Industry in South Africa Revenue Share (%), by Distribution 2024 & 2032
- Figure 42: Asia Pacific Meat Industry in South Africa Revenue (Million), by Country 2024 & 2032
- Figure 43: Asia Pacific Meat Industry in South Africa Revenue Share (%), by Country 2024 & 2032
List of Tables
- Table 1: Global Meat Industry in South Africa Revenue Million Forecast, by Region 2019 & 2032
- Table 2: Global Meat Industry in South Africa Revenue Million Forecast, by Source 2019 & 2032
- Table 3: Global Meat Industry in South Africa Revenue Million Forecast, by Product Type 2019 & 2032
- Table 4: Global Meat Industry in South Africa Revenue Million Forecast, by Distribution 2019 & 2032
- Table 5: Global Meat Industry in South Africa Revenue Million Forecast, by Region 2019 & 2032
- Table 6: Global Meat Industry in South Africa Revenue Million Forecast, by Country 2019 & 2032
- Table 7: South Africa Meat Industry in South Africa Revenue (Million) Forecast, by Application 2019 & 2032
- Table 8: Sudan Meat Industry in South Africa Revenue (Million) Forecast, by Application 2019 & 2032
- Table 9: Uganda Meat Industry in South Africa Revenue (Million) Forecast, by Application 2019 & 2032
- Table 10: Tanzania Meat Industry in South Africa Revenue (Million) Forecast, by Application 2019 & 2032
- Table 11: Kenya Meat Industry in South Africa Revenue (Million) Forecast, by Application 2019 & 2032
- Table 12: Rest of Africa Meat Industry in South Africa Revenue (Million) Forecast, by Application 2019 & 2032
- Table 13: Global Meat Industry in South Africa Revenue Million Forecast, by Source 2019 & 2032
- Table 14: Global Meat Industry in South Africa Revenue Million Forecast, by Product Type 2019 & 2032
- Table 15: Global Meat Industry in South Africa Revenue Million Forecast, by Distribution 2019 & 2032
- Table 16: Global Meat Industry in South Africa Revenue Million Forecast, by Country 2019 & 2032
- Table 17: United States Meat Industry in South Africa Revenue (Million) Forecast, by Application 2019 & 2032
- Table 18: Canada Meat Industry in South Africa Revenue (Million) Forecast, by Application 2019 & 2032
- Table 19: Mexico Meat Industry in South Africa Revenue (Million) Forecast, by Application 2019 & 2032
- Table 20: Global Meat Industry in South Africa Revenue Million Forecast, by Source 2019 & 2032
- Table 21: Global Meat Industry in South Africa Revenue Million Forecast, by Product Type 2019 & 2032
- Table 22: Global Meat Industry in South Africa Revenue Million Forecast, by Distribution 2019 & 2032
- Table 23: Global Meat Industry in South Africa Revenue Million Forecast, by Country 2019 & 2032
- Table 24: Brazil Meat Industry in South Africa Revenue (Million) Forecast, by Application 2019 & 2032
- Table 25: Argentina Meat Industry in South Africa Revenue (Million) Forecast, by Application 2019 & 2032
- Table 26: Rest of South America Meat Industry in South Africa Revenue (Million) Forecast, by Application 2019 & 2032
- Table 27: Global Meat Industry in South Africa Revenue Million Forecast, by Source 2019 & 2032
- Table 28: Global Meat Industry in South Africa Revenue Million Forecast, by Product Type 2019 & 2032
- Table 29: Global Meat Industry in South Africa Revenue Million Forecast, by Distribution 2019 & 2032
- Table 30: Global Meat Industry in South Africa Revenue Million Forecast, by Country 2019 & 2032
- Table 31: United Kingdom Meat Industry in South Africa Revenue (Million) Forecast, by Application 2019 & 2032
- Table 32: Germany Meat Industry in South Africa Revenue (Million) Forecast, by Application 2019 & 2032
- Table 33: France Meat Industry in South Africa Revenue (Million) Forecast, by Application 2019 & 2032
- Table 34: Italy Meat Industry in South Africa Revenue (Million) Forecast, by Application 2019 & 2032
- Table 35: Spain Meat Industry in South Africa Revenue (Million) Forecast, by Application 2019 & 2032
- Table 36: Russia Meat Industry in South Africa Revenue (Million) Forecast, by Application 2019 & 2032
- Table 37: Benelux Meat Industry in South Africa Revenue (Million) Forecast, by Application 2019 & 2032
- Table 38: Nordics Meat Industry in South Africa Revenue (Million) Forecast, by Application 2019 & 2032
- Table 39: Rest of Europe Meat Industry in South Africa Revenue (Million) Forecast, by Application 2019 & 2032
- Table 40: Global Meat Industry in South Africa Revenue Million Forecast, by Source 2019 & 2032
- Table 41: Global Meat Industry in South Africa Revenue Million Forecast, by Product Type 2019 & 2032
- Table 42: Global Meat Industry in South Africa Revenue Million Forecast, by Distribution 2019 & 2032
- Table 43: Global Meat Industry in South Africa Revenue Million Forecast, by Country 2019 & 2032
- Table 44: Turkey Meat Industry in South Africa Revenue (Million) Forecast, by Application 2019 & 2032
- Table 45: Israel Meat Industry in South Africa Revenue (Million) Forecast, by Application 2019 & 2032
- Table 46: GCC Meat Industry in South Africa Revenue (Million) Forecast, by Application 2019 & 2032
- Table 47: North Africa Meat Industry in South Africa Revenue (Million) Forecast, by Application 2019 & 2032
- Table 48: South Africa Meat Industry in South Africa Revenue (Million) Forecast, by Application 2019 & 2032
- Table 49: Rest of Middle East & Africa Meat Industry in South Africa Revenue (Million) Forecast, by Application 2019 & 2032
- Table 50: Global Meat Industry in South Africa Revenue Million Forecast, by Source 2019 & 2032
- Table 51: Global Meat Industry in South Africa Revenue Million Forecast, by Product Type 2019 & 2032
- Table 52: Global Meat Industry in South Africa Revenue Million Forecast, by Distribution 2019 & 2032
- Table 53: Global Meat Industry in South Africa Revenue Million Forecast, by Country 2019 & 2032
- Table 54: China Meat Industry in South Africa Revenue (Million) Forecast, by Application 2019 & 2032
- Table 55: India Meat Industry in South Africa Revenue (Million) Forecast, by Application 2019 & 2032
- Table 56: Japan Meat Industry in South Africa Revenue (Million) Forecast, by Application 2019 & 2032
- Table 57: South Korea Meat Industry in South Africa Revenue (Million) Forecast, by Application 2019 & 2032
- Table 58: ASEAN Meat Industry in South Africa Revenue (Million) Forecast, by Application 2019 & 2032
- Table 59: Oceania Meat Industry in South Africa Revenue (Million) Forecast, by Application 2019 & 2032
- Table 60: Rest of Asia Pacific Meat Industry in South Africa Revenue (Million) Forecast, by Application 2019 & 2032
Frequently Asked Questions
1. What is the projected Compound Annual Growth Rate (CAGR) of the Meat Industry in South Africa?
The projected CAGR is approximately 6.88%.
2. Which companies are prominent players in the Meat Industry in South Africa?
Key companies in the market include Tiger Brands, RCL Foods, Rainbow Farms (Pty) Ltd, New Style Pork (Pty) Ltd *List Not Exhaustive, Astral Poultry Ltd, BRF SA, JBS SA, Tyson Foods, Eskort Co-operative, Irvin & Johnson ltd.
3. What are the main segments of the Meat Industry in South Africa?
The market segments include Source, Product Type, Distribution.
4. Can you provide details about the market size?
The market size is estimated to be USD 629.69 Million as of 2022.
5. What are some drivers contributing to market growth?
Increasing Demand for Functional and Fortified Food; Multi-functionality and Wide Application of Riboflavin.
6. What are the notable trends driving market growth?
Growth of Foodservice Restaurants Increased Meat Consumption.
7. Are there any restraints impacting market growth?
Low Stability of Riboflavin on Exposure to Light and Heat.
8. Can you provide examples of recent developments in the market?
May 2022: JBS announced that two plants of the subsidiary Seara were approved to export chicken meat to South Africa. With that, the company now has 28 units ready to export chickens and pigs to the African country.
9. What pricing options are available for accessing the report?
Pricing options include single-user, multi-user, and enterprise licenses priced at USD 3800, USD 4500, and USD 5800 respectively.
10. Is the market size provided in terms of value or volume?
The market size is provided in terms of value, measured in Million.
11. Are there any specific market keywords associated with the report?
Yes, the market keyword associated with the report is "Meat Industry in South Africa," which aids in identifying and referencing the specific market segment covered.
12. How do I determine which pricing option suits my needs best?
The pricing options vary based on user requirements and access needs. Individual users may opt for single-user licenses, while businesses requiring broader access may choose multi-user or enterprise licenses for cost-effective access to the report.
13. Are there any additional resources or data provided in the Meat Industry in South Africa report?
While the report offers comprehensive insights, it's advisable to review the specific contents or supplementary materials provided to ascertain if additional resources or data are available.
14. How can I stay updated on further developments or reports in the Meat Industry in South Africa?
To stay informed about further developments, trends, and reports in the Meat Industry in South Africa, consider subscribing to industry newsletters, following relevant companies and organizations, or regularly checking reputable industry news sources and publications.
Methodology
Step 1 - Identification of Relevant Samples Size from Population Database


Step 2 - Approaches for Defining Global Market Size (Value, Volume* & Price*)

Note*: In applicable scenarios
Step 3 - Data Sources
Primary Research
- Web Analytics
- Survey Reports
- Research Institute
- Latest Research Reports
- Opinion Leaders
Secondary Research
- Annual Reports
- White Paper
- Latest Press Release
- Industry Association
- Paid Database
- Investor Presentations

Step 4 - Data Triangulation
Involves using different sources of information in order to increase the validity of a study
These sources are likely to be stakeholders in a program - participants, other researchers, program staff, other community members, and so on.
Then we put all data in single framework & apply various statistical tools to find out the dynamic on the market.
During the analysis stage, feedback from the stakeholder groups would be compared to determine areas of agreement as well as areas of divergence


