
Key Insights
The Middle East and Africa (MEA) portable X-ray devices market exhibits significant growth potential, driven by increasing healthcare infrastructure development, rising prevalence of chronic diseases necessitating frequent diagnostic imaging, and a growing preference for point-of-care diagnostics. The market's expansion is further fueled by technological advancements in portable X-ray systems, such as improved image quality, reduced radiation exposure, and enhanced portability features. This facilitates wider accessibility, particularly in remote and underserved areas where access to traditional X-ray facilities is limited. Key applications within the MEA region include emergency medicine, trauma care, and mobile healthcare initiatives. The market is segmented by modality (handheld and mobile), and technology (analog and digital), with digital X-ray systems witnessing faster adoption rates due to their superior image quality and ease of use. Major players are focusing on strategic partnerships and distribution networks to expand their market presence across various countries within the MEA region. The increasing adoption of telehealth and telemedicine solutions is also expected to drive demand for portable X-ray systems, enabling remote diagnosis and treatment.
Competitive dynamics within the MEA portable X-ray devices market are characterized by the presence of both multinational corporations and regional players. Multinationals leverage their extensive experience, technological capabilities, and established distribution channels to capture significant market share. However, regional players are increasingly gaining traction by offering cost-effective solutions tailored to the specific needs of the local markets. Government initiatives promoting healthcare infrastructure development and the increasing focus on improving healthcare access in underserved communities are creating favorable conditions for market expansion. Future growth is expected to be influenced by factors such as regulatory changes, pricing strategies, technological innovations, and the overall economic development of the region. The market is anticipated to experience robust growth over the forecast period, driven by the aforementioned factors and the increasing demand for improved healthcare services across the MEA region.
MEA Portable X-Ray Devices Industry: A Comprehensive Market Report (2019-2033)
This in-depth report provides a comprehensive analysis of the Middle East and Africa (MEA) portable X-ray devices industry, offering invaluable insights for stakeholders, investors, and industry professionals. The report covers the period 2019-2033, with a focus on the base year 2025 and forecast period 2025-2033. It segments the market by technology (Analog X-ray, Digital X-ray), application (Dental X-ray, Mammography, Chest X-ray, Abdomen X-ray), and modality (Handheld X-ray Devices, Mobile X-ray Devices). Key players like Siemens Healthineers, Ziehm Imaging GmbH, KaVo Dental, Fujifilm Corporation, Carestream Health, General Electric Company (GE Healthcare), Koninklijke Philips NV, Canon Medical Systems, and Shimadzu Corporations are analyzed extensively. The total market value in 2025 is estimated at xx Million.
MEA Portable X-Ray Devices Industry Market Structure & Competitive Dynamics
The MEA portable X-ray devices market exhibits a moderately concentrated structure, with a few multinational corporations holding significant market share. The industry is characterized by an ongoing innovation ecosystem, driving the development of advanced digital X-ray technologies and AI-powered diagnostic tools. Stringent regulatory frameworks, particularly concerning radiation safety and medical device approvals, shape market dynamics. Product substitution primarily involves the transition from analog to digital X-ray systems, driven by improved image quality and diagnostic capabilities. End-user trends indicate a growing preference for portable and mobile X-ray devices, particularly in remote areas and developing economies within the MEA region. M&A activities have been relatively limited in recent years, with deal values remaining below xx Million annually. However, strategic partnerships and collaborations are common, fostering technological advancements and market penetration.
- Market Concentration: Moderate, with top 5 players holding approximately xx% market share in 2025.
- Innovation Ecosystem: Strong focus on digital X-ray, AI integration, and improved portability.
- Regulatory Frameworks: Stringent regulations regarding radiation safety and device approvals.
- M&A Activity: Relatively low, with annual deal values estimated at below xx Million during the historical period.
MEA Portable X-Ray Devices Industry Industry Trends & Insights
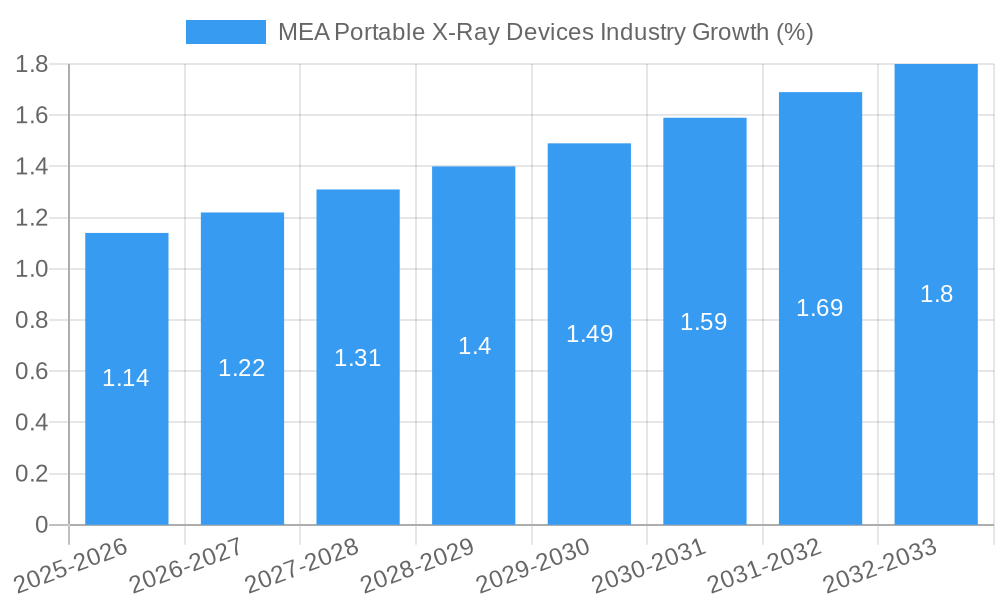
The MEA portable X-ray devices market is projected to experience robust growth, driven by several factors. The increasing prevalence of chronic diseases, coupled with the rising demand for improved healthcare infrastructure, particularly in underserved regions, is a significant catalyst. Technological advancements, such as the development of miniaturized and portable digital X-ray systems with enhanced image quality, are also fueling market expansion. Consumer preferences are shifting towards portable devices due to their ease of use and flexibility, which is particularly beneficial in remote areas. The competitive dynamics remain intense, with leading players focusing on product innovation, strategic partnerships, and market expansion strategies. The compound annual growth rate (CAGR) for the forecast period (2025-2033) is projected to be xx%, resulting in a market value of xx Million by 2033. Market penetration of digital X-ray systems is expected to increase from xx% in 2025 to xx% by 2033.
Dominant Markets & Segments in MEA Portable X-Ray Devices Industry
Leading Region: The market is dominated by the North African region with its greater established healthcare infrastructure. Key growth drivers in this region include improving healthcare investments and the growing adoption of advanced medical technologies.
Leading Country: Egypt demonstrates significant potential, driven by government initiatives and increased investments in healthcare infrastructure.
Dominant Segments:
- Technology: Digital X-ray is the dominant segment, driven by superior image quality and diagnostic capabilities.
- Application: Chest X-ray and Dental X-ray are the leading application segments due to high volume demand and the suitability of portable devices for these procedures.
- Modality: Mobile X-ray devices hold a larger market share compared to handheld devices due to greater image quality and patient throughput capabilities.
Key Drivers:
- Increased healthcare expenditure by governments and private sector.
- Rising prevalence of chronic diseases requiring frequent X-ray examinations.
- Growing adoption of portable and mobile X-ray systems in underserved areas.
- Technological advancements in digital X-ray technology and image processing.
MEA Portable X-Ray Devices Industry Product Innovations
Recent product innovations center around enhancing image quality, portability, and user-friendliness. Manufacturers are incorporating advanced digital detectors, AI-powered image processing algorithms, and wireless connectivity features into their portable X-ray systems. This improves diagnostic accuracy, reduces radiation exposure, and simplifies workflows. Miniaturization efforts are also prominent, resulting in more compact and lightweight devices suitable for various applications. These innovations strongly cater to the growing demand for efficient and accurate diagnostic imaging solutions in resource-constrained settings.
Report Segmentation & Scope
This report provides a detailed segmentation of the MEA portable X-ray devices market across various parameters:
- Technology: Analog X-ray and Digital X-ray. Digital X-ray is projected to show significantly higher growth.
- Application: Dental X-ray, Mammography, Chest X-ray, and Abdomen X-ray. Dental and Chest X-ray are forecast to maintain leading positions.
- Modality: Handheld X-ray Devices and Mobile X-ray Devices. Mobile X-ray devices will demonstrate more robust expansion.
Each segment's growth projection, market size estimates, and competitive landscape are analyzed separately, providing a comprehensive understanding of the market structure.
Key Drivers of MEA Portable X-Ray Devices Industry Growth
The MEA portable X-ray devices market is fueled by several key drivers. Increasing healthcare expenditure, both public and private, is a primary driver. The rising prevalence of chronic diseases necessitates more frequent diagnostic imaging, boosting demand for portable X-ray devices. Government initiatives to improve healthcare access in remote areas further fuel market expansion. Technological advancements such as smaller, more efficient digital X-ray systems with superior image processing further contribute to the market growth.
Challenges in the MEA Portable X-Ray Devices Industry Sector
The MEA portable X-ray devices market faces several challenges. High initial investment costs for advanced digital systems can be a barrier to entry, especially for smaller healthcare providers. Stringent regulatory approvals and safety standards can increase time to market and development costs. Supply chain disruptions and fluctuations in raw material prices can impact production costs and availability. Competition among established players and the emergence of new entrants further create challenges for market share acquisition. These factors can result in decreased profitability and market growth in specific regions.
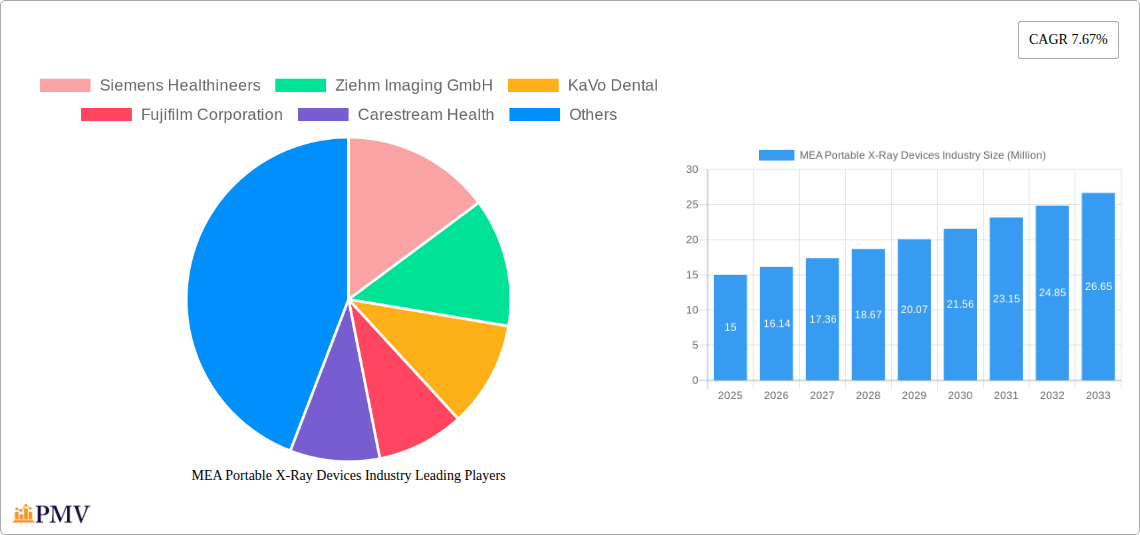
Leading Players in the MEA Portable X-Ray Devices Industry Market
- Siemens Healthineers
- Ziehm Imaging GmbH
- KaVo Dental
- Fujifilm Corporation
- Carestream Health
- General Electric Company (GE Healthcare)
- Koninklijke Philips NV
- Canon Medical Systems
- Shimadzu Corporations
Key Developments in MEA Portable X-Ray Devices Industry Sector
- January 2023: LG showcased new medical monitors and digital X-ray detectors at Arab Health 2023, enhancing diagnostic accuracy.
- September 2022: UNICEF Venture Fund invested in startups developing AI and machine learning for healthcare, including Neural Labs in Kenya focusing on chest X-ray disease detection.
Strategic MEA Portable X-Ray Devices Industry Market Outlook
The MEA portable X-ray devices market presents significant growth opportunities. Continued investment in healthcare infrastructure, increasing adoption of digital technologies, and the expanding focus on improving healthcare access in underserved regions will drive future market expansion. Strategic partnerships, product innovation, and a focus on delivering cost-effective and user-friendly solutions will be key success factors for market players. The market’s potential is substantial, with significant room for growth across various segments and geographical locations within the MEA region.
MEA Portable X-Ray Devices Industry Segmentation
-
1. Technology
- 1.1. Analog X-ray
- 1.2. Digital X-ray
-
2. Application
- 2.1. Dental X-ray
- 2.2. Mammography
- 2.3. Chest X-ray
- 2.4. Abdomen X-ray
-
3. Modality
- 3.1. Handheld X-ray Devices
- 3.2. Mobile X-ray Devices
-
4. Geography
- 4.1. GCC
- 4.2. South Africa
- 4.3. Rest of Middle East and Africa
MEA Portable X-Ray Devices Industry Segmentation By Geography
- 1. GCC
- 2. South Africa
- 3. Rest of Middle East and Africa
MEA Portable X-Ray Devices Industry REPORT HIGHLIGHTS
| Aspects | Details |
|---|---|
| Study Period | 2019-2033 |
| Base Year | 2024 |
| Estimated Year | 2025 |
| Forecast Period | 2025-2033 |
| Historical Period | 2019-2024 |
| Growth Rate | CAGR of 7.67% from 2019-2033 |
| Segmentation |
|
Table of Contents
- 1. Introduction
- 1.1. Research Scope
- 1.2. Market Segmentation
- 1.3. Research Methodology
- 1.4. Definitions and Assumptions
- 2. Executive Summary
- 2.1. Introduction
- 3. Market Dynamics
- 3.1. Introduction
- 3.2. Market Drivers
- 3.2.1. Technological Advancements and Rise in Awareness Regarding Portable Devices; Increase in Geriatric Population with Mobility Issues
- 3.3. Market Restrains
- 3.3.1. High Risk of Radiation Exposure
- 3.4. Market Trends
- 3.4.1. Digital X-ray is Expected to Hold a Significant Share of the Market During the Forecasted Period
- 4. Market Factor Analysis
- 4.1. Porters Five Forces
- 4.2. Supply/Value Chain
- 4.3. PESTEL analysis
- 4.4. Market Entropy
- 4.5. Patent/Trademark Analysis
- 5. Global MEA Portable X-Ray Devices Industry Analysis, Insights and Forecast, 2019-2031
- 5.1. Market Analysis, Insights and Forecast - by Technology
- 5.1.1. Analog X-ray
- 5.1.2. Digital X-ray
- 5.2. Market Analysis, Insights and Forecast - by Application
- 5.2.1. Dental X-ray
- 5.2.2. Mammography
- 5.2.3. Chest X-ray
- 5.2.4. Abdomen X-ray
- 5.3. Market Analysis, Insights and Forecast - by Modality
- 5.3.1. Handheld X-ray Devices
- 5.3.2. Mobile X-ray Devices
- 5.4. Market Analysis, Insights and Forecast - by Geography
- 5.4.1. GCC
- 5.4.2. South Africa
- 5.4.3. Rest of Middle East and Africa
- 5.5. Market Analysis, Insights and Forecast - by Region
- 5.5.1. GCC
- 5.5.2. South Africa
- 5.5.3. Rest of Middle East and Africa
- 5.1. Market Analysis, Insights and Forecast - by Technology
- 6. GCC MEA Portable X-Ray Devices Industry Analysis, Insights and Forecast, 2019-2031
- 6.1. Market Analysis, Insights and Forecast - by Technology
- 6.1.1. Analog X-ray
- 6.1.2. Digital X-ray
- 6.2. Market Analysis, Insights and Forecast - by Application
- 6.2.1. Dental X-ray
- 6.2.2. Mammography
- 6.2.3. Chest X-ray
- 6.2.4. Abdomen X-ray
- 6.3. Market Analysis, Insights and Forecast - by Modality
- 6.3.1. Handheld X-ray Devices
- 6.3.2. Mobile X-ray Devices
- 6.4. Market Analysis, Insights and Forecast - by Geography
- 6.4.1. GCC
- 6.4.2. South Africa
- 6.4.3. Rest of Middle East and Africa
- 6.1. Market Analysis, Insights and Forecast - by Technology
- 7. South Africa MEA Portable X-Ray Devices Industry Analysis, Insights and Forecast, 2019-2031
- 7.1. Market Analysis, Insights and Forecast - by Technology
- 7.1.1. Analog X-ray
- 7.1.2. Digital X-ray
- 7.2. Market Analysis, Insights and Forecast - by Application
- 7.2.1. Dental X-ray
- 7.2.2. Mammography
- 7.2.3. Chest X-ray
- 7.2.4. Abdomen X-ray
- 7.3. Market Analysis, Insights and Forecast - by Modality
- 7.3.1. Handheld X-ray Devices
- 7.3.2. Mobile X-ray Devices
- 7.4. Market Analysis, Insights and Forecast - by Geography
- 7.4.1. GCC
- 7.4.2. South Africa
- 7.4.3. Rest of Middle East and Africa
- 7.1. Market Analysis, Insights and Forecast - by Technology
- 8. Rest of Middle East and Africa MEA Portable X-Ray Devices Industry Analysis, Insights and Forecast, 2019-2031
- 8.1. Market Analysis, Insights and Forecast - by Technology
- 8.1.1. Analog X-ray
- 8.1.2. Digital X-ray
- 8.2. Market Analysis, Insights and Forecast - by Application
- 8.2.1. Dental X-ray
- 8.2.2. Mammography
- 8.2.3. Chest X-ray
- 8.2.4. Abdomen X-ray
- 8.3. Market Analysis, Insights and Forecast - by Modality
- 8.3.1. Handheld X-ray Devices
- 8.3.2. Mobile X-ray Devices
- 8.4. Market Analysis, Insights and Forecast - by Geography
- 8.4.1. GCC
- 8.4.2. South Africa
- 8.4.3. Rest of Middle East and Africa
- 8.1. Market Analysis, Insights and Forecast - by Technology
- 9. North America MEA Portable X-Ray Devices Industry Analysis, Insights and Forecast, 2019-2031
- 9.1. Market Analysis, Insights and Forecast - By Country/Sub-region
- 9.1.1 United States
- 9.1.2 Canada
- 9.1.3 Mexico
- 10. Europe MEA Portable X-Ray Devices Industry Analysis, Insights and Forecast, 2019-2031
- 10.1. Market Analysis, Insights and Forecast - By Country/Sub-region
- 10.1.1 Germany
- 10.1.2 United Kingdom
- 10.1.3 France
- 10.1.4 Spain
- 10.1.5 Italy
- 10.1.6 Spain
- 10.1.7 Belgium
- 10.1.8 Netherland
- 10.1.9 Nordics
- 10.1.10 Rest of Europe
- 11. Asia Pacific MEA Portable X-Ray Devices Industry Analysis, Insights and Forecast, 2019-2031
- 11.1. Market Analysis, Insights and Forecast - By Country/Sub-region
- 11.1.1 China
- 11.1.2 Japan
- 11.1.3 India
- 11.1.4 South Korea
- 11.1.5 Southeast Asia
- 11.1.6 Australia
- 11.1.7 Indonesia
- 11.1.8 Phillipes
- 11.1.9 Singapore
- 11.1.10 Thailandc
- 11.1.11 Rest of Asia Pacific
- 12. South America MEA Portable X-Ray Devices Industry Analysis, Insights and Forecast, 2019-2031
- 12.1. Market Analysis, Insights and Forecast - By Country/Sub-region
- 12.1.1 Brazil
- 12.1.2 Argentina
- 12.1.3 Peru
- 12.1.4 Chile
- 12.1.5 Colombia
- 12.1.6 Ecuador
- 12.1.7 Venezuela
- 12.1.8 Rest of South America
- 13. MEA MEA Portable X-Ray Devices Industry Analysis, Insights and Forecast, 2019-2031
- 13.1. Market Analysis, Insights and Forecast - By Country/Sub-region
- 13.1.1 United Arab Emirates
- 13.1.2 Saudi Arabia
- 13.1.3 South Africa
- 13.1.4 Rest of Middle East and Africa
- 14. Competitive Analysis
- 14.1. Global Market Share Analysis 2024
- 14.2. Company Profiles
- 14.2.1 Siemens Healthineers
- 14.2.1.1. Overview
- 14.2.1.2. Products
- 14.2.1.3. SWOT Analysis
- 14.2.1.4. Recent Developments
- 14.2.1.5. Financials (Based on Availability)
- 14.2.2 Ziehm Imaging GmbH
- 14.2.2.1. Overview
- 14.2.2.2. Products
- 14.2.2.3. SWOT Analysis
- 14.2.2.4. Recent Developments
- 14.2.2.5. Financials (Based on Availability)
- 14.2.3 KaVo Dental
- 14.2.3.1. Overview
- 14.2.3.2. Products
- 14.2.3.3. SWOT Analysis
- 14.2.3.4. Recent Developments
- 14.2.3.5. Financials (Based on Availability)
- 14.2.4 Fujifilm Corporation
- 14.2.4.1. Overview
- 14.2.4.2. Products
- 14.2.4.3. SWOT Analysis
- 14.2.4.4. Recent Developments
- 14.2.4.5. Financials (Based on Availability)
- 14.2.5 Carestream Health
- 14.2.5.1. Overview
- 14.2.5.2. Products
- 14.2.5.3. SWOT Analysis
- 14.2.5.4. Recent Developments
- 14.2.5.5. Financials (Based on Availability)
- 14.2.6 General Electric Company (GE Healthcare)
- 14.2.6.1. Overview
- 14.2.6.2. Products
- 14.2.6.3. SWOT Analysis
- 14.2.6.4. Recent Developments
- 14.2.6.5. Financials (Based on Availability)
- 14.2.7 Koninklijke Philips NV
- 14.2.7.1. Overview
- 14.2.7.2. Products
- 14.2.7.3. SWOT Analysis
- 14.2.7.4. Recent Developments
- 14.2.7.5. Financials (Based on Availability)
- 14.2.8 Canon Medical Systems
- 14.2.8.1. Overview
- 14.2.8.2. Products
- 14.2.8.3. SWOT Analysis
- 14.2.8.4. Recent Developments
- 14.2.8.5. Financials (Based on Availability)
- 14.2.9 Shimadzu Corporations
- 14.2.9.1. Overview
- 14.2.9.2. Products
- 14.2.9.3. SWOT Analysis
- 14.2.9.4. Recent Developments
- 14.2.9.5. Financials (Based on Availability)
- 14.2.1 Siemens Healthineers
List of Figures
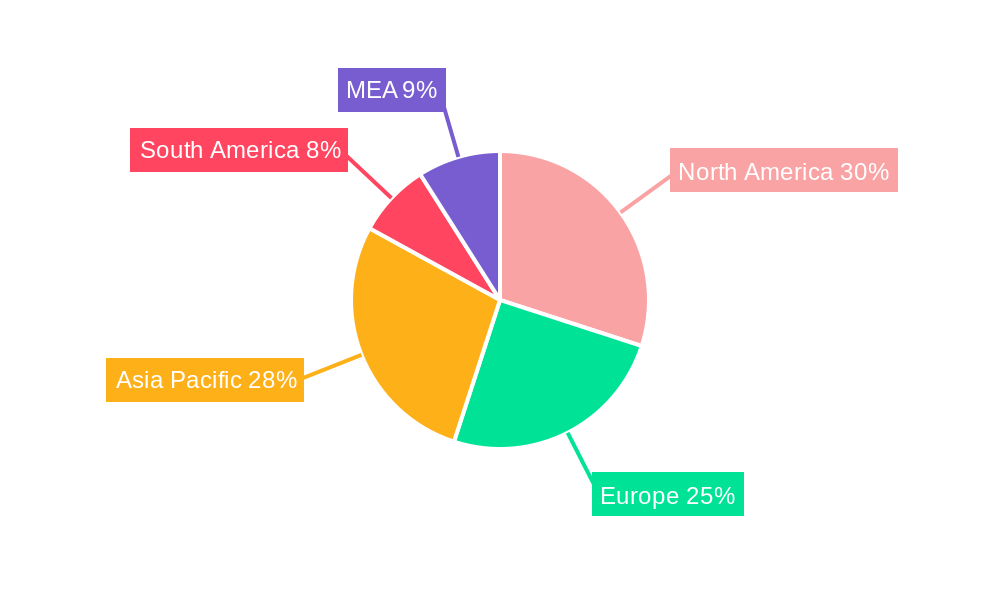
- Figure 1: Global MEA Portable X-Ray Devices Industry Revenue Breakdown (Million, %) by Region 2024 & 2032
- Figure 2: Global MEA Portable X-Ray Devices Industry Volume Breakdown (K Unit, %) by Region 2024 & 2032
- Figure 3: North America MEA Portable X-Ray Devices Industry Revenue (Million), by Country 2024 & 2032
- Figure 4: North America MEA Portable X-Ray Devices Industry Volume (K Unit), by Country 2024 & 2032
- Figure 5: North America MEA Portable X-Ray Devices Industry Revenue Share (%), by Country 2024 & 2032
- Figure 6: North America MEA Portable X-Ray Devices Industry Volume Share (%), by Country 2024 & 2032
- Figure 7: Europe MEA Portable X-Ray Devices Industry Revenue (Million), by Country 2024 & 2032
- Figure 8: Europe MEA Portable X-Ray Devices Industry Volume (K Unit), by Country 2024 & 2032
- Figure 9: Europe MEA Portable X-Ray Devices Industry Revenue Share (%), by Country 2024 & 2032
- Figure 10: Europe MEA Portable X-Ray Devices Industry Volume Share (%), by Country 2024 & 2032
- Figure 11: Asia Pacific MEA Portable X-Ray Devices Industry Revenue (Million), by Country 2024 & 2032
- Figure 12: Asia Pacific MEA Portable X-Ray Devices Industry Volume (K Unit), by Country 2024 & 2032
- Figure 13: Asia Pacific MEA Portable X-Ray Devices Industry Revenue Share (%), by Country 2024 & 2032
- Figure 14: Asia Pacific MEA Portable X-Ray Devices Industry Volume Share (%), by Country 2024 & 2032
- Figure 15: South America MEA Portable X-Ray Devices Industry Revenue (Million), by Country 2024 & 2032
- Figure 16: South America MEA Portable X-Ray Devices Industry Volume (K Unit), by Country 2024 & 2032
- Figure 17: South America MEA Portable X-Ray Devices Industry Revenue Share (%), by Country 2024 & 2032
- Figure 18: South America MEA Portable X-Ray Devices Industry Volume Share (%), by Country 2024 & 2032
- Figure 19: MEA MEA Portable X-Ray Devices Industry Revenue (Million), by Country 2024 & 2032
- Figure 20: MEA MEA Portable X-Ray Devices Industry Volume (K Unit), by Country 2024 & 2032
- Figure 21: MEA MEA Portable X-Ray Devices Industry Revenue Share (%), by Country 2024 & 2032
- Figure 22: MEA MEA Portable X-Ray Devices Industry Volume Share (%), by Country 2024 & 2032
- Figure 23: GCC MEA Portable X-Ray Devices Industry Revenue (Million), by Technology 2024 & 2032
- Figure 24: GCC MEA Portable X-Ray Devices Industry Volume (K Unit), by Technology 2024 & 2032
- Figure 25: GCC MEA Portable X-Ray Devices Industry Revenue Share (%), by Technology 2024 & 2032
- Figure 26: GCC MEA Portable X-Ray Devices Industry Volume Share (%), by Technology 2024 & 2032
- Figure 27: GCC MEA Portable X-Ray Devices Industry Revenue (Million), by Application 2024 & 2032
- Figure 28: GCC MEA Portable X-Ray Devices Industry Volume (K Unit), by Application 2024 & 2032
- Figure 29: GCC MEA Portable X-Ray Devices Industry Revenue Share (%), by Application 2024 & 2032
- Figure 30: GCC MEA Portable X-Ray Devices Industry Volume Share (%), by Application 2024 & 2032
- Figure 31: GCC MEA Portable X-Ray Devices Industry Revenue (Million), by Modality 2024 & 2032
- Figure 32: GCC MEA Portable X-Ray Devices Industry Volume (K Unit), by Modality 2024 & 2032
- Figure 33: GCC MEA Portable X-Ray Devices Industry Revenue Share (%), by Modality 2024 & 2032
- Figure 34: GCC MEA Portable X-Ray Devices Industry Volume Share (%), by Modality 2024 & 2032
- Figure 35: GCC MEA Portable X-Ray Devices Industry Revenue (Million), by Geography 2024 & 2032
- Figure 36: GCC MEA Portable X-Ray Devices Industry Volume (K Unit), by Geography 2024 & 2032
- Figure 37: GCC MEA Portable X-Ray Devices Industry Revenue Share (%), by Geography 2024 & 2032
- Figure 38: GCC MEA Portable X-Ray Devices Industry Volume Share (%), by Geography 2024 & 2032
- Figure 39: GCC MEA Portable X-Ray Devices Industry Revenue (Million), by Country 2024 & 2032
- Figure 40: GCC MEA Portable X-Ray Devices Industry Volume (K Unit), by Country 2024 & 2032
- Figure 41: GCC MEA Portable X-Ray Devices Industry Revenue Share (%), by Country 2024 & 2032
- Figure 42: GCC MEA Portable X-Ray Devices Industry Volume Share (%), by Country 2024 & 2032
- Figure 43: South Africa MEA Portable X-Ray Devices Industry Revenue (Million), by Technology 2024 & 2032
- Figure 44: South Africa MEA Portable X-Ray Devices Industry Volume (K Unit), by Technology 2024 & 2032
- Figure 45: South Africa MEA Portable X-Ray Devices Industry Revenue Share (%), by Technology 2024 & 2032
- Figure 46: South Africa MEA Portable X-Ray Devices Industry Volume Share (%), by Technology 2024 & 2032
- Figure 47: South Africa MEA Portable X-Ray Devices Industry Revenue (Million), by Application 2024 & 2032
- Figure 48: South Africa MEA Portable X-Ray Devices Industry Volume (K Unit), by Application 2024 & 2032
- Figure 49: South Africa MEA Portable X-Ray Devices Industry Revenue Share (%), by Application 2024 & 2032
- Figure 50: South Africa MEA Portable X-Ray Devices Industry Volume Share (%), by Application 2024 & 2032
- Figure 51: South Africa MEA Portable X-Ray Devices Industry Revenue (Million), by Modality 2024 & 2032
- Figure 52: South Africa MEA Portable X-Ray Devices Industry Volume (K Unit), by Modality 2024 & 2032
- Figure 53: South Africa MEA Portable X-Ray Devices Industry Revenue Share (%), by Modality 2024 & 2032
- Figure 54: South Africa MEA Portable X-Ray Devices Industry Volume Share (%), by Modality 2024 & 2032
- Figure 55: South Africa MEA Portable X-Ray Devices Industry Revenue (Million), by Geography 2024 & 2032
- Figure 56: South Africa MEA Portable X-Ray Devices Industry Volume (K Unit), by Geography 2024 & 2032
- Figure 57: South Africa MEA Portable X-Ray Devices Industry Revenue Share (%), by Geography 2024 & 2032
- Figure 58: South Africa MEA Portable X-Ray Devices Industry Volume Share (%), by Geography 2024 & 2032
- Figure 59: South Africa MEA Portable X-Ray Devices Industry Revenue (Million), by Country 2024 & 2032
- Figure 60: South Africa MEA Portable X-Ray Devices Industry Volume (K Unit), by Country 2024 & 2032
- Figure 61: South Africa MEA Portable X-Ray Devices Industry Revenue Share (%), by Country 2024 & 2032
- Figure 62: South Africa MEA Portable X-Ray Devices Industry Volume Share (%), by Country 2024 & 2032
- Figure 63: Rest of Middle East and Africa MEA Portable X-Ray Devices Industry Revenue (Million), by Technology 2024 & 2032
- Figure 64: Rest of Middle East and Africa MEA Portable X-Ray Devices Industry Volume (K Unit), by Technology 2024 & 2032
- Figure 65: Rest of Middle East and Africa MEA Portable X-Ray Devices Industry Revenue Share (%), by Technology 2024 & 2032
- Figure 66: Rest of Middle East and Africa MEA Portable X-Ray Devices Industry Volume Share (%), by Technology 2024 & 2032
- Figure 67: Rest of Middle East and Africa MEA Portable X-Ray Devices Industry Revenue (Million), by Application 2024 & 2032
- Figure 68: Rest of Middle East and Africa MEA Portable X-Ray Devices Industry Volume (K Unit), by Application 2024 & 2032
- Figure 69: Rest of Middle East and Africa MEA Portable X-Ray Devices Industry Revenue Share (%), by Application 2024 & 2032
- Figure 70: Rest of Middle East and Africa MEA Portable X-Ray Devices Industry Volume Share (%), by Application 2024 & 2032
- Figure 71: Rest of Middle East and Africa MEA Portable X-Ray Devices Industry Revenue (Million), by Modality 2024 & 2032
- Figure 72: Rest of Middle East and Africa MEA Portable X-Ray Devices Industry Volume (K Unit), by Modality 2024 & 2032
- Figure 73: Rest of Middle East and Africa MEA Portable X-Ray Devices Industry Revenue Share (%), by Modality 2024 & 2032
- Figure 74: Rest of Middle East and Africa MEA Portable X-Ray Devices Industry Volume Share (%), by Modality 2024 & 2032
- Figure 75: Rest of Middle East and Africa MEA Portable X-Ray Devices Industry Revenue (Million), by Geography 2024 & 2032
- Figure 76: Rest of Middle East and Africa MEA Portable X-Ray Devices Industry Volume (K Unit), by Geography 2024 & 2032
- Figure 77: Rest of Middle East and Africa MEA Portable X-Ray Devices Industry Revenue Share (%), by Geography 2024 & 2032
- Figure 78: Rest of Middle East and Africa MEA Portable X-Ray Devices Industry Volume Share (%), by Geography 2024 & 2032
- Figure 79: Rest of Middle East and Africa MEA Portable X-Ray Devices Industry Revenue (Million), by Country 2024 & 2032
- Figure 80: Rest of Middle East and Africa MEA Portable X-Ray Devices Industry Volume (K Unit), by Country 2024 & 2032
- Figure 81: Rest of Middle East and Africa MEA Portable X-Ray Devices Industry Revenue Share (%), by Country 2024 & 2032
- Figure 82: Rest of Middle East and Africa MEA Portable X-Ray Devices Industry Volume Share (%), by Country 2024 & 2032
List of Tables
- Table 1: Global MEA Portable X-Ray Devices Industry Revenue Million Forecast, by Region 2019 & 2032
- Table 2: Global MEA Portable X-Ray Devices Industry Volume K Unit Forecast, by Region 2019 & 2032
- Table 3: Global MEA Portable X-Ray Devices Industry Revenue Million Forecast, by Technology 2019 & 2032
- Table 4: Global MEA Portable X-Ray Devices Industry Volume K Unit Forecast, by Technology 2019 & 2032
- Table 5: Global MEA Portable X-Ray Devices Industry Revenue Million Forecast, by Application 2019 & 2032
- Table 6: Global MEA Portable X-Ray Devices Industry Volume K Unit Forecast, by Application 2019 & 2032
- Table 7: Global MEA Portable X-Ray Devices Industry Revenue Million Forecast, by Modality 2019 & 2032
- Table 8: Global MEA Portable X-Ray Devices Industry Volume K Unit Forecast, by Modality 2019 & 2032
- Table 9: Global MEA Portable X-Ray Devices Industry Revenue Million Forecast, by Geography 2019 & 2032
- Table 10: Global MEA Portable X-Ray Devices Industry Volume K Unit Forecast, by Geography 2019 & 2032
- Table 11: Global MEA Portable X-Ray Devices Industry Revenue Million Forecast, by Region 2019 & 2032
- Table 12: Global MEA Portable X-Ray Devices Industry Volume K Unit Forecast, by Region 2019 & 2032
- Table 13: Global MEA Portable X-Ray Devices Industry Revenue Million Forecast, by Country 2019 & 2032
- Table 14: Global MEA Portable X-Ray Devices Industry Volume K Unit Forecast, by Country 2019 & 2032
- Table 15: United States MEA Portable X-Ray Devices Industry Revenue (Million) Forecast, by Application 2019 & 2032
- Table 16: United States MEA Portable X-Ray Devices Industry Volume (K Unit) Forecast, by Application 2019 & 2032
- Table 17: Canada MEA Portable X-Ray Devices Industry Revenue (Million) Forecast, by Application 2019 & 2032
- Table 18: Canada MEA Portable X-Ray Devices Industry Volume (K Unit) Forecast, by Application 2019 & 2032
- Table 19: Mexico MEA Portable X-Ray Devices Industry Revenue (Million) Forecast, by Application 2019 & 2032
- Table 20: Mexico MEA Portable X-Ray Devices Industry Volume (K Unit) Forecast, by Application 2019 & 2032
- Table 21: Global MEA Portable X-Ray Devices Industry Revenue Million Forecast, by Country 2019 & 2032
- Table 22: Global MEA Portable X-Ray Devices Industry Volume K Unit Forecast, by Country 2019 & 2032
- Table 23: Germany MEA Portable X-Ray Devices Industry Revenue (Million) Forecast, by Application 2019 & 2032
- Table 24: Germany MEA Portable X-Ray Devices Industry Volume (K Unit) Forecast, by Application 2019 & 2032
- Table 25: United Kingdom MEA Portable X-Ray Devices Industry Revenue (Million) Forecast, by Application 2019 & 2032
- Table 26: United Kingdom MEA Portable X-Ray Devices Industry Volume (K Unit) Forecast, by Application 2019 & 2032
- Table 27: France MEA Portable X-Ray Devices Industry Revenue (Million) Forecast, by Application 2019 & 2032
- Table 28: France MEA Portable X-Ray Devices Industry Volume (K Unit) Forecast, by Application 2019 & 2032
- Table 29: Spain MEA Portable X-Ray Devices Industry Revenue (Million) Forecast, by Application 2019 & 2032
- Table 30: Spain MEA Portable X-Ray Devices Industry Volume (K Unit) Forecast, by Application 2019 & 2032
- Table 31: Italy MEA Portable X-Ray Devices Industry Revenue (Million) Forecast, by Application 2019 & 2032
- Table 32: Italy MEA Portable X-Ray Devices Industry Volume (K Unit) Forecast, by Application 2019 & 2032
- Table 33: Spain MEA Portable X-Ray Devices Industry Revenue (Million) Forecast, by Application 2019 & 2032
- Table 34: Spain MEA Portable X-Ray Devices Industry Volume (K Unit) Forecast, by Application 2019 & 2032
- Table 35: Belgium MEA Portable X-Ray Devices Industry Revenue (Million) Forecast, by Application 2019 & 2032
- Table 36: Belgium MEA Portable X-Ray Devices Industry Volume (K Unit) Forecast, by Application 2019 & 2032
- Table 37: Netherland MEA Portable X-Ray Devices Industry Revenue (Million) Forecast, by Application 2019 & 2032
- Table 38: Netherland MEA Portable X-Ray Devices Industry Volume (K Unit) Forecast, by Application 2019 & 2032
- Table 39: Nordics MEA Portable X-Ray Devices Industry Revenue (Million) Forecast, by Application 2019 & 2032
- Table 40: Nordics MEA Portable X-Ray Devices Industry Volume (K Unit) Forecast, by Application 2019 & 2032
- Table 41: Rest of Europe MEA Portable X-Ray Devices Industry Revenue (Million) Forecast, by Application 2019 & 2032
- Table 42: Rest of Europe MEA Portable X-Ray Devices Industry Volume (K Unit) Forecast, by Application 2019 & 2032
- Table 43: Global MEA Portable X-Ray Devices Industry Revenue Million Forecast, by Country 2019 & 2032
- Table 44: Global MEA Portable X-Ray Devices Industry Volume K Unit Forecast, by Country 2019 & 2032
- Table 45: China MEA Portable X-Ray Devices Industry Revenue (Million) Forecast, by Application 2019 & 2032
- Table 46: China MEA Portable X-Ray Devices Industry Volume (K Unit) Forecast, by Application 2019 & 2032
- Table 47: Japan MEA Portable X-Ray Devices Industry Revenue (Million) Forecast, by Application 2019 & 2032
- Table 48: Japan MEA Portable X-Ray Devices Industry Volume (K Unit) Forecast, by Application 2019 & 2032
- Table 49: India MEA Portable X-Ray Devices Industry Revenue (Million) Forecast, by Application 2019 & 2032
- Table 50: India MEA Portable X-Ray Devices Industry Volume (K Unit) Forecast, by Application 2019 & 2032
- Table 51: South Korea MEA Portable X-Ray Devices Industry Revenue (Million) Forecast, by Application 2019 & 2032
- Table 52: South Korea MEA Portable X-Ray Devices Industry Volume (K Unit) Forecast, by Application 2019 & 2032
- Table 53: Southeast Asia MEA Portable X-Ray Devices Industry Revenue (Million) Forecast, by Application 2019 & 2032
- Table 54: Southeast Asia MEA Portable X-Ray Devices Industry Volume (K Unit) Forecast, by Application 2019 & 2032
- Table 55: Australia MEA Portable X-Ray Devices Industry Revenue (Million) Forecast, by Application 2019 & 2032
- Table 56: Australia MEA Portable X-Ray Devices Industry Volume (K Unit) Forecast, by Application 2019 & 2032
- Table 57: Indonesia MEA Portable X-Ray Devices Industry Revenue (Million) Forecast, by Application 2019 & 2032
- Table 58: Indonesia MEA Portable X-Ray Devices Industry Volume (K Unit) Forecast, by Application 2019 & 2032
- Table 59: Phillipes MEA Portable X-Ray Devices Industry Revenue (Million) Forecast, by Application 2019 & 2032
- Table 60: Phillipes MEA Portable X-Ray Devices Industry Volume (K Unit) Forecast, by Application 2019 & 2032
- Table 61: Singapore MEA Portable X-Ray Devices Industry Revenue (Million) Forecast, by Application 2019 & 2032
- Table 62: Singapore MEA Portable X-Ray Devices Industry Volume (K Unit) Forecast, by Application 2019 & 2032
- Table 63: Thailandc MEA Portable X-Ray Devices Industry Revenue (Million) Forecast, by Application 2019 & 2032
- Table 64: Thailandc MEA Portable X-Ray Devices Industry Volume (K Unit) Forecast, by Application 2019 & 2032
- Table 65: Rest of Asia Pacific MEA Portable X-Ray Devices Industry Revenue (Million) Forecast, by Application 2019 & 2032
- Table 66: Rest of Asia Pacific MEA Portable X-Ray Devices Industry Volume (K Unit) Forecast, by Application 2019 & 2032
- Table 67: Global MEA Portable X-Ray Devices Industry Revenue Million Forecast, by Country 2019 & 2032
- Table 68: Global MEA Portable X-Ray Devices Industry Volume K Unit Forecast, by Country 2019 & 2032
- Table 69: Brazil MEA Portable X-Ray Devices Industry Revenue (Million) Forecast, by Application 2019 & 2032
- Table 70: Brazil MEA Portable X-Ray Devices Industry Volume (K Unit) Forecast, by Application 2019 & 2032
- Table 71: Argentina MEA Portable X-Ray Devices Industry Revenue (Million) Forecast, by Application 2019 & 2032
- Table 72: Argentina MEA Portable X-Ray Devices Industry Volume (K Unit) Forecast, by Application 2019 & 2032
- Table 73: Peru MEA Portable X-Ray Devices Industry Revenue (Million) Forecast, by Application 2019 & 2032
- Table 74: Peru MEA Portable X-Ray Devices Industry Volume (K Unit) Forecast, by Application 2019 & 2032
- Table 75: Chile MEA Portable X-Ray Devices Industry Revenue (Million) Forecast, by Application 2019 & 2032
- Table 76: Chile MEA Portable X-Ray Devices Industry Volume (K Unit) Forecast, by Application 2019 & 2032
- Table 77: Colombia MEA Portable X-Ray Devices Industry Revenue (Million) Forecast, by Application 2019 & 2032
- Table 78: Colombia MEA Portable X-Ray Devices Industry Volume (K Unit) Forecast, by Application 2019 & 2032
- Table 79: Ecuador MEA Portable X-Ray Devices Industry Revenue (Million) Forecast, by Application 2019 & 2032
- Table 80: Ecuador MEA Portable X-Ray Devices Industry Volume (K Unit) Forecast, by Application 2019 & 2032
- Table 81: Venezuela MEA Portable X-Ray Devices Industry Revenue (Million) Forecast, by Application 2019 & 2032
- Table 82: Venezuela MEA Portable X-Ray Devices Industry Volume (K Unit) Forecast, by Application 2019 & 2032
- Table 83: Rest of South America MEA Portable X-Ray Devices Industry Revenue (Million) Forecast, by Application 2019 & 2032
- Table 84: Rest of South America MEA Portable X-Ray Devices Industry Volume (K Unit) Forecast, by Application 2019 & 2032
- Table 85: Global MEA Portable X-Ray Devices Industry Revenue Million Forecast, by Country 2019 & 2032
- Table 86: Global MEA Portable X-Ray Devices Industry Volume K Unit Forecast, by Country 2019 & 2032
- Table 87: United Arab Emirates MEA Portable X-Ray Devices Industry Revenue (Million) Forecast, by Application 2019 & 2032
- Table 88: United Arab Emirates MEA Portable X-Ray Devices Industry Volume (K Unit) Forecast, by Application 2019 & 2032
- Table 89: Saudi Arabia MEA Portable X-Ray Devices Industry Revenue (Million) Forecast, by Application 2019 & 2032
- Table 90: Saudi Arabia MEA Portable X-Ray Devices Industry Volume (K Unit) Forecast, by Application 2019 & 2032
- Table 91: South Africa MEA Portable X-Ray Devices Industry Revenue (Million) Forecast, by Application 2019 & 2032
- Table 92: South Africa MEA Portable X-Ray Devices Industry Volume (K Unit) Forecast, by Application 2019 & 2032
- Table 93: Rest of Middle East and Africa MEA Portable X-Ray Devices Industry Revenue (Million) Forecast, by Application 2019 & 2032
- Table 94: Rest of Middle East and Africa MEA Portable X-Ray Devices Industry Volume (K Unit) Forecast, by Application 2019 & 2032
- Table 95: Global MEA Portable X-Ray Devices Industry Revenue Million Forecast, by Technology 2019 & 2032
- Table 96: Global MEA Portable X-Ray Devices Industry Volume K Unit Forecast, by Technology 2019 & 2032
- Table 97: Global MEA Portable X-Ray Devices Industry Revenue Million Forecast, by Application 2019 & 2032
- Table 98: Global MEA Portable X-Ray Devices Industry Volume K Unit Forecast, by Application 2019 & 2032
- Table 99: Global MEA Portable X-Ray Devices Industry Revenue Million Forecast, by Modality 2019 & 2032
- Table 100: Global MEA Portable X-Ray Devices Industry Volume K Unit Forecast, by Modality 2019 & 2032
- Table 101: Global MEA Portable X-Ray Devices Industry Revenue Million Forecast, by Geography 2019 & 2032
- Table 102: Global MEA Portable X-Ray Devices Industry Volume K Unit Forecast, by Geography 2019 & 2032
- Table 103: Global MEA Portable X-Ray Devices Industry Revenue Million Forecast, by Country 2019 & 2032
- Table 104: Global MEA Portable X-Ray Devices Industry Volume K Unit Forecast, by Country 2019 & 2032
- Table 105: Global MEA Portable X-Ray Devices Industry Revenue Million Forecast, by Technology 2019 & 2032
- Table 106: Global MEA Portable X-Ray Devices Industry Volume K Unit Forecast, by Technology 2019 & 2032
- Table 107: Global MEA Portable X-Ray Devices Industry Revenue Million Forecast, by Application 2019 & 2032
- Table 108: Global MEA Portable X-Ray Devices Industry Volume K Unit Forecast, by Application 2019 & 2032
- Table 109: Global MEA Portable X-Ray Devices Industry Revenue Million Forecast, by Modality 2019 & 2032
- Table 110: Global MEA Portable X-Ray Devices Industry Volume K Unit Forecast, by Modality 2019 & 2032
- Table 111: Global MEA Portable X-Ray Devices Industry Revenue Million Forecast, by Geography 2019 & 2032
- Table 112: Global MEA Portable X-Ray Devices Industry Volume K Unit Forecast, by Geography 2019 & 2032
- Table 113: Global MEA Portable X-Ray Devices Industry Revenue Million Forecast, by Country 2019 & 2032
- Table 114: Global MEA Portable X-Ray Devices Industry Volume K Unit Forecast, by Country 2019 & 2032
- Table 115: Global MEA Portable X-Ray Devices Industry Revenue Million Forecast, by Technology 2019 & 2032
- Table 116: Global MEA Portable X-Ray Devices Industry Volume K Unit Forecast, by Technology 2019 & 2032
- Table 117: Global MEA Portable X-Ray Devices Industry Revenue Million Forecast, by Application 2019 & 2032
- Table 118: Global MEA Portable X-Ray Devices Industry Volume K Unit Forecast, by Application 2019 & 2032
- Table 119: Global MEA Portable X-Ray Devices Industry Revenue Million Forecast, by Modality 2019 & 2032
- Table 120: Global MEA Portable X-Ray Devices Industry Volume K Unit Forecast, by Modality 2019 & 2032
- Table 121: Global MEA Portable X-Ray Devices Industry Revenue Million Forecast, by Geography 2019 & 2032
- Table 122: Global MEA Portable X-Ray Devices Industry Volume K Unit Forecast, by Geography 2019 & 2032
- Table 123: Global MEA Portable X-Ray Devices Industry Revenue Million Forecast, by Country 2019 & 2032
- Table 124: Global MEA Portable X-Ray Devices Industry Volume K Unit Forecast, by Country 2019 & 2032
Frequently Asked Questions
1. What is the projected Compound Annual Growth Rate (CAGR) of the MEA Portable X-Ray Devices Industry?
The projected CAGR is approximately 7.67%.
2. Which companies are prominent players in the MEA Portable X-Ray Devices Industry?
Key companies in the market include Siemens Healthineers, Ziehm Imaging GmbH, KaVo Dental, Fujifilm Corporation, Carestream Health, General Electric Company (GE Healthcare), Koninklijke Philips NV, Canon Medical Systems, Shimadzu Corporations.
3. What are the main segments of the MEA Portable X-Ray Devices Industry?
The market segments include Technology, Application, Modality, Geography.
4. Can you provide details about the market size?
The market size is estimated to be USD 321.39 Million as of 2022.
5. What are some drivers contributing to market growth?
Technological Advancements and Rise in Awareness Regarding Portable Devices; Increase in Geriatric Population with Mobility Issues.
6. What are the notable trends driving market growth?
Digital X-ray is Expected to Hold a Significant Share of the Market During the Forecasted Period.
7. Are there any restraints impacting market growth?
High Risk of Radiation Exposure.
8. Can you provide examples of recent developments in the market?
In January 2023, LG demonstrated its new medical monitors and digital x-ray detectors, offering improved diagnostic accuracy and transforming patient care at Arab Health 2023.
9. What pricing options are available for accessing the report?
Pricing options include single-user, multi-user, and enterprise licenses priced at USD 4750, USD 5250, and USD 8750 respectively.
10. Is the market size provided in terms of value or volume?
The market size is provided in terms of value, measured in Million and volume, measured in K Unit.
11. Are there any specific market keywords associated with the report?
Yes, the market keyword associated with the report is "MEA Portable X-Ray Devices Industry," which aids in identifying and referencing the specific market segment covered.
12. How do I determine which pricing option suits my needs best?
The pricing options vary based on user requirements and access needs. Individual users may opt for single-user licenses, while businesses requiring broader access may choose multi-user or enterprise licenses for cost-effective access to the report.
13. Are there any additional resources or data provided in the MEA Portable X-Ray Devices Industry report?
While the report offers comprehensive insights, it's advisable to review the specific contents or supplementary materials provided to ascertain if additional resources or data are available.
14. How can I stay updated on further developments or reports in the MEA Portable X-Ray Devices Industry?
To stay informed about further developments, trends, and reports in the MEA Portable X-Ray Devices Industry, consider subscribing to industry newsletters, following relevant companies and organizations, or regularly checking reputable industry news sources and publications.
Methodology
Step 1 - Identification of Relevant Samples Size from Population Database


Step 2 - Approaches for Defining Global Market Size (Value, Volume* & Price*)

Note*: In applicable scenarios
Step 3 - Data Sources
Primary Research
- Web Analytics
- Survey Reports
- Research Institute
- Latest Research Reports
- Opinion Leaders
Secondary Research
- Annual Reports
- White Paper
- Latest Press Release
- Industry Association
- Paid Database
- Investor Presentations

Step 4 - Data Triangulation
Involves using different sources of information in order to increase the validity of a study
These sources are likely to be stakeholders in a program - participants, other researchers, program staff, other community members, and so on.
Then we put all data in single framework & apply various statistical tools to find out the dynamic on the market.
During the analysis stage, feedback from the stakeholder groups would be compared to determine areas of agreement as well as areas of divergence


