
Key Insights
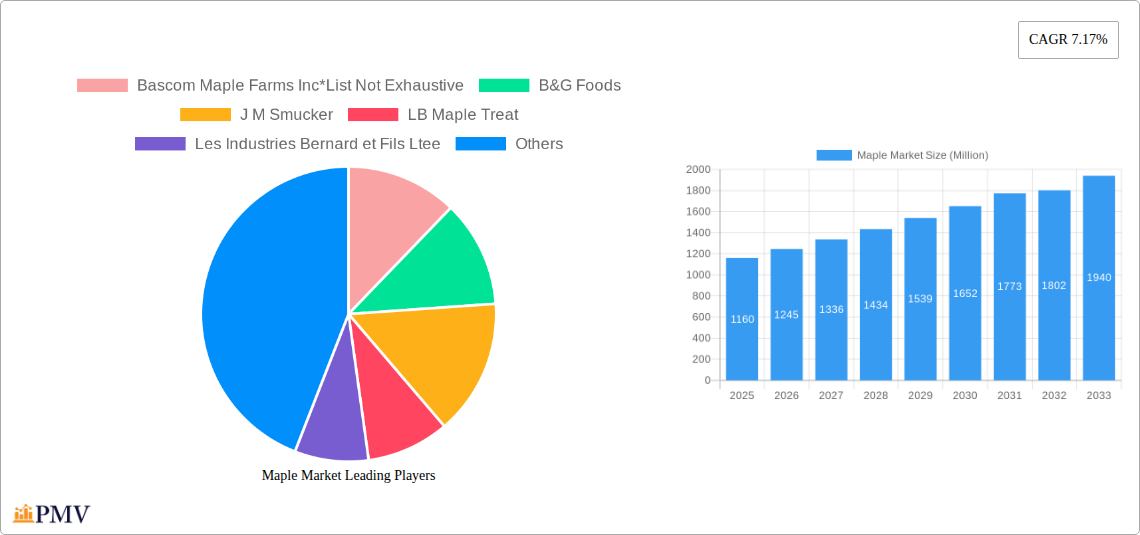
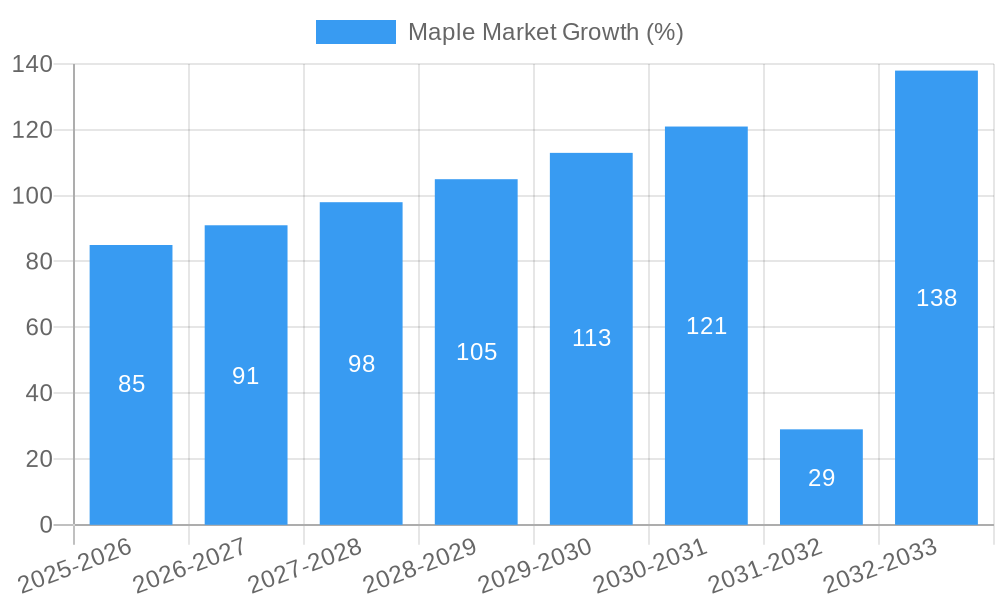
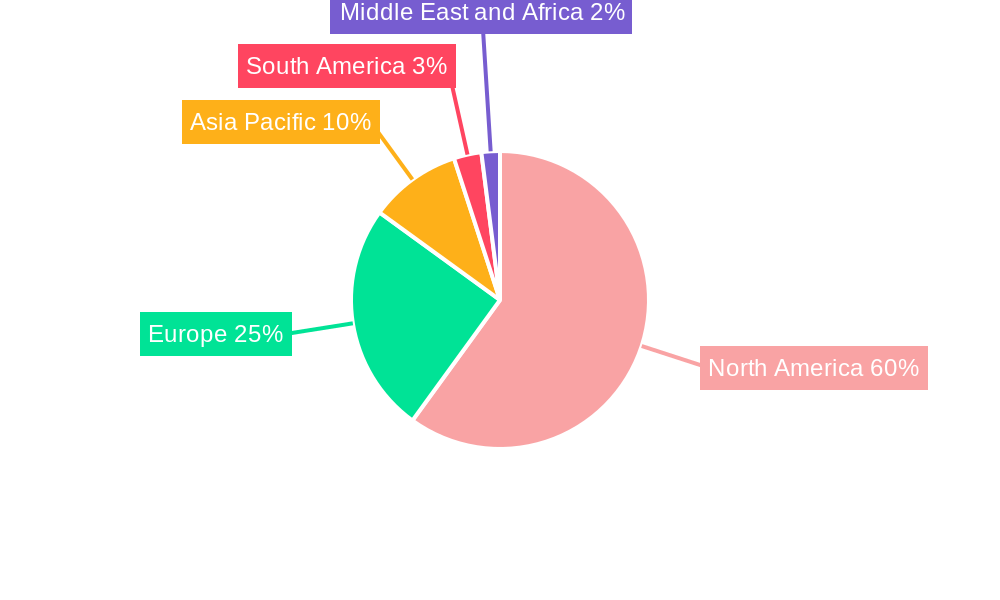
The global maple syrup market, valued at $1.16 billion in 2025, is projected to experience robust growth, driven by increasing consumer demand for natural sweeteners and the rising popularity of maple syrup in various food and beverage applications. The compound annual growth rate (CAGR) of 7.17% from 2025 to 2033 indicates a significant expansion of the market over the forecast period. Key drivers include the growing health-conscious consumer base seeking healthier alternatives to refined sugars, the increasing awareness of maple syrup's nutritional benefits, and its versatility as an ingredient in diverse culinary applications, ranging from breakfast staples to savory dishes. Furthermore, the expanding food service industry, particularly in North America and Europe, contributes significantly to market growth by incorporating maple syrup into various menu items. The market segmentation reveals a preference for organic maple syrup, reflecting the overarching trend towards organic and sustainably sourced products. While the dominance of supermarket and hypermarket distribution channels is expected to continue, online retail channels are poised for significant growth, mirroring the broader shift towards e-commerce in the food and beverage sector. Competitive forces are characterized by a mix of established players, such as B&G Foods and J.M. Smucker, and smaller regional producers, indicating diverse market participation and growth potential. The regional breakdown suggests North America will retain a major market share due to established production and consumption patterns, while other regions, especially Asia Pacific, are anticipated to witness substantial growth due to increasing awareness and product penetration.
Growth will likely be influenced by factors such as fluctuating maple sap production due to climatic variations, pricing fluctuations, and the emergence of substitute sweeteners. However, industry initiatives focusing on sustainable harvesting practices and the development of innovative maple-based products are expected to mitigate these challenges. The increasing demand for premium and specialty maple syrups, including those with unique flavor profiles, presents further opportunities for market expansion. The market's growth trajectory suggests a bright future for maple syrup producers who can capitalize on evolving consumer preferences and adapt to the dynamic market landscape by focusing on product diversification, strategic partnerships, and expansion into emerging markets.
Maple Market: A Comprehensive Market Report (2019-2033)
This comprehensive report provides an in-depth analysis of the global Maple Market, projecting a market value exceeding $XX Million by 2033. The study covers the period from 2019 to 2033, with 2025 serving as the base and estimated year. This report is invaluable for industry stakeholders, investors, and anyone seeking to understand the dynamics of this lucrative market. Detailed segmentation, competitive analysis, and future projections are included, providing actionable insights for strategic decision-making.
Maple Market Market Structure & Competitive Dynamics
The Maple Market exhibits a moderately concentrated structure, with key players like J M Smucker, B&G Foods, and HJ Heinz Company holding significant market share. However, a multitude of smaller, regional producers, such as Bascom Maple Farms Inc, Les Industries Bernard et Fils Ltee, and Vermont Maple Sugar Maker Association, contribute significantly to the overall market volume. The market's innovation ecosystem is dynamic, with ongoing advancements in processing techniques and product diversification driving growth.
Regulatory frameworks vary across regions, influencing production standards and labeling requirements. Product substitutes, like other sweeteners (e.g., agave nectar, honey), pose a degree of competitive pressure, though maple syrup’s unique flavor profile maintains its distinct market position. End-user trends show a growing preference for organic and sustainably sourced maple products, prompting increased focus on ethical sourcing and environmentally friendly production practices. M&A activity in the sector has been moderate in recent years, with deal values averaging approximately $XX Million. Specific examples include B&G Foods' divestiture of its manufacturing facility in 2021.
- Market Concentration: Moderately concentrated, with a few major players and numerous smaller producers.
- Innovation Ecosystem: Active, focused on improved processing, product diversification (e.g., maple-flavored beverages), and sustainable practices.
- Regulatory Frameworks: Vary significantly by region, impacting production and labeling.
- Product Substitutes: Competition exists from other sweeteners, but maple syrup's unique flavor profile provides a competitive edge.
- M&A Activity: Moderate, with recent deals averaging $XX Million in value (e.g., B&G Foods' divestiture).
Maple Market Industry Trends & Insights
The Maple Market is experiencing robust growth, driven by factors such as increasing consumer demand for natural and healthier sweeteners, rising disposable incomes in developing economies, and the expanding popularity of maple syrup in diverse culinary applications. The Compound Annual Growth Rate (CAGR) is projected to be XX% during the forecast period (2025-2033), leading to a market value exceeding $XX Million by 2033. Market penetration is highest in North America, but growth is also significant in Asian and European markets, driven by increasing awareness and availability.
Technological disruptions are limited, with most advancements centered around refining existing processes for greater efficiency and sustainability. However, innovative product development, such as maple-infused beverages and specialty food items, contributes significantly to market expansion. Consumer preferences lean towards organic and ethically sourced maple products, reflecting a growing awareness of sustainability and health. Competitive dynamics are shaped by both large multinational corporations and smaller, specialized producers, each catering to unique market segments.
Dominant Markets & Segments in Maple Market
The North American market, particularly the United States and Canada, dominates the global maple syrup market. This dominance is attributed to high maple production volumes, strong consumer preference for maple products, and established distribution networks.
- Key Drivers of North American Dominance:
- Established maple production infrastructure and expertise.
- Strong consumer demand fueled by cultural familiarity and preference.
- Efficient distribution channels catering to both domestic and international markets.
- Favorable government policies supporting the maple industry.
Within the maple market, the conventional segment currently holds a larger market share compared to the organic segment, though the latter is experiencing rapid growth due to increasing consumer health consciousness. Among types, Sugar Maple syrup dominates due to its widespread availability and versatility. In terms of distribution channels, supermarkets and hypermarkets hold the largest market share, followed by specialty stores and online retail channels.
- Growth Projections: The organic segment exhibits the highest projected growth rate due to increasing consumer demand for healthier alternatives. Online retail is expected to demonstrate strong growth, driven by increasing e-commerce penetration.
Maple Market Product Innovations
Recent product innovations focus on expanding the application of maple syrup beyond its traditional use as a sweetener. This includes the introduction of maple-flavored beverages, confectionery items, and specialty food products. These innovations cater to evolving consumer preferences and broaden the overall market appeal of maple syrup, tapping into growing demands for innovative and natural food products. The key competitive advantage lies in leveraging the unique flavor profile and health attributes of maple syrup in new and exciting ways.
Report Segmentation & Scope
This report offers detailed segmentation of the Maple Market across various parameters:
Category: Organic and Conventional, with growth projections for each segment based on consumer preference and production capacity. Competitive dynamics vary, with larger corporations typically focusing on conventional products, while smaller producers often emphasize organic offerings.
Type: Black Maple, Red Maple, and Sugar Maple, each exhibiting distinct flavor profiles and market demand. Market size and competitive dynamics vary for each type, depending on factors such as yield, processing efficiency, and consumer preference.
Distribution Channel: Supermarket and Hypermarket, Convenience Store, Specialty Stores, Online Retail Stores, and Other Distribution Channels. Each channel exhibits unique competitive dynamics. Online retail is experiencing rapid growth.
Key Drivers of Maple Market Growth
The Maple Market is driven by several factors: growing health consciousness leading to increased demand for natural sweeteners; expanding culinary applications; rising disposable incomes in emerging economies driving premium food consumption; and government initiatives promoting sustainable agricultural practices. Specific examples include the increasing popularity of maple-infused products in various food and beverage categories and the rise of the 'clean label' trend, which favors natural ingredients.
Challenges in the Maple Market Sector
Challenges include: seasonal production impacting supply chain consistency; price fluctuations due to weather conditions and global demand; competition from other sweeteners; and ensuring the sustainability of maple production given environmental considerations. These challenges, if not properly addressed, can lead to supply shortages and price volatility, potentially impacting market growth.
Leading Players in the Maple Market Market
- Bascom Maple Farms Inc
- B&G Foods
- J M Smucker
- LB Maple Treat
- Les Industries Bernard et Fils Ltee
- Federation of Quebec Maple Syrup Producers
- Vermont Maple Sugar Maker Association
- Thompsons maple product
- Bascom family farms
- HJ Heinz Company
Key Developments in Maple Market Sector
- December 2021: The Federation of Quebec Maple Syrup Producers released more than half of its syrup stockpile, potentially impacting prices and market supply.
- August 2021: B&G Foods sold its manufacturing facility, impacting its production capacity and potentially its market share.
- March 2022: PepsiCo's limited-edition maple syrup cola demonstrated the potential for innovative product collaborations to expand market reach.
Strategic Maple Market Market Outlook
The Maple Market presents significant future potential, driven by increasing demand for natural sweeteners and innovative product applications. Strategic opportunities include expanding into new geographical markets, focusing on sustainable and ethical sourcing practices, and developing innovative product lines to meet evolving consumer preferences. The focus on health, sustainability, and unique flavor profiles will continue to drive the market's future growth, presenting lucrative opportunities for both established players and new entrants.
Maple Market Segmentation
-
1. Category
- 1.1. Organic
- 1.2. Conventional
-
2. Type
- 2.1. Black Maple
- 2.2. Red Maple
- 2.3. Sugar Maple
-
3. Distribution Channel
- 3.1. Supermarket and Hypermarket
- 3.2. Convenience Store
- 3.3. Specialty Stores
- 3.4. Online Retail Stores
- 3.5. Other Distribution Channels
Maple Market Segmentation By Geography
-
1. North America
- 1.1. United States
- 1.2. Canada
- 1.3. Mexico
- 1.4. Rest of North America
-
2. Europe
- 2.1. Germany
- 2.2. United Kingdom
- 2.3. France
- 2.4. Russia
- 2.5. Spain
- 2.6. Italy
- 2.7. Rest of Europe
-
3. Asia Pacific
- 3.1. India
- 3.2. China
- 3.3. Japan
- 3.4. Rest of Asia Pacific
-
4. South America
- 4.1. Brazil
- 4.2. Argentina
- 4.3. Rest of South America
-
5. Middle East and Africa
- 5.1. United Arab Emirates
- 5.2. South Africa
- 5.3. Rest of Middle East and Africa
Maple Market REPORT HIGHLIGHTS
| Aspects | Details |
|---|---|
| Study Period | 2019-2033 |
| Base Year | 2024 |
| Estimated Year | 2025 |
| Forecast Period | 2025-2033 |
| Historical Period | 2019-2024 |
| Growth Rate | CAGR of 7.17% from 2019-2033 |
| Segmentation |
|
Table of Contents
- 1. Introduction
- 1.1. Research Scope
- 1.2. Market Segmentation
- 1.3. Research Methodology
- 1.4. Definitions and Assumptions
- 2. Executive Summary
- 2.1. Introduction
- 3. Market Dynamics
- 3.1. Introduction
- 3.2. Market Drivers
- 3.2.1. Prevalence of Lactose Intolerance Driving the Market; Growing Influence of Healthy Lifestyle Trends and Rising Non-Traditional Users
- 3.3. Market Restrains
- 3.3.1. Wide Availability of Alternative Protein Sources
- 3.4. Market Trends
- 3.4.1. Utilization of Maple Syrup as a Flavoring Agent
- 4. Market Factor Analysis
- 4.1. Porters Five Forces
- 4.2. Supply/Value Chain
- 4.3. PESTEL analysis
- 4.4. Market Entropy
- 4.5. Patent/Trademark Analysis
- 5. Global Maple Market Analysis, Insights and Forecast, 2019-2031
- 5.1. Market Analysis, Insights and Forecast - by Category
- 5.1.1. Organic
- 5.1.2. Conventional
- 5.2. Market Analysis, Insights and Forecast - by Type
- 5.2.1. Black Maple
- 5.2.2. Red Maple
- 5.2.3. Sugar Maple
- 5.3. Market Analysis, Insights and Forecast - by Distribution Channel
- 5.3.1. Supermarket and Hypermarket
- 5.3.2. Convenience Store
- 5.3.3. Specialty Stores
- 5.3.4. Online Retail Stores
- 5.3.5. Other Distribution Channels
- 5.4. Market Analysis, Insights and Forecast - by Region
- 5.4.1. North America
- 5.4.2. Europe
- 5.4.3. Asia Pacific
- 5.4.4. South America
- 5.4.5. Middle East and Africa
- 5.1. Market Analysis, Insights and Forecast - by Category
- 6. North America Maple Market Analysis, Insights and Forecast, 2019-2031
- 6.1. Market Analysis, Insights and Forecast - by Category
- 6.1.1. Organic
- 6.1.2. Conventional
- 6.2. Market Analysis, Insights and Forecast - by Type
- 6.2.1. Black Maple
- 6.2.2. Red Maple
- 6.2.3. Sugar Maple
- 6.3. Market Analysis, Insights and Forecast - by Distribution Channel
- 6.3.1. Supermarket and Hypermarket
- 6.3.2. Convenience Store
- 6.3.3. Specialty Stores
- 6.3.4. Online Retail Stores
- 6.3.5. Other Distribution Channels
- 6.1. Market Analysis, Insights and Forecast - by Category
- 7. Europe Maple Market Analysis, Insights and Forecast, 2019-2031
- 7.1. Market Analysis, Insights and Forecast - by Category
- 7.1.1. Organic
- 7.1.2. Conventional
- 7.2. Market Analysis, Insights and Forecast - by Type
- 7.2.1. Black Maple
- 7.2.2. Red Maple
- 7.2.3. Sugar Maple
- 7.3. Market Analysis, Insights and Forecast - by Distribution Channel
- 7.3.1. Supermarket and Hypermarket
- 7.3.2. Convenience Store
- 7.3.3. Specialty Stores
- 7.3.4. Online Retail Stores
- 7.3.5. Other Distribution Channels
- 7.1. Market Analysis, Insights and Forecast - by Category
- 8. Asia Pacific Maple Market Analysis, Insights and Forecast, 2019-2031
- 8.1. Market Analysis, Insights and Forecast - by Category
- 8.1.1. Organic
- 8.1.2. Conventional
- 8.2. Market Analysis, Insights and Forecast - by Type
- 8.2.1. Black Maple
- 8.2.2. Red Maple
- 8.2.3. Sugar Maple
- 8.3. Market Analysis, Insights and Forecast - by Distribution Channel
- 8.3.1. Supermarket and Hypermarket
- 8.3.2. Convenience Store
- 8.3.3. Specialty Stores
- 8.3.4. Online Retail Stores
- 8.3.5. Other Distribution Channels
- 8.1. Market Analysis, Insights and Forecast - by Category
- 9. South America Maple Market Analysis, Insights and Forecast, 2019-2031
- 9.1. Market Analysis, Insights and Forecast - by Category
- 9.1.1. Organic
- 9.1.2. Conventional
- 9.2. Market Analysis, Insights and Forecast - by Type
- 9.2.1. Black Maple
- 9.2.2. Red Maple
- 9.2.3. Sugar Maple
- 9.3. Market Analysis, Insights and Forecast - by Distribution Channel
- 9.3.1. Supermarket and Hypermarket
- 9.3.2. Convenience Store
- 9.3.3. Specialty Stores
- 9.3.4. Online Retail Stores
- 9.3.5. Other Distribution Channels
- 9.1. Market Analysis, Insights and Forecast - by Category
- 10. Middle East and Africa Maple Market Analysis, Insights and Forecast, 2019-2031
- 10.1. Market Analysis, Insights and Forecast - by Category
- 10.1.1. Organic
- 10.1.2. Conventional
- 10.2. Market Analysis, Insights and Forecast - by Type
- 10.2.1. Black Maple
- 10.2.2. Red Maple
- 10.2.3. Sugar Maple
- 10.3. Market Analysis, Insights and Forecast - by Distribution Channel
- 10.3.1. Supermarket and Hypermarket
- 10.3.2. Convenience Store
- 10.3.3. Specialty Stores
- 10.3.4. Online Retail Stores
- 10.3.5. Other Distribution Channels
- 10.1. Market Analysis, Insights and Forecast - by Category
- 11. North America Maple Market Analysis, Insights and Forecast, 2019-2031
- 11.1. Market Analysis, Insights and Forecast - By Country/Sub-region
- 11.1.1 United States
- 11.1.2 Canada
- 11.1.3 Mexico
- 11.1.4 Rest of North America
- 12. Europe Maple Market Analysis, Insights and Forecast, 2019-2031
- 12.1. Market Analysis, Insights and Forecast - By Country/Sub-region
- 12.1.1 Germany
- 12.1.2 United Kingdom
- 12.1.3 France
- 12.1.4 Russia
- 12.1.5 Spain
- 12.1.6 Italy
- 12.1.7 Rest of Europe
- 13. Asia Pacific Maple Market Analysis, Insights and Forecast, 2019-2031
- 13.1. Market Analysis, Insights and Forecast - By Country/Sub-region
- 13.1.1 India
- 13.1.2 China
- 13.1.3 Japan
- 13.1.4 Rest of Asia Pacific
- 14. South America Maple Market Analysis, Insights and Forecast, 2019-2031
- 14.1. Market Analysis, Insights and Forecast - By Country/Sub-region
- 14.1.1 Brazil
- 14.1.2 Argentina
- 14.1.3 Rest of South America
- 15. Middle East and Africa Maple Market Analysis, Insights and Forecast, 2019-2031
- 15.1. Market Analysis, Insights and Forecast - By Country/Sub-region
- 15.1.1 United Arab Emirates
- 15.1.2 South Africa
- 15.1.3 Rest of Middle East and Africa
- 16. Competitive Analysis
- 16.1. Global Market Share Analysis 2024
- 16.2. Company Profiles
- 16.2.1 Bascom Maple Farms Inc*List Not Exhaustive
- 16.2.1.1. Overview
- 16.2.1.2. Products
- 16.2.1.3. SWOT Analysis
- 16.2.1.4. Recent Developments
- 16.2.1.5. Financials (Based on Availability)
- 16.2.2 B&G Foods
- 16.2.2.1. Overview
- 16.2.2.2. Products
- 16.2.2.3. SWOT Analysis
- 16.2.2.4. Recent Developments
- 16.2.2.5. Financials (Based on Availability)
- 16.2.3 J M Smucker
- 16.2.3.1. Overview
- 16.2.3.2. Products
- 16.2.3.3. SWOT Analysis
- 16.2.3.4. Recent Developments
- 16.2.3.5. Financials (Based on Availability)
- 16.2.4 LB Maple Treat
- 16.2.4.1. Overview
- 16.2.4.2. Products
- 16.2.4.3. SWOT Analysis
- 16.2.4.4. Recent Developments
- 16.2.4.5. Financials (Based on Availability)
- 16.2.5 Les Industries Bernard et Fils Ltee
- 16.2.5.1. Overview
- 16.2.5.2. Products
- 16.2.5.3. SWOT Analysis
- 16.2.5.4. Recent Developments
- 16.2.5.5. Financials (Based on Availability)
- 16.2.6 Federation of Quebec Maple Syrup Producers
- 16.2.6.1. Overview
- 16.2.6.2. Products
- 16.2.6.3. SWOT Analysis
- 16.2.6.4. Recent Developments
- 16.2.6.5. Financials (Based on Availability)
- 16.2.7 Vermont Maple sugar maker Association
- 16.2.7.1. Overview
- 16.2.7.2. Products
- 16.2.7.3. SWOT Analysis
- 16.2.7.4. Recent Developments
- 16.2.7.5. Financials (Based on Availability)
- 16.2.8 Thompsons maple product
- 16.2.8.1. Overview
- 16.2.8.2. Products
- 16.2.8.3. SWOT Analysis
- 16.2.8.4. Recent Developments
- 16.2.8.5. Financials (Based on Availability)
- 16.2.9 Bascom family farms
- 16.2.9.1. Overview
- 16.2.9.2. Products
- 16.2.9.3. SWOT Analysis
- 16.2.9.4. Recent Developments
- 16.2.9.5. Financials (Based on Availability)
- 16.2.10 HJ Heinz Company
- 16.2.10.1. Overview
- 16.2.10.2. Products
- 16.2.10.3. SWOT Analysis
- 16.2.10.4. Recent Developments
- 16.2.10.5. Financials (Based on Availability)
- 16.2.1 Bascom Maple Farms Inc*List Not Exhaustive
List of Figures
- Figure 1: Global Maple Market Revenue Breakdown (Million, %) by Region 2024 & 2032
- Figure 2: Global Maple Market Volume Breakdown (Liters, %) by Region 2024 & 2032
- Figure 3: North America Maple Market Revenue (Million), by Country 2024 & 2032
- Figure 4: North America Maple Market Volume (Liters), by Country 2024 & 2032
- Figure 5: North America Maple Market Revenue Share (%), by Country 2024 & 2032
- Figure 6: North America Maple Market Volume Share (%), by Country 2024 & 2032
- Figure 7: Europe Maple Market Revenue (Million), by Country 2024 & 2032
- Figure 8: Europe Maple Market Volume (Liters), by Country 2024 & 2032
- Figure 9: Europe Maple Market Revenue Share (%), by Country 2024 & 2032
- Figure 10: Europe Maple Market Volume Share (%), by Country 2024 & 2032
- Figure 11: Asia Pacific Maple Market Revenue (Million), by Country 2024 & 2032
- Figure 12: Asia Pacific Maple Market Volume (Liters), by Country 2024 & 2032
- Figure 13: Asia Pacific Maple Market Revenue Share (%), by Country 2024 & 2032
- Figure 14: Asia Pacific Maple Market Volume Share (%), by Country 2024 & 2032
- Figure 15: South America Maple Market Revenue (Million), by Country 2024 & 2032
- Figure 16: South America Maple Market Volume (Liters), by Country 2024 & 2032
- Figure 17: South America Maple Market Revenue Share (%), by Country 2024 & 2032
- Figure 18: South America Maple Market Volume Share (%), by Country 2024 & 2032
- Figure 19: Middle East and Africa Maple Market Revenue (Million), by Country 2024 & 2032
- Figure 20: Middle East and Africa Maple Market Volume (Liters), by Country 2024 & 2032
- Figure 21: Middle East and Africa Maple Market Revenue Share (%), by Country 2024 & 2032
- Figure 22: Middle East and Africa Maple Market Volume Share (%), by Country 2024 & 2032
- Figure 23: North America Maple Market Revenue (Million), by Category 2024 & 2032
- Figure 24: North America Maple Market Volume (Liters), by Category 2024 & 2032
- Figure 25: North America Maple Market Revenue Share (%), by Category 2024 & 2032
- Figure 26: North America Maple Market Volume Share (%), by Category 2024 & 2032
- Figure 27: North America Maple Market Revenue (Million), by Type 2024 & 2032
- Figure 28: North America Maple Market Volume (Liters), by Type 2024 & 2032
- Figure 29: North America Maple Market Revenue Share (%), by Type 2024 & 2032
- Figure 30: North America Maple Market Volume Share (%), by Type 2024 & 2032
- Figure 31: North America Maple Market Revenue (Million), by Distribution Channel 2024 & 2032
- Figure 32: North America Maple Market Volume (Liters), by Distribution Channel 2024 & 2032
- Figure 33: North America Maple Market Revenue Share (%), by Distribution Channel 2024 & 2032
- Figure 34: North America Maple Market Volume Share (%), by Distribution Channel 2024 & 2032
- Figure 35: North America Maple Market Revenue (Million), by Country 2024 & 2032
- Figure 36: North America Maple Market Volume (Liters), by Country 2024 & 2032
- Figure 37: North America Maple Market Revenue Share (%), by Country 2024 & 2032
- Figure 38: North America Maple Market Volume Share (%), by Country 2024 & 2032
- Figure 39: Europe Maple Market Revenue (Million), by Category 2024 & 2032
- Figure 40: Europe Maple Market Volume (Liters), by Category 2024 & 2032
- Figure 41: Europe Maple Market Revenue Share (%), by Category 2024 & 2032
- Figure 42: Europe Maple Market Volume Share (%), by Category 2024 & 2032
- Figure 43: Europe Maple Market Revenue (Million), by Type 2024 & 2032
- Figure 44: Europe Maple Market Volume (Liters), by Type 2024 & 2032
- Figure 45: Europe Maple Market Revenue Share (%), by Type 2024 & 2032
- Figure 46: Europe Maple Market Volume Share (%), by Type 2024 & 2032
- Figure 47: Europe Maple Market Revenue (Million), by Distribution Channel 2024 & 2032
- Figure 48: Europe Maple Market Volume (Liters), by Distribution Channel 2024 & 2032
- Figure 49: Europe Maple Market Revenue Share (%), by Distribution Channel 2024 & 2032
- Figure 50: Europe Maple Market Volume Share (%), by Distribution Channel 2024 & 2032
- Figure 51: Europe Maple Market Revenue (Million), by Country 2024 & 2032
- Figure 52: Europe Maple Market Volume (Liters), by Country 2024 & 2032
- Figure 53: Europe Maple Market Revenue Share (%), by Country 2024 & 2032
- Figure 54: Europe Maple Market Volume Share (%), by Country 2024 & 2032
- Figure 55: Asia Pacific Maple Market Revenue (Million), by Category 2024 & 2032
- Figure 56: Asia Pacific Maple Market Volume (Liters), by Category 2024 & 2032
- Figure 57: Asia Pacific Maple Market Revenue Share (%), by Category 2024 & 2032
- Figure 58: Asia Pacific Maple Market Volume Share (%), by Category 2024 & 2032
- Figure 59: Asia Pacific Maple Market Revenue (Million), by Type 2024 & 2032
- Figure 60: Asia Pacific Maple Market Volume (Liters), by Type 2024 & 2032
- Figure 61: Asia Pacific Maple Market Revenue Share (%), by Type 2024 & 2032
- Figure 62: Asia Pacific Maple Market Volume Share (%), by Type 2024 & 2032
- Figure 63: Asia Pacific Maple Market Revenue (Million), by Distribution Channel 2024 & 2032
- Figure 64: Asia Pacific Maple Market Volume (Liters), by Distribution Channel 2024 & 2032
- Figure 65: Asia Pacific Maple Market Revenue Share (%), by Distribution Channel 2024 & 2032
- Figure 66: Asia Pacific Maple Market Volume Share (%), by Distribution Channel 2024 & 2032
- Figure 67: Asia Pacific Maple Market Revenue (Million), by Country 2024 & 2032
- Figure 68: Asia Pacific Maple Market Volume (Liters), by Country 2024 & 2032
- Figure 69: Asia Pacific Maple Market Revenue Share (%), by Country 2024 & 2032
- Figure 70: Asia Pacific Maple Market Volume Share (%), by Country 2024 & 2032
- Figure 71: South America Maple Market Revenue (Million), by Category 2024 & 2032
- Figure 72: South America Maple Market Volume (Liters), by Category 2024 & 2032
- Figure 73: South America Maple Market Revenue Share (%), by Category 2024 & 2032
- Figure 74: South America Maple Market Volume Share (%), by Category 2024 & 2032
- Figure 75: South America Maple Market Revenue (Million), by Type 2024 & 2032
- Figure 76: South America Maple Market Volume (Liters), by Type 2024 & 2032
- Figure 77: South America Maple Market Revenue Share (%), by Type 2024 & 2032
- Figure 78: South America Maple Market Volume Share (%), by Type 2024 & 2032
- Figure 79: South America Maple Market Revenue (Million), by Distribution Channel 2024 & 2032
- Figure 80: South America Maple Market Volume (Liters), by Distribution Channel 2024 & 2032
- Figure 81: South America Maple Market Revenue Share (%), by Distribution Channel 2024 & 2032
- Figure 82: South America Maple Market Volume Share (%), by Distribution Channel 2024 & 2032
- Figure 83: South America Maple Market Revenue (Million), by Country 2024 & 2032
- Figure 84: South America Maple Market Volume (Liters), by Country 2024 & 2032
- Figure 85: South America Maple Market Revenue Share (%), by Country 2024 & 2032
- Figure 86: South America Maple Market Volume Share (%), by Country 2024 & 2032
- Figure 87: Middle East and Africa Maple Market Revenue (Million), by Category 2024 & 2032
- Figure 88: Middle East and Africa Maple Market Volume (Liters), by Category 2024 & 2032
- Figure 89: Middle East and Africa Maple Market Revenue Share (%), by Category 2024 & 2032
- Figure 90: Middle East and Africa Maple Market Volume Share (%), by Category 2024 & 2032
- Figure 91: Middle East and Africa Maple Market Revenue (Million), by Type 2024 & 2032
- Figure 92: Middle East and Africa Maple Market Volume (Liters), by Type 2024 & 2032
- Figure 93: Middle East and Africa Maple Market Revenue Share (%), by Type 2024 & 2032
- Figure 94: Middle East and Africa Maple Market Volume Share (%), by Type 2024 & 2032
- Figure 95: Middle East and Africa Maple Market Revenue (Million), by Distribution Channel 2024 & 2032
- Figure 96: Middle East and Africa Maple Market Volume (Liters), by Distribution Channel 2024 & 2032
- Figure 97: Middle East and Africa Maple Market Revenue Share (%), by Distribution Channel 2024 & 2032
- Figure 98: Middle East and Africa Maple Market Volume Share (%), by Distribution Channel 2024 & 2032
- Figure 99: Middle East and Africa Maple Market Revenue (Million), by Country 2024 & 2032
- Figure 100: Middle East and Africa Maple Market Volume (Liters), by Country 2024 & 2032
- Figure 101: Middle East and Africa Maple Market Revenue Share (%), by Country 2024 & 2032
- Figure 102: Middle East and Africa Maple Market Volume Share (%), by Country 2024 & 2032
List of Tables
- Table 1: Global Maple Market Revenue Million Forecast, by Region 2019 & 2032
- Table 2: Global Maple Market Volume Liters Forecast, by Region 2019 & 2032
- Table 3: Global Maple Market Revenue Million Forecast, by Category 2019 & 2032
- Table 4: Global Maple Market Volume Liters Forecast, by Category 2019 & 2032
- Table 5: Global Maple Market Revenue Million Forecast, by Type 2019 & 2032
- Table 6: Global Maple Market Volume Liters Forecast, by Type 2019 & 2032
- Table 7: Global Maple Market Revenue Million Forecast, by Distribution Channel 2019 & 2032
- Table 8: Global Maple Market Volume Liters Forecast, by Distribution Channel 2019 & 2032
- Table 9: Global Maple Market Revenue Million Forecast, by Region 2019 & 2032
- Table 10: Global Maple Market Volume Liters Forecast, by Region 2019 & 2032
- Table 11: Global Maple Market Revenue Million Forecast, by Country 2019 & 2032
- Table 12: Global Maple Market Volume Liters Forecast, by Country 2019 & 2032
- Table 13: United States Maple Market Revenue (Million) Forecast, by Application 2019 & 2032
- Table 14: United States Maple Market Volume (Liters) Forecast, by Application 2019 & 2032
- Table 15: Canada Maple Market Revenue (Million) Forecast, by Application 2019 & 2032
- Table 16: Canada Maple Market Volume (Liters) Forecast, by Application 2019 & 2032
- Table 17: Mexico Maple Market Revenue (Million) Forecast, by Application 2019 & 2032
- Table 18: Mexico Maple Market Volume (Liters) Forecast, by Application 2019 & 2032
- Table 19: Rest of North America Maple Market Revenue (Million) Forecast, by Application 2019 & 2032
- Table 20: Rest of North America Maple Market Volume (Liters) Forecast, by Application 2019 & 2032
- Table 21: Global Maple Market Revenue Million Forecast, by Country 2019 & 2032
- Table 22: Global Maple Market Volume Liters Forecast, by Country 2019 & 2032
- Table 23: Germany Maple Market Revenue (Million) Forecast, by Application 2019 & 2032
- Table 24: Germany Maple Market Volume (Liters) Forecast, by Application 2019 & 2032
- Table 25: United Kingdom Maple Market Revenue (Million) Forecast, by Application 2019 & 2032
- Table 26: United Kingdom Maple Market Volume (Liters) Forecast, by Application 2019 & 2032
- Table 27: France Maple Market Revenue (Million) Forecast, by Application 2019 & 2032
- Table 28: France Maple Market Volume (Liters) Forecast, by Application 2019 & 2032
- Table 29: Russia Maple Market Revenue (Million) Forecast, by Application 2019 & 2032
- Table 30: Russia Maple Market Volume (Liters) Forecast, by Application 2019 & 2032
- Table 31: Spain Maple Market Revenue (Million) Forecast, by Application 2019 & 2032
- Table 32: Spain Maple Market Volume (Liters) Forecast, by Application 2019 & 2032
- Table 33: Italy Maple Market Revenue (Million) Forecast, by Application 2019 & 2032
- Table 34: Italy Maple Market Volume (Liters) Forecast, by Application 2019 & 2032
- Table 35: Rest of Europe Maple Market Revenue (Million) Forecast, by Application 2019 & 2032
- Table 36: Rest of Europe Maple Market Volume (Liters) Forecast, by Application 2019 & 2032
- Table 37: Global Maple Market Revenue Million Forecast, by Country 2019 & 2032
- Table 38: Global Maple Market Volume Liters Forecast, by Country 2019 & 2032
- Table 39: India Maple Market Revenue (Million) Forecast, by Application 2019 & 2032
- Table 40: India Maple Market Volume (Liters) Forecast, by Application 2019 & 2032
- Table 41: China Maple Market Revenue (Million) Forecast, by Application 2019 & 2032
- Table 42: China Maple Market Volume (Liters) Forecast, by Application 2019 & 2032
- Table 43: Japan Maple Market Revenue (Million) Forecast, by Application 2019 & 2032
- Table 44: Japan Maple Market Volume (Liters) Forecast, by Application 2019 & 2032
- Table 45: Rest of Asia Pacific Maple Market Revenue (Million) Forecast, by Application 2019 & 2032
- Table 46: Rest of Asia Pacific Maple Market Volume (Liters) Forecast, by Application 2019 & 2032
- Table 47: Global Maple Market Revenue Million Forecast, by Country 2019 & 2032
- Table 48: Global Maple Market Volume Liters Forecast, by Country 2019 & 2032
- Table 49: Brazil Maple Market Revenue (Million) Forecast, by Application 2019 & 2032
- Table 50: Brazil Maple Market Volume (Liters) Forecast, by Application 2019 & 2032
- Table 51: Argentina Maple Market Revenue (Million) Forecast, by Application 2019 & 2032
- Table 52: Argentina Maple Market Volume (Liters) Forecast, by Application 2019 & 2032
- Table 53: Rest of South America Maple Market Revenue (Million) Forecast, by Application 2019 & 2032
- Table 54: Rest of South America Maple Market Volume (Liters) Forecast, by Application 2019 & 2032
- Table 55: Global Maple Market Revenue Million Forecast, by Country 2019 & 2032
- Table 56: Global Maple Market Volume Liters Forecast, by Country 2019 & 2032
- Table 57: United Arab Emirates Maple Market Revenue (Million) Forecast, by Application 2019 & 2032
- Table 58: United Arab Emirates Maple Market Volume (Liters) Forecast, by Application 2019 & 2032
- Table 59: South Africa Maple Market Revenue (Million) Forecast, by Application 2019 & 2032
- Table 60: South Africa Maple Market Volume (Liters) Forecast, by Application 2019 & 2032
- Table 61: Rest of Middle East and Africa Maple Market Revenue (Million) Forecast, by Application 2019 & 2032
- Table 62: Rest of Middle East and Africa Maple Market Volume (Liters) Forecast, by Application 2019 & 2032
- Table 63: Global Maple Market Revenue Million Forecast, by Category 2019 & 2032
- Table 64: Global Maple Market Volume Liters Forecast, by Category 2019 & 2032
- Table 65: Global Maple Market Revenue Million Forecast, by Type 2019 & 2032
- Table 66: Global Maple Market Volume Liters Forecast, by Type 2019 & 2032
- Table 67: Global Maple Market Revenue Million Forecast, by Distribution Channel 2019 & 2032
- Table 68: Global Maple Market Volume Liters Forecast, by Distribution Channel 2019 & 2032
- Table 69: Global Maple Market Revenue Million Forecast, by Country 2019 & 2032
- Table 70: Global Maple Market Volume Liters Forecast, by Country 2019 & 2032
- Table 71: United States Maple Market Revenue (Million) Forecast, by Application 2019 & 2032
- Table 72: United States Maple Market Volume (Liters) Forecast, by Application 2019 & 2032
- Table 73: Canada Maple Market Revenue (Million) Forecast, by Application 2019 & 2032
- Table 74: Canada Maple Market Volume (Liters) Forecast, by Application 2019 & 2032
- Table 75: Mexico Maple Market Revenue (Million) Forecast, by Application 2019 & 2032
- Table 76: Mexico Maple Market Volume (Liters) Forecast, by Application 2019 & 2032
- Table 77: Rest of North America Maple Market Revenue (Million) Forecast, by Application 2019 & 2032
- Table 78: Rest of North America Maple Market Volume (Liters) Forecast, by Application 2019 & 2032
- Table 79: Global Maple Market Revenue Million Forecast, by Category 2019 & 2032
- Table 80: Global Maple Market Volume Liters Forecast, by Category 2019 & 2032
- Table 81: Global Maple Market Revenue Million Forecast, by Type 2019 & 2032
- Table 82: Global Maple Market Volume Liters Forecast, by Type 2019 & 2032
- Table 83: Global Maple Market Revenue Million Forecast, by Distribution Channel 2019 & 2032
- Table 84: Global Maple Market Volume Liters Forecast, by Distribution Channel 2019 & 2032
- Table 85: Global Maple Market Revenue Million Forecast, by Country 2019 & 2032
- Table 86: Global Maple Market Volume Liters Forecast, by Country 2019 & 2032
- Table 87: Germany Maple Market Revenue (Million) Forecast, by Application 2019 & 2032
- Table 88: Germany Maple Market Volume (Liters) Forecast, by Application 2019 & 2032
- Table 89: United Kingdom Maple Market Revenue (Million) Forecast, by Application 2019 & 2032
- Table 90: United Kingdom Maple Market Volume (Liters) Forecast, by Application 2019 & 2032
- Table 91: France Maple Market Revenue (Million) Forecast, by Application 2019 & 2032
- Table 92: France Maple Market Volume (Liters) Forecast, by Application 2019 & 2032
- Table 93: Russia Maple Market Revenue (Million) Forecast, by Application 2019 & 2032
- Table 94: Russia Maple Market Volume (Liters) Forecast, by Application 2019 & 2032
- Table 95: Spain Maple Market Revenue (Million) Forecast, by Application 2019 & 2032
- Table 96: Spain Maple Market Volume (Liters) Forecast, by Application 2019 & 2032
- Table 97: Italy Maple Market Revenue (Million) Forecast, by Application 2019 & 2032
- Table 98: Italy Maple Market Volume (Liters) Forecast, by Application 2019 & 2032
- Table 99: Rest of Europe Maple Market Revenue (Million) Forecast, by Application 2019 & 2032
- Table 100: Rest of Europe Maple Market Volume (Liters) Forecast, by Application 2019 & 2032
- Table 101: Global Maple Market Revenue Million Forecast, by Category 2019 & 2032
- Table 102: Global Maple Market Volume Liters Forecast, by Category 2019 & 2032
- Table 103: Global Maple Market Revenue Million Forecast, by Type 2019 & 2032
- Table 104: Global Maple Market Volume Liters Forecast, by Type 2019 & 2032
- Table 105: Global Maple Market Revenue Million Forecast, by Distribution Channel 2019 & 2032
- Table 106: Global Maple Market Volume Liters Forecast, by Distribution Channel 2019 & 2032
- Table 107: Global Maple Market Revenue Million Forecast, by Country 2019 & 2032
- Table 108: Global Maple Market Volume Liters Forecast, by Country 2019 & 2032
- Table 109: India Maple Market Revenue (Million) Forecast, by Application 2019 & 2032
- Table 110: India Maple Market Volume (Liters) Forecast, by Application 2019 & 2032
- Table 111: China Maple Market Revenue (Million) Forecast, by Application 2019 & 2032
- Table 112: China Maple Market Volume (Liters) Forecast, by Application 2019 & 2032
- Table 113: Japan Maple Market Revenue (Million) Forecast, by Application 2019 & 2032
- Table 114: Japan Maple Market Volume (Liters) Forecast, by Application 2019 & 2032
- Table 115: Rest of Asia Pacific Maple Market Revenue (Million) Forecast, by Application 2019 & 2032
- Table 116: Rest of Asia Pacific Maple Market Volume (Liters) Forecast, by Application 2019 & 2032
- Table 117: Global Maple Market Revenue Million Forecast, by Category 2019 & 2032
- Table 118: Global Maple Market Volume Liters Forecast, by Category 2019 & 2032
- Table 119: Global Maple Market Revenue Million Forecast, by Type 2019 & 2032
- Table 120: Global Maple Market Volume Liters Forecast, by Type 2019 & 2032
- Table 121: Global Maple Market Revenue Million Forecast, by Distribution Channel 2019 & 2032
- Table 122: Global Maple Market Volume Liters Forecast, by Distribution Channel 2019 & 2032
- Table 123: Global Maple Market Revenue Million Forecast, by Country 2019 & 2032
- Table 124: Global Maple Market Volume Liters Forecast, by Country 2019 & 2032
- Table 125: Brazil Maple Market Revenue (Million) Forecast, by Application 2019 & 2032
- Table 126: Brazil Maple Market Volume (Liters) Forecast, by Application 2019 & 2032
- Table 127: Argentina Maple Market Revenue (Million) Forecast, by Application 2019 & 2032
- Table 128: Argentina Maple Market Volume (Liters) Forecast, by Application 2019 & 2032
- Table 129: Rest of South America Maple Market Revenue (Million) Forecast, by Application 2019 & 2032
- Table 130: Rest of South America Maple Market Volume (Liters) Forecast, by Application 2019 & 2032
- Table 131: Global Maple Market Revenue Million Forecast, by Category 2019 & 2032
- Table 132: Global Maple Market Volume Liters Forecast, by Category 2019 & 2032
- Table 133: Global Maple Market Revenue Million Forecast, by Type 2019 & 2032
- Table 134: Global Maple Market Volume Liters Forecast, by Type 2019 & 2032
- Table 135: Global Maple Market Revenue Million Forecast, by Distribution Channel 2019 & 2032
- Table 136: Global Maple Market Volume Liters Forecast, by Distribution Channel 2019 & 2032
- Table 137: Global Maple Market Revenue Million Forecast, by Country 2019 & 2032
- Table 138: Global Maple Market Volume Liters Forecast, by Country 2019 & 2032
- Table 139: United Arab Emirates Maple Market Revenue (Million) Forecast, by Application 2019 & 2032
- Table 140: United Arab Emirates Maple Market Volume (Liters) Forecast, by Application 2019 & 2032
- Table 141: South Africa Maple Market Revenue (Million) Forecast, by Application 2019 & 2032
- Table 142: South Africa Maple Market Volume (Liters) Forecast, by Application 2019 & 2032
- Table 143: Rest of Middle East and Africa Maple Market Revenue (Million) Forecast, by Application 2019 & 2032
- Table 144: Rest of Middle East and Africa Maple Market Volume (Liters) Forecast, by Application 2019 & 2032
Frequently Asked Questions
1. What is the projected Compound Annual Growth Rate (CAGR) of the Maple Market?
The projected CAGR is approximately 7.17%.
2. Which companies are prominent players in the Maple Market?
Key companies in the market include Bascom Maple Farms Inc*List Not Exhaustive, B&G Foods, J M Smucker, LB Maple Treat, Les Industries Bernard et Fils Ltee, Federation of Quebec Maple Syrup Producers, Vermont Maple sugar maker Association, Thompsons maple product, Bascom family farms, HJ Heinz Company.
3. What are the main segments of the Maple Market?
The market segments include Category, Type, Distribution Channel.
4. Can you provide details about the market size?
The market size is estimated to be USD 1.16 Million as of 2022.
5. What are some drivers contributing to market growth?
Prevalence of Lactose Intolerance Driving the Market; Growing Influence of Healthy Lifestyle Trends and Rising Non-Traditional Users.
6. What are the notable trends driving market growth?
Utilization of Maple Syrup as a Flavoring Agent.
7. Are there any restraints impacting market growth?
Wide Availability of Alternative Protein Sources.
8. Can you provide examples of recent developments in the market?
March 2022: PepsiCo Inc. introduced a limited-edition maple syrup version of its namesake cola brand in collaboration with the United States pancake restaurant chain IHOP.
9. What pricing options are available for accessing the report?
Pricing options include single-user, multi-user, and enterprise licenses priced at USD 4750, USD 5250, and USD 8750 respectively.
10. Is the market size provided in terms of value or volume?
The market size is provided in terms of value, measured in Million and volume, measured in Liters.
11. Are there any specific market keywords associated with the report?
Yes, the market keyword associated with the report is "Maple Market," which aids in identifying and referencing the specific market segment covered.
12. How do I determine which pricing option suits my needs best?
The pricing options vary based on user requirements and access needs. Individual users may opt for single-user licenses, while businesses requiring broader access may choose multi-user or enterprise licenses for cost-effective access to the report.
13. Are there any additional resources or data provided in the Maple Market report?
While the report offers comprehensive insights, it's advisable to review the specific contents or supplementary materials provided to ascertain if additional resources or data are available.
14. How can I stay updated on further developments or reports in the Maple Market?
To stay informed about further developments, trends, and reports in the Maple Market, consider subscribing to industry newsletters, following relevant companies and organizations, or regularly checking reputable industry news sources and publications.
Methodology
Step 1 - Identification of Relevant Samples Size from Population Database


Step 2 - Approaches for Defining Global Market Size (Value, Volume* & Price*)

Note*: In applicable scenarios
Step 3 - Data Sources
Primary Research
- Web Analytics
- Survey Reports
- Research Institute
- Latest Research Reports
- Opinion Leaders
Secondary Research
- Annual Reports
- White Paper
- Latest Press Release
- Industry Association
- Paid Database
- Investor Presentations

Step 4 - Data Triangulation
Involves using different sources of information in order to increase the validity of a study
These sources are likely to be stakeholders in a program - participants, other researchers, program staff, other community members, and so on.
Then we put all data in single framework & apply various statistical tools to find out the dynamic on the market.
During the analysis stage, feedback from the stakeholder groups would be compared to determine areas of agreement as well as areas of divergence


