
Key Insights
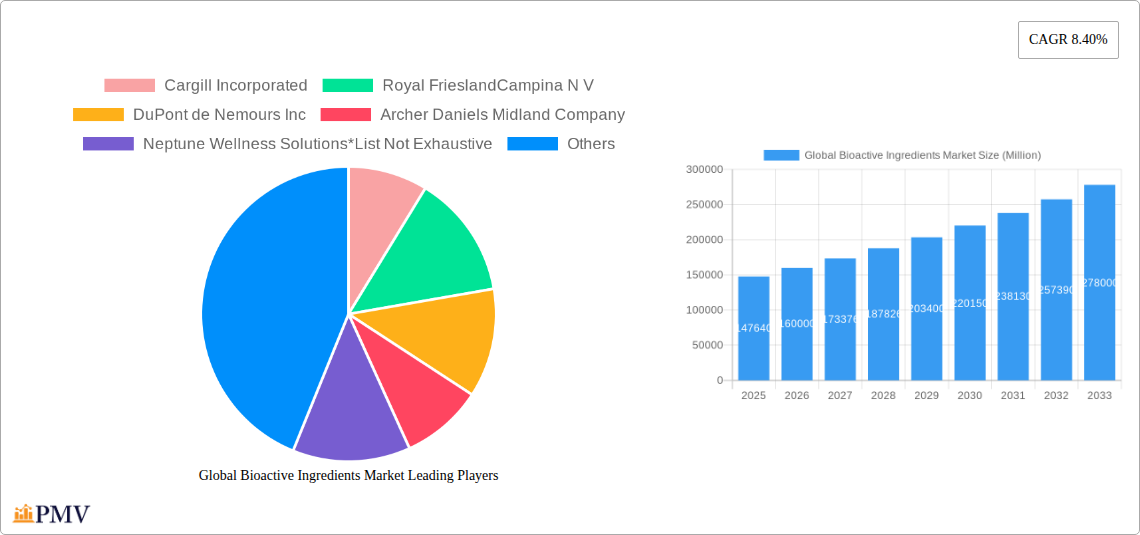
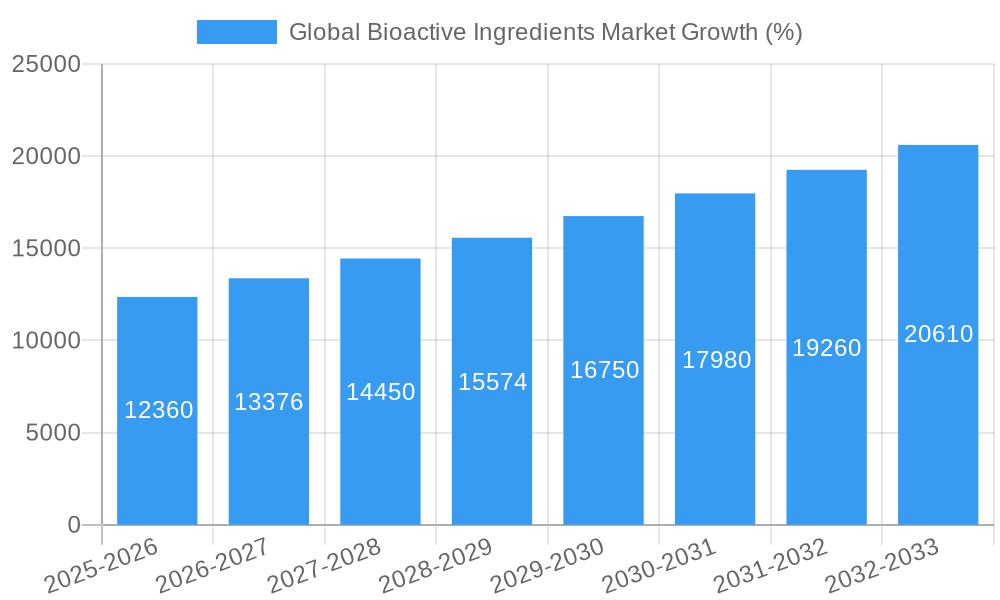
The global bioactive ingredients market, valued at $147.64 billion in 2025, is projected to experience robust growth, driven by increasing consumer demand for functional foods and dietary supplements promoting health and wellness. This growth is fueled by several key factors. The rising prevalence of chronic diseases like cardiovascular issues and diabetes is prompting consumers to proactively manage their health through dietary interventions, significantly boosting demand for bioactive ingredients rich in probiotics, prebiotics, omega-3 fatty acids, and vitamins. Furthermore, the burgeoning health and wellness industry, coupled with increasing disposable incomes in developing economies, fuels market expansion. The food and beverage sector is a major application area, with manufacturers incorporating bioactive ingredients to enhance product value and appeal to health-conscious consumers. Dietary supplements also represent a significant market segment, benefiting from the rising popularity of personalized nutrition approaches. While the market faces some challenges, such as stringent regulatory requirements and potential supply chain disruptions, the overall growth trajectory remains positive. The competitive landscape is characterized by both large multinational corporations and smaller specialized companies, leading to ongoing innovation and product diversification within the market.
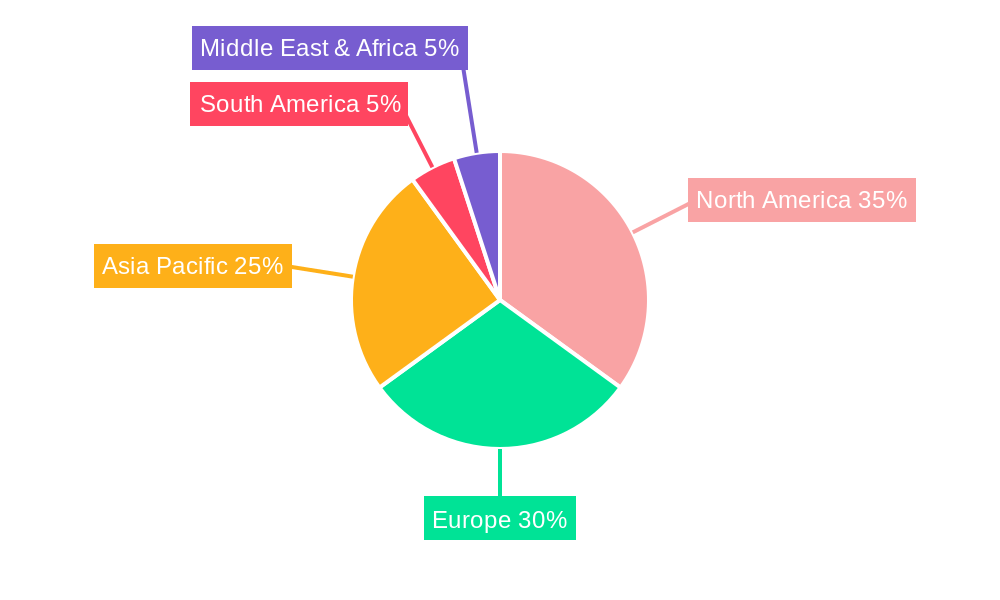
The market segmentation reveals significant opportunities within specific categories. Probiotics and prebiotics, owing to their established gut health benefits, are expected to maintain strong growth. Similarly, omega-3 fatty acids, linked to cardiovascular health, and vitamins, crucial for overall well-being, continue to drive market expansion. The diverse application across food and beverages, dietary supplements, animal nutrition, personal care, and pharmaceuticals ensures broad market penetration. Regional growth is anticipated to vary, with North America and Europe maintaining substantial market shares, while Asia-Pacific is expected to witness accelerated growth driven by rising health awareness and increased consumption of functional foods. The forecast period (2025-2033) anticipates a sustained CAGR of 8.40%, reflecting the long-term positive outlook for the global bioactive ingredients market.
Global Bioactive Ingredients Market Report: 2019-2033
This comprehensive report provides an in-depth analysis of the global bioactive ingredients market, offering invaluable insights for businesses and investors seeking to navigate this dynamic sector. The report covers the period from 2019 to 2033, with a focus on the forecast period of 2025-2033 and a base year of 2025. Market size is presented in Millions throughout.
Global Bioactive Ingredients Market Market Structure & Competitive Dynamics
The global bioactive ingredients market exhibits a moderately consolidated structure, with several multinational corporations holding significant market share. Key players leverage extensive research and development capabilities, strategic partnerships, and acquisitions to maintain their competitive edge. The market is characterized by a complex innovation ecosystem involving ingredient suppliers, technology providers, and end-product manufacturers. Stringent regulatory frameworks, particularly regarding food safety and labeling, significantly impact market dynamics. The presence of several product substitutes, such as synthetic vitamins, creates competitive pressure. End-user preferences, driven by growing health consciousness and demand for natural and sustainable products, are reshaping market demand. Mergers and acquisitions (M&A) activity plays a pivotal role in shaping market consolidation and expansion. For instance, M&A deal values have totalled xx Million in the past five years, with an average deal size of xx Million. Several key players, such as Cargill, DSM, and ADM, have a significant market share; however the exact values are proprietary.
Global Bioactive Ingredients Market Industry Trends & Insights
The global bioactive ingredients market is witnessing robust growth, fueled by several key factors. The increasing prevalence of chronic diseases is driving demand for functional foods and dietary supplements enriched with bioactive ingredients. Technological advancements in extraction, processing, and delivery systems are enhancing the efficacy and bioavailability of these ingredients. Consumer preferences are shifting towards natural, sustainable, and ethically sourced products, prompting companies to innovate accordingly. The rising adoption of bioactive ingredients across diverse applications, including food and beverages, dietary supplements, animal nutrition, personal care, and pharmaceuticals, is another significant driver. The market is expected to exhibit a CAGR of xx% during the forecast period, reaching a market value of xx Million by 2033. This growth is significantly influenced by increasing market penetration in developing economies. Competitive dynamics remain intense, with companies investing heavily in R&D and strategic collaborations to gain a competitive edge. A growing focus on personalized nutrition and targeted health solutions is further shaping the market landscape.
Dominant Markets & Segments in Global Bioactive Ingredients Market
The global bioactive ingredients market is geographically diverse, with significant regional variations in growth and consumption patterns. North America currently holds the largest market share, driven by high consumer awareness and spending on health and wellness products. However, Asia-Pacific is projected to witness the fastest growth during the forecast period, fueled by a rapidly expanding middle class and increasing disposable incomes.
Leading Regions/Countries: North America, followed by Asia-Pacific (China and India showing significant growth).
Dominant Ingredient Types:
- Probiotics and Prebiotics: Demand is driven by their proven health benefits in gut health, immunity, and digestive function.
- Omega-3 Fatty Acids: The growing awareness of the importance of heart health and brain function fuels demand for Omega-3s.
- Vitamins: Vitamins are essential micronutrients and a continuously large segment of the market.
- Others (Carotenoids, Plant Extracts, Minerals, Amino Acids, Proteins, and Peptides): This segment is characterized by diversified applications and high growth potential due to evolving consumer trends.
Dominant Applications:
- Food and Beverages: This segment is the largest, owing to the increasing incorporation of bioactive ingredients in functional foods and beverages.
- Dietary Supplements: This segment is growing rapidly due to the rise in health-conscious consumers seeking supplementary nutrition.
- Animal Nutrition: This sector is driven by the need to improve animal health, productivity, and feed efficiency.
- Personal and Beauty Care: Bioactive ingredients find application in cosmetics, skincare, and hair care products.
- Pharmaceutical: Bioactive ingredients are being increasingly used as therapeutic agents and in drug delivery systems.
Key drivers for dominance vary by segment: Strong economic policies and robust healthcare infrastructure contribute to market growth in North America, while rapid economic development and increasing urbanization propel growth in Asia-Pacific.
Global Bioactive Ingredients Market Product Innovations
Recent years have witnessed significant innovations in bioactive ingredients, focusing on enhanced efficacy, bioavailability, and sustainability. Technological advancements like precision fermentation, advanced extraction techniques, and encapsulation technologies are improving the quality and stability of these ingredients. There's a growing trend towards plant-based and algae-derived bioactive ingredients, aligning with consumer demand for natural and sustainable products. Companies are also developing customized bioactive ingredient solutions tailored to specific health needs and consumer preferences.
Report Segmentation & Scope
The report segments the global bioactive ingredients market based on ingredient type (Probiotics and Prebiotics, Omega-3 Fatty Acids, Vitamins, Others: Carotenoids, Plant Extracts, Minerals, Amino Acids, Proteins, and Peptides) and application (Food and Beverages, Dietary Supplements, Animal Nutrition, Personal and Beauty Care, Pharmaceutical). Each segment is analyzed based on market size, growth projections, competitive dynamics, and key trends. For example, the probiotics and prebiotics segment is projected to grow at a CAGR of xx% driven by rising consumer awareness and increased demand for gut health solutions. The food and beverage application segment is expected to remain the largest, with consistent growth driven by the rising integration of bioactive components in various products. The competitive landscape varies within each segment, with some exhibiting intense competition among major players and others experiencing growth from several smaller firms.
Key Drivers of Global Bioactive Ingredients Market Growth
Several factors fuel the market's growth, including the rising global awareness of health and wellness, driving the demand for functional foods and dietary supplements. Technological advancements in extraction methods and formulation technologies are increasing the efficiency and effectiveness of bioactive ingredients. Stringent regulations are pushing for transparency and quality standards, contributing to market growth. Government initiatives promoting sustainable and ethical sourcing practices further stimulate market expansion. The growing prevalence of chronic diseases further emphasizes the need for preventative health measures, increasing demand for bioactive ingredients.
Challenges in the Global Bioactive Ingredients Market Sector
The bioactive ingredients market faces several challenges. Strict regulatory hurdles and varying regulations across different regions present significant barriers to entry and expansion. Supply chain disruptions and volatility in raw material prices impact cost and availability. Intense competition among established players and new entrants increases pressure on pricing and profitability. The fluctuating consumer demand based on trending health claims presents an additional hurdle for market stability and forecasting. These challenges collectively impact the overall market growth and stability.
Leading Players in the Global Bioactive Ingredients Market Market
- Cargill Incorporated
- Royal FrieslandCampina N V
- DuPont de Nemours Inc
- Archer Daniels Midland Company
- Neptune Wellness Solutions
- Chr Hansen Holding A/S
- BASF SE
- Kerry Group
- Advanced Enzyme Technologies
- Koninklijke DSM NV
- Ingredion Incorporated
Key Developments in Global Bioactive Ingredients Market Sector
- April 2022: Royal DSM launched a sustainably focused campaign promoting algae-derived omega-3 ingredients, diversifying their product portfolio and appealing to environmentally conscious consumers.
- August 2022: Archer Daniels Midland (ADM) partnered with Benson Hill to scale innovative soy ingredients, addressing the growing demand for plant-based proteins and strengthening ADM’s position in the alternative protein market.
- January 2023: FrieslandCampina's partnership with Triplebar Bio Inc. to scale up cell-based protein production using precision fermentation highlights the industry's shift towards innovative and sustainable protein sources.
Strategic Global Bioactive Ingredients Market Market Outlook
The future of the global bioactive ingredients market is promising, with substantial growth potential driven by increasing health consciousness and technological innovation. Strategic partnerships, acquisitions, and investments in R&D will play a crucial role in shaping the market landscape. Companies focusing on sustainable and ethically sourced ingredients are likely to gain a competitive advantage. The market’s future growth will depend on adapting to evolving consumer preferences and addressing ongoing challenges related to regulation and supply chain stability. The continued development and commercialization of novel bioactive ingredients with targeted health benefits will further drive market expansion.
Global Bioactive Ingredients Market Segmentation
-
1. Ingredient Type
- 1.1. Probiotics and Prebiotics
- 1.2. Omega-3 Fatty Acids
-
1.3. Vitamins
- 1.3.1. Vitamin A
- 1.3.2. Vitamin B
- 1.3.3. Vitamin C
- 1.3.4. Others
- 1.4. Carotenoids
- 1.5. Plant Extracts
- 1.6. Minerals
- 1.7. Amino Acids, Proteins, and Peptides
-
2. Application
- 2.1. Food and Beverages
- 2.2. Dietary Supplements
- 2.3. Animal Nutrition
- 2.4. Personal and Beauty Care
- 2.5. Pharmaceutical
Global Bioactive Ingredients Market Segmentation By Geography
-
1. North America
- 1.1. United States
- 1.2. Canada
- 1.3. Mexico
- 1.4. Rest of North America
-
2. Europe
- 2.1. Spain
- 2.2. United Kingdom
- 2.3. Germany
- 2.4. France
- 2.5. Italy
- 2.6. Rest of Europe
-
3. Asia Pacific
- 3.1. China
- 3.2. Japan
- 3.3. India
- 3.4. Australia
- 3.5. Rest of Asia Pacific
-
4. South America
- 4.1. Brazil
- 4.2. Argentina
- 4.3. Rest of South America
- 5. Middle East
-
6. South Africa
- 6.1. Saudi Arabia
- 6.2. Rest of Middle East
Global Bioactive Ingredients Market REPORT HIGHLIGHTS
| Aspects | Details |
|---|---|
| Study Period | 2019-2033 |
| Base Year | 2024 |
| Estimated Year | 2025 |
| Forecast Period | 2025-2033 |
| Historical Period | 2019-2024 |
| Growth Rate | CAGR of 8.40% from 2019-2033 |
| Segmentation |
|
Table of Contents
- 1. Introduction
- 1.1. Research Scope
- 1.2. Market Segmentation
- 1.3. Research Methodology
- 1.4. Definitions and Assumptions
- 2. Executive Summary
- 2.1. Introduction
- 3. Market Dynamics
- 3.1. Introduction
- 3.2. Market Drivers
- 3.2.1. Increasing Demand For Convenience & Processed Food
- 3.3. Market Restrains
- 3.3.1. Increased Consumer Awareness On Side-Effects Of Chemical Additives
- 3.4. Market Trends
- 3.4.1. Rising Healthcare Expenditure
- 4. Market Factor Analysis
- 4.1. Porters Five Forces
- 4.2. Supply/Value Chain
- 4.3. PESTEL analysis
- 4.4. Market Entropy
- 4.5. Patent/Trademark Analysis
- 5. Global Bioactive Ingredients Market Analysis, Insights and Forecast, 2019-2031
- 5.1. Market Analysis, Insights and Forecast - by Ingredient Type
- 5.1.1. Probiotics and Prebiotics
- 5.1.2. Omega-3 Fatty Acids
- 5.1.3. Vitamins
- 5.1.3.1. Vitamin A
- 5.1.3.2. Vitamin B
- 5.1.3.3. Vitamin C
- 5.1.3.4. Others
- 5.1.4. Carotenoids
- 5.1.5. Plant Extracts
- 5.1.6. Minerals
- 5.1.7. Amino Acids, Proteins, and Peptides
- 5.2. Market Analysis, Insights and Forecast - by Application
- 5.2.1. Food and Beverages
- 5.2.2. Dietary Supplements
- 5.2.3. Animal Nutrition
- 5.2.4. Personal and Beauty Care
- 5.2.5. Pharmaceutical
- 5.3. Market Analysis, Insights and Forecast - by Region
- 5.3.1. North America
- 5.3.2. Europe
- 5.3.3. Asia Pacific
- 5.3.4. South America
- 5.3.5. Middle East
- 5.3.6. South Africa
- 5.1. Market Analysis, Insights and Forecast - by Ingredient Type
- 6. North America Global Bioactive Ingredients Market Analysis, Insights and Forecast, 2019-2031
- 6.1. Market Analysis, Insights and Forecast - by Ingredient Type
- 6.1.1. Probiotics and Prebiotics
- 6.1.2. Omega-3 Fatty Acids
- 6.1.3. Vitamins
- 6.1.3.1. Vitamin A
- 6.1.3.2. Vitamin B
- 6.1.3.3. Vitamin C
- 6.1.3.4. Others
- 6.1.4. Carotenoids
- 6.1.5. Plant Extracts
- 6.1.6. Minerals
- 6.1.7. Amino Acids, Proteins, and Peptides
- 6.2. Market Analysis, Insights and Forecast - by Application
- 6.2.1. Food and Beverages
- 6.2.2. Dietary Supplements
- 6.2.3. Animal Nutrition
- 6.2.4. Personal and Beauty Care
- 6.2.5. Pharmaceutical
- 6.1. Market Analysis, Insights and Forecast - by Ingredient Type
- 7. Europe Global Bioactive Ingredients Market Analysis, Insights and Forecast, 2019-2031
- 7.1. Market Analysis, Insights and Forecast - by Ingredient Type
- 7.1.1. Probiotics and Prebiotics
- 7.1.2. Omega-3 Fatty Acids
- 7.1.3. Vitamins
- 7.1.3.1. Vitamin A
- 7.1.3.2. Vitamin B
- 7.1.3.3. Vitamin C
- 7.1.3.4. Others
- 7.1.4. Carotenoids
- 7.1.5. Plant Extracts
- 7.1.6. Minerals
- 7.1.7. Amino Acids, Proteins, and Peptides
- 7.2. Market Analysis, Insights and Forecast - by Application
- 7.2.1. Food and Beverages
- 7.2.2. Dietary Supplements
- 7.2.3. Animal Nutrition
- 7.2.4. Personal and Beauty Care
- 7.2.5. Pharmaceutical
- 7.1. Market Analysis, Insights and Forecast - by Ingredient Type
- 8. Asia Pacific Global Bioactive Ingredients Market Analysis, Insights and Forecast, 2019-2031
- 8.1. Market Analysis, Insights and Forecast - by Ingredient Type
- 8.1.1. Probiotics and Prebiotics
- 8.1.2. Omega-3 Fatty Acids
- 8.1.3. Vitamins
- 8.1.3.1. Vitamin A
- 8.1.3.2. Vitamin B
- 8.1.3.3. Vitamin C
- 8.1.3.4. Others
- 8.1.4. Carotenoids
- 8.1.5. Plant Extracts
- 8.1.6. Minerals
- 8.1.7. Amino Acids, Proteins, and Peptides
- 8.2. Market Analysis, Insights and Forecast - by Application
- 8.2.1. Food and Beverages
- 8.2.2. Dietary Supplements
- 8.2.3. Animal Nutrition
- 8.2.4. Personal and Beauty Care
- 8.2.5. Pharmaceutical
- 8.1. Market Analysis, Insights and Forecast - by Ingredient Type
- 9. South America Global Bioactive Ingredients Market Analysis, Insights and Forecast, 2019-2031
- 9.1. Market Analysis, Insights and Forecast - by Ingredient Type
- 9.1.1. Probiotics and Prebiotics
- 9.1.2. Omega-3 Fatty Acids
- 9.1.3. Vitamins
- 9.1.3.1. Vitamin A
- 9.1.3.2. Vitamin B
- 9.1.3.3. Vitamin C
- 9.1.3.4. Others
- 9.1.4. Carotenoids
- 9.1.5. Plant Extracts
- 9.1.6. Minerals
- 9.1.7. Amino Acids, Proteins, and Peptides
- 9.2. Market Analysis, Insights and Forecast - by Application
- 9.2.1. Food and Beverages
- 9.2.2. Dietary Supplements
- 9.2.3. Animal Nutrition
- 9.2.4. Personal and Beauty Care
- 9.2.5. Pharmaceutical
- 9.1. Market Analysis, Insights and Forecast - by Ingredient Type
- 10. Middle East Global Bioactive Ingredients Market Analysis, Insights and Forecast, 2019-2031
- 10.1. Market Analysis, Insights and Forecast - by Ingredient Type
- 10.1.1. Probiotics and Prebiotics
- 10.1.2. Omega-3 Fatty Acids
- 10.1.3. Vitamins
- 10.1.3.1. Vitamin A
- 10.1.3.2. Vitamin B
- 10.1.3.3. Vitamin C
- 10.1.3.4. Others
- 10.1.4. Carotenoids
- 10.1.5. Plant Extracts
- 10.1.6. Minerals
- 10.1.7. Amino Acids, Proteins, and Peptides
- 10.2. Market Analysis, Insights and Forecast - by Application
- 10.2.1. Food and Beverages
- 10.2.2. Dietary Supplements
- 10.2.3. Animal Nutrition
- 10.2.4. Personal and Beauty Care
- 10.2.5. Pharmaceutical
- 10.1. Market Analysis, Insights and Forecast - by Ingredient Type
- 11. South Africa Global Bioactive Ingredients Market Analysis, Insights and Forecast, 2019-2031
- 11.1. Market Analysis, Insights and Forecast - by Ingredient Type
- 11.1.1. Probiotics and Prebiotics
- 11.1.2. Omega-3 Fatty Acids
- 11.1.3. Vitamins
- 11.1.3.1. Vitamin A
- 11.1.3.2. Vitamin B
- 11.1.3.3. Vitamin C
- 11.1.3.4. Others
- 11.1.4. Carotenoids
- 11.1.5. Plant Extracts
- 11.1.6. Minerals
- 11.1.7. Amino Acids, Proteins, and Peptides
- 11.2. Market Analysis, Insights and Forecast - by Application
- 11.2.1. Food and Beverages
- 11.2.2. Dietary Supplements
- 11.2.3. Animal Nutrition
- 11.2.4. Personal and Beauty Care
- 11.2.5. Pharmaceutical
- 11.1. Market Analysis, Insights and Forecast - by Ingredient Type
- 12. North America Global Bioactive Ingredients Market Analysis, Insights and Forecast, 2019-2031
- 12.1. Market Analysis, Insights and Forecast - By Country/Sub-region
- 12.1.1 United States
- 12.1.2 Canada
- 12.1.3 Mexico
- 12.1.4 Rest of North America
- 13. Europe Global Bioactive Ingredients Market Analysis, Insights and Forecast, 2019-2031
- 13.1. Market Analysis, Insights and Forecast - By Country/Sub-region
- 13.1.1 Spain
- 13.1.2 United Kingdom
- 13.1.3 Germany
- 13.1.4 France
- 13.1.5 Italy
- 13.1.6 Rest of Europe
- 14. Asia Pacific Global Bioactive Ingredients Market Analysis, Insights and Forecast, 2019-2031
- 14.1. Market Analysis, Insights and Forecast - By Country/Sub-region
- 14.1.1 China
- 14.1.2 Japan
- 14.1.3 India
- 14.1.4 Australia
- 14.1.5 Rest of Asia Pacific
- 15. South America Global Bioactive Ingredients Market Analysis, Insights and Forecast, 2019-2031
- 15.1. Market Analysis, Insights and Forecast - By Country/Sub-region
- 15.1.1 Brazil
- 15.1.2 Argentina
- 15.1.3 Rest of South America
- 16. Middle East Global Bioactive Ingredients Market Analysis, Insights and Forecast, 2019-2031
- 16.1. Market Analysis, Insights and Forecast - By Country/Sub-region
- 16.1.1 Middle East
- 16.1.2 Africa
- 17. South Africa Global Bioactive Ingredients Market Analysis, Insights and Forecast, 2019-2031
- 17.1. Market Analysis, Insights and Forecast - By Country/Sub-region
- 17.1.1 Saudi Arabia
- 17.1.2 Rest of Middle East
- 18. Competitive Analysis
- 18.1. Market Share Analysis 2024
- 18.2. Company Profiles
- 18.2.1 Cargill Incorporated
- 18.2.1.1. Overview
- 18.2.1.2. Products
- 18.2.1.3. SWOT Analysis
- 18.2.1.4. Recent Developments
- 18.2.1.5. Financials (Based on Availability)
- 18.2.2 Royal FrieslandCampina N V
- 18.2.2.1. Overview
- 18.2.2.2. Products
- 18.2.2.3. SWOT Analysis
- 18.2.2.4. Recent Developments
- 18.2.2.5. Financials (Based on Availability)
- 18.2.3 DuPont de Nemours Inc
- 18.2.3.1. Overview
- 18.2.3.2. Products
- 18.2.3.3. SWOT Analysis
- 18.2.3.4. Recent Developments
- 18.2.3.5. Financials (Based on Availability)
- 18.2.4 Archer Daniels Midland Company
- 18.2.4.1. Overview
- 18.2.4.2. Products
- 18.2.4.3. SWOT Analysis
- 18.2.4.4. Recent Developments
- 18.2.4.5. Financials (Based on Availability)
- 18.2.5 Neptune Wellness Solutions*List Not Exhaustive
- 18.2.5.1. Overview
- 18.2.5.2. Products
- 18.2.5.3. SWOT Analysis
- 18.2.5.4. Recent Developments
- 18.2.5.5. Financials (Based on Availability)
- 18.2.6 Chr Hansen Holding A/S
- 18.2.6.1. Overview
- 18.2.6.2. Products
- 18.2.6.3. SWOT Analysis
- 18.2.6.4. Recent Developments
- 18.2.6.5. Financials (Based on Availability)
- 18.2.7 BASF SE
- 18.2.7.1. Overview
- 18.2.7.2. Products
- 18.2.7.3. SWOT Analysis
- 18.2.7.4. Recent Developments
- 18.2.7.5. Financials (Based on Availability)
- 18.2.8 Kerry Group
- 18.2.8.1. Overview
- 18.2.8.2. Products
- 18.2.8.3. SWOT Analysis
- 18.2.8.4. Recent Developments
- 18.2.8.5. Financials (Based on Availability)
- 18.2.9 Advanced Enzyme Technologies
- 18.2.9.1. Overview
- 18.2.9.2. Products
- 18.2.9.3. SWOT Analysis
- 18.2.9.4. Recent Developments
- 18.2.9.5. Financials (Based on Availability)
- 18.2.10 Koninklijke DSM NV
- 18.2.10.1. Overview
- 18.2.10.2. Products
- 18.2.10.3. SWOT Analysis
- 18.2.10.4. Recent Developments
- 18.2.10.5. Financials (Based on Availability)
- 18.2.11 Ingredion Incorporated
- 18.2.11.1. Overview
- 18.2.11.2. Products
- 18.2.11.3. SWOT Analysis
- 18.2.11.4. Recent Developments
- 18.2.11.5. Financials (Based on Availability)
- 18.2.1 Cargill Incorporated
List of Figures
- Figure 1: Global Global Bioactive Ingredients Market Revenue Breakdown (Million, %) by Region 2024 & 2032
- Figure 2: Global Global Bioactive Ingredients Market Volume Breakdown (K Tons, %) by Region 2024 & 2032
- Figure 3: North America Global Bioactive Ingredients Market Revenue (Million), by Country 2024 & 2032
- Figure 4: North America Global Bioactive Ingredients Market Volume (K Tons), by Country 2024 & 2032
- Figure 5: North America Global Bioactive Ingredients Market Revenue Share (%), by Country 2024 & 2032
- Figure 6: North America Global Bioactive Ingredients Market Volume Share (%), by Country 2024 & 2032
- Figure 7: Europe Global Bioactive Ingredients Market Revenue (Million), by Country 2024 & 2032
- Figure 8: Europe Global Bioactive Ingredients Market Volume (K Tons), by Country 2024 & 2032
- Figure 9: Europe Global Bioactive Ingredients Market Revenue Share (%), by Country 2024 & 2032
- Figure 10: Europe Global Bioactive Ingredients Market Volume Share (%), by Country 2024 & 2032
- Figure 11: Asia Pacific Global Bioactive Ingredients Market Revenue (Million), by Country 2024 & 2032
- Figure 12: Asia Pacific Global Bioactive Ingredients Market Volume (K Tons), by Country 2024 & 2032
- Figure 13: Asia Pacific Global Bioactive Ingredients Market Revenue Share (%), by Country 2024 & 2032
- Figure 14: Asia Pacific Global Bioactive Ingredients Market Volume Share (%), by Country 2024 & 2032
- Figure 15: South America Global Bioactive Ingredients Market Revenue (Million), by Country 2024 & 2032
- Figure 16: South America Global Bioactive Ingredients Market Volume (K Tons), by Country 2024 & 2032
- Figure 17: South America Global Bioactive Ingredients Market Revenue Share (%), by Country 2024 & 2032
- Figure 18: South America Global Bioactive Ingredients Market Volume Share (%), by Country 2024 & 2032
- Figure 19: Middle East Global Bioactive Ingredients Market Revenue (Million), by Country 2024 & 2032
- Figure 20: Middle East Global Bioactive Ingredients Market Volume (K Tons), by Country 2024 & 2032
- Figure 21: Middle East Global Bioactive Ingredients Market Revenue Share (%), by Country 2024 & 2032
- Figure 22: Middle East Global Bioactive Ingredients Market Volume Share (%), by Country 2024 & 2032
- Figure 23: South Africa Global Bioactive Ingredients Market Revenue (Million), by Country 2024 & 2032
- Figure 24: South Africa Global Bioactive Ingredients Market Volume (K Tons), by Country 2024 & 2032
- Figure 25: South Africa Global Bioactive Ingredients Market Revenue Share (%), by Country 2024 & 2032
- Figure 26: South Africa Global Bioactive Ingredients Market Volume Share (%), by Country 2024 & 2032
- Figure 27: North America Global Bioactive Ingredients Market Revenue (Million), by Ingredient Type 2024 & 2032
- Figure 28: North America Global Bioactive Ingredients Market Volume (K Tons), by Ingredient Type 2024 & 2032
- Figure 29: North America Global Bioactive Ingredients Market Revenue Share (%), by Ingredient Type 2024 & 2032
- Figure 30: North America Global Bioactive Ingredients Market Volume Share (%), by Ingredient Type 2024 & 2032
- Figure 31: North America Global Bioactive Ingredients Market Revenue (Million), by Application 2024 & 2032
- Figure 32: North America Global Bioactive Ingredients Market Volume (K Tons), by Application 2024 & 2032
- Figure 33: North America Global Bioactive Ingredients Market Revenue Share (%), by Application 2024 & 2032
- Figure 34: North America Global Bioactive Ingredients Market Volume Share (%), by Application 2024 & 2032
- Figure 35: North America Global Bioactive Ingredients Market Revenue (Million), by Country 2024 & 2032
- Figure 36: North America Global Bioactive Ingredients Market Volume (K Tons), by Country 2024 & 2032
- Figure 37: North America Global Bioactive Ingredients Market Revenue Share (%), by Country 2024 & 2032
- Figure 38: North America Global Bioactive Ingredients Market Volume Share (%), by Country 2024 & 2032
- Figure 39: Europe Global Bioactive Ingredients Market Revenue (Million), by Ingredient Type 2024 & 2032
- Figure 40: Europe Global Bioactive Ingredients Market Volume (K Tons), by Ingredient Type 2024 & 2032
- Figure 41: Europe Global Bioactive Ingredients Market Revenue Share (%), by Ingredient Type 2024 & 2032
- Figure 42: Europe Global Bioactive Ingredients Market Volume Share (%), by Ingredient Type 2024 & 2032
- Figure 43: Europe Global Bioactive Ingredients Market Revenue (Million), by Application 2024 & 2032
- Figure 44: Europe Global Bioactive Ingredients Market Volume (K Tons), by Application 2024 & 2032
- Figure 45: Europe Global Bioactive Ingredients Market Revenue Share (%), by Application 2024 & 2032
- Figure 46: Europe Global Bioactive Ingredients Market Volume Share (%), by Application 2024 & 2032
- Figure 47: Europe Global Bioactive Ingredients Market Revenue (Million), by Country 2024 & 2032
- Figure 48: Europe Global Bioactive Ingredients Market Volume (K Tons), by Country 2024 & 2032
- Figure 49: Europe Global Bioactive Ingredients Market Revenue Share (%), by Country 2024 & 2032
- Figure 50: Europe Global Bioactive Ingredients Market Volume Share (%), by Country 2024 & 2032
- Figure 51: Asia Pacific Global Bioactive Ingredients Market Revenue (Million), by Ingredient Type 2024 & 2032
- Figure 52: Asia Pacific Global Bioactive Ingredients Market Volume (K Tons), by Ingredient Type 2024 & 2032
- Figure 53: Asia Pacific Global Bioactive Ingredients Market Revenue Share (%), by Ingredient Type 2024 & 2032
- Figure 54: Asia Pacific Global Bioactive Ingredients Market Volume Share (%), by Ingredient Type 2024 & 2032
- Figure 55: Asia Pacific Global Bioactive Ingredients Market Revenue (Million), by Application 2024 & 2032
- Figure 56: Asia Pacific Global Bioactive Ingredients Market Volume (K Tons), by Application 2024 & 2032
- Figure 57: Asia Pacific Global Bioactive Ingredients Market Revenue Share (%), by Application 2024 & 2032
- Figure 58: Asia Pacific Global Bioactive Ingredients Market Volume Share (%), by Application 2024 & 2032
- Figure 59: Asia Pacific Global Bioactive Ingredients Market Revenue (Million), by Country 2024 & 2032
- Figure 60: Asia Pacific Global Bioactive Ingredients Market Volume (K Tons), by Country 2024 & 2032
- Figure 61: Asia Pacific Global Bioactive Ingredients Market Revenue Share (%), by Country 2024 & 2032
- Figure 62: Asia Pacific Global Bioactive Ingredients Market Volume Share (%), by Country 2024 & 2032
- Figure 63: South America Global Bioactive Ingredients Market Revenue (Million), by Ingredient Type 2024 & 2032
- Figure 64: South America Global Bioactive Ingredients Market Volume (K Tons), by Ingredient Type 2024 & 2032
- Figure 65: South America Global Bioactive Ingredients Market Revenue Share (%), by Ingredient Type 2024 & 2032
- Figure 66: South America Global Bioactive Ingredients Market Volume Share (%), by Ingredient Type 2024 & 2032
- Figure 67: South America Global Bioactive Ingredients Market Revenue (Million), by Application 2024 & 2032
- Figure 68: South America Global Bioactive Ingredients Market Volume (K Tons), by Application 2024 & 2032
- Figure 69: South America Global Bioactive Ingredients Market Revenue Share (%), by Application 2024 & 2032
- Figure 70: South America Global Bioactive Ingredients Market Volume Share (%), by Application 2024 & 2032
- Figure 71: South America Global Bioactive Ingredients Market Revenue (Million), by Country 2024 & 2032
- Figure 72: South America Global Bioactive Ingredients Market Volume (K Tons), by Country 2024 & 2032
- Figure 73: South America Global Bioactive Ingredients Market Revenue Share (%), by Country 2024 & 2032
- Figure 74: South America Global Bioactive Ingredients Market Volume Share (%), by Country 2024 & 2032
- Figure 75: Middle East Global Bioactive Ingredients Market Revenue (Million), by Ingredient Type 2024 & 2032
- Figure 76: Middle East Global Bioactive Ingredients Market Volume (K Tons), by Ingredient Type 2024 & 2032
- Figure 77: Middle East Global Bioactive Ingredients Market Revenue Share (%), by Ingredient Type 2024 & 2032
- Figure 78: Middle East Global Bioactive Ingredients Market Volume Share (%), by Ingredient Type 2024 & 2032
- Figure 79: Middle East Global Bioactive Ingredients Market Revenue (Million), by Application 2024 & 2032
- Figure 80: Middle East Global Bioactive Ingredients Market Volume (K Tons), by Application 2024 & 2032
- Figure 81: Middle East Global Bioactive Ingredients Market Revenue Share (%), by Application 2024 & 2032
- Figure 82: Middle East Global Bioactive Ingredients Market Volume Share (%), by Application 2024 & 2032
- Figure 83: Middle East Global Bioactive Ingredients Market Revenue (Million), by Country 2024 & 2032
- Figure 84: Middle East Global Bioactive Ingredients Market Volume (K Tons), by Country 2024 & 2032
- Figure 85: Middle East Global Bioactive Ingredients Market Revenue Share (%), by Country 2024 & 2032
- Figure 86: Middle East Global Bioactive Ingredients Market Volume Share (%), by Country 2024 & 2032
- Figure 87: South Africa Global Bioactive Ingredients Market Revenue (Million), by Ingredient Type 2024 & 2032
- Figure 88: South Africa Global Bioactive Ingredients Market Volume (K Tons), by Ingredient Type 2024 & 2032
- Figure 89: South Africa Global Bioactive Ingredients Market Revenue Share (%), by Ingredient Type 2024 & 2032
- Figure 90: South Africa Global Bioactive Ingredients Market Volume Share (%), by Ingredient Type 2024 & 2032
- Figure 91: South Africa Global Bioactive Ingredients Market Revenue (Million), by Application 2024 & 2032
- Figure 92: South Africa Global Bioactive Ingredients Market Volume (K Tons), by Application 2024 & 2032
- Figure 93: South Africa Global Bioactive Ingredients Market Revenue Share (%), by Application 2024 & 2032
- Figure 94: South Africa Global Bioactive Ingredients Market Volume Share (%), by Application 2024 & 2032
- Figure 95: South Africa Global Bioactive Ingredients Market Revenue (Million), by Country 2024 & 2032
- Figure 96: South Africa Global Bioactive Ingredients Market Volume (K Tons), by Country 2024 & 2032
- Figure 97: South Africa Global Bioactive Ingredients Market Revenue Share (%), by Country 2024 & 2032
- Figure 98: South Africa Global Bioactive Ingredients Market Volume Share (%), by Country 2024 & 2032
List of Tables
- Table 1: Global Bioactive Ingredients Market Revenue Million Forecast, by Region 2019 & 2032
- Table 2: Global Bioactive Ingredients Market Volume K Tons Forecast, by Region 2019 & 2032
- Table 3: Global Bioactive Ingredients Market Revenue Million Forecast, by Ingredient Type 2019 & 2032
- Table 4: Global Bioactive Ingredients Market Volume K Tons Forecast, by Ingredient Type 2019 & 2032
- Table 5: Global Bioactive Ingredients Market Revenue Million Forecast, by Application 2019 & 2032
- Table 6: Global Bioactive Ingredients Market Volume K Tons Forecast, by Application 2019 & 2032
- Table 7: Global Bioactive Ingredients Market Revenue Million Forecast, by Region 2019 & 2032
- Table 8: Global Bioactive Ingredients Market Volume K Tons Forecast, by Region 2019 & 2032
- Table 9: Global Bioactive Ingredients Market Revenue Million Forecast, by Country 2019 & 2032
- Table 10: Global Bioactive Ingredients Market Volume K Tons Forecast, by Country 2019 & 2032
- Table 11: United States Global Bioactive Ingredients Market Revenue (Million) Forecast, by Application 2019 & 2032
- Table 12: United States Global Bioactive Ingredients Market Volume (K Tons) Forecast, by Application 2019 & 2032
- Table 13: Canada Global Bioactive Ingredients Market Revenue (Million) Forecast, by Application 2019 & 2032
- Table 14: Canada Global Bioactive Ingredients Market Volume (K Tons) Forecast, by Application 2019 & 2032
- Table 15: Mexico Global Bioactive Ingredients Market Revenue (Million) Forecast, by Application 2019 & 2032
- Table 16: Mexico Global Bioactive Ingredients Market Volume (K Tons) Forecast, by Application 2019 & 2032
- Table 17: Rest of North America Global Bioactive Ingredients Market Revenue (Million) Forecast, by Application 2019 & 2032
- Table 18: Rest of North America Global Bioactive Ingredients Market Volume (K Tons) Forecast, by Application 2019 & 2032
- Table 19: Global Bioactive Ingredients Market Revenue Million Forecast, by Country 2019 & 2032
- Table 20: Global Bioactive Ingredients Market Volume K Tons Forecast, by Country 2019 & 2032
- Table 21: Spain Global Bioactive Ingredients Market Revenue (Million) Forecast, by Application 2019 & 2032
- Table 22: Spain Global Bioactive Ingredients Market Volume (K Tons) Forecast, by Application 2019 & 2032
- Table 23: United Kingdom Global Bioactive Ingredients Market Revenue (Million) Forecast, by Application 2019 & 2032
- Table 24: United Kingdom Global Bioactive Ingredients Market Volume (K Tons) Forecast, by Application 2019 & 2032
- Table 25: Germany Global Bioactive Ingredients Market Revenue (Million) Forecast, by Application 2019 & 2032
- Table 26: Germany Global Bioactive Ingredients Market Volume (K Tons) Forecast, by Application 2019 & 2032
- Table 27: France Global Bioactive Ingredients Market Revenue (Million) Forecast, by Application 2019 & 2032
- Table 28: France Global Bioactive Ingredients Market Volume (K Tons) Forecast, by Application 2019 & 2032
- Table 29: Italy Global Bioactive Ingredients Market Revenue (Million) Forecast, by Application 2019 & 2032
- Table 30: Italy Global Bioactive Ingredients Market Volume (K Tons) Forecast, by Application 2019 & 2032
- Table 31: Rest of Europe Global Bioactive Ingredients Market Revenue (Million) Forecast, by Application 2019 & 2032
- Table 32: Rest of Europe Global Bioactive Ingredients Market Volume (K Tons) Forecast, by Application 2019 & 2032
- Table 33: Global Bioactive Ingredients Market Revenue Million Forecast, by Country 2019 & 2032
- Table 34: Global Bioactive Ingredients Market Volume K Tons Forecast, by Country 2019 & 2032
- Table 35: China Global Bioactive Ingredients Market Revenue (Million) Forecast, by Application 2019 & 2032
- Table 36: China Global Bioactive Ingredients Market Volume (K Tons) Forecast, by Application 2019 & 2032
- Table 37: Japan Global Bioactive Ingredients Market Revenue (Million) Forecast, by Application 2019 & 2032
- Table 38: Japan Global Bioactive Ingredients Market Volume (K Tons) Forecast, by Application 2019 & 2032
- Table 39: India Global Bioactive Ingredients Market Revenue (Million) Forecast, by Application 2019 & 2032
- Table 40: India Global Bioactive Ingredients Market Volume (K Tons) Forecast, by Application 2019 & 2032
- Table 41: Australia Global Bioactive Ingredients Market Revenue (Million) Forecast, by Application 2019 & 2032
- Table 42: Australia Global Bioactive Ingredients Market Volume (K Tons) Forecast, by Application 2019 & 2032
- Table 43: Rest of Asia Pacific Global Bioactive Ingredients Market Revenue (Million) Forecast, by Application 2019 & 2032
- Table 44: Rest of Asia Pacific Global Bioactive Ingredients Market Volume (K Tons) Forecast, by Application 2019 & 2032
- Table 45: Global Bioactive Ingredients Market Revenue Million Forecast, by Country 2019 & 2032
- Table 46: Global Bioactive Ingredients Market Volume K Tons Forecast, by Country 2019 & 2032
- Table 47: Brazil Global Bioactive Ingredients Market Revenue (Million) Forecast, by Application 2019 & 2032
- Table 48: Brazil Global Bioactive Ingredients Market Volume (K Tons) Forecast, by Application 2019 & 2032
- Table 49: Argentina Global Bioactive Ingredients Market Revenue (Million) Forecast, by Application 2019 & 2032
- Table 50: Argentina Global Bioactive Ingredients Market Volume (K Tons) Forecast, by Application 2019 & 2032
- Table 51: Rest of South America Global Bioactive Ingredients Market Revenue (Million) Forecast, by Application 2019 & 2032
- Table 52: Rest of South America Global Bioactive Ingredients Market Volume (K Tons) Forecast, by Application 2019 & 2032
- Table 53: Global Bioactive Ingredients Market Revenue Million Forecast, by Country 2019 & 2032
- Table 54: Global Bioactive Ingredients Market Volume K Tons Forecast, by Country 2019 & 2032
- Table 55: Middle East Global Bioactive Ingredients Market Revenue (Million) Forecast, by Application 2019 & 2032
- Table 56: Middle East Global Bioactive Ingredients Market Volume (K Tons) Forecast, by Application 2019 & 2032
- Table 57: Africa Global Bioactive Ingredients Market Revenue (Million) Forecast, by Application 2019 & 2032
- Table 58: Africa Global Bioactive Ingredients Market Volume (K Tons) Forecast, by Application 2019 & 2032
- Table 59: Global Bioactive Ingredients Market Revenue Million Forecast, by Country 2019 & 2032
- Table 60: Global Bioactive Ingredients Market Volume K Tons Forecast, by Country 2019 & 2032
- Table 61: Saudi Arabia Global Bioactive Ingredients Market Revenue (Million) Forecast, by Application 2019 & 2032
- Table 62: Saudi Arabia Global Bioactive Ingredients Market Volume (K Tons) Forecast, by Application 2019 & 2032
- Table 63: Rest of Middle East Global Bioactive Ingredients Market Revenue (Million) Forecast, by Application 2019 & 2032
- Table 64: Rest of Middle East Global Bioactive Ingredients Market Volume (K Tons) Forecast, by Application 2019 & 2032
- Table 65: Global Bioactive Ingredients Market Revenue Million Forecast, by Ingredient Type 2019 & 2032
- Table 66: Global Bioactive Ingredients Market Volume K Tons Forecast, by Ingredient Type 2019 & 2032
- Table 67: Global Bioactive Ingredients Market Revenue Million Forecast, by Application 2019 & 2032
- Table 68: Global Bioactive Ingredients Market Volume K Tons Forecast, by Application 2019 & 2032
- Table 69: Global Bioactive Ingredients Market Revenue Million Forecast, by Country 2019 & 2032
- Table 70: Global Bioactive Ingredients Market Volume K Tons Forecast, by Country 2019 & 2032
- Table 71: United States Global Bioactive Ingredients Market Revenue (Million) Forecast, by Application 2019 & 2032
- Table 72: United States Global Bioactive Ingredients Market Volume (K Tons) Forecast, by Application 2019 & 2032
- Table 73: Canada Global Bioactive Ingredients Market Revenue (Million) Forecast, by Application 2019 & 2032
- Table 74: Canada Global Bioactive Ingredients Market Volume (K Tons) Forecast, by Application 2019 & 2032
- Table 75: Mexico Global Bioactive Ingredients Market Revenue (Million) Forecast, by Application 2019 & 2032
- Table 76: Mexico Global Bioactive Ingredients Market Volume (K Tons) Forecast, by Application 2019 & 2032
- Table 77: Rest of North America Global Bioactive Ingredients Market Revenue (Million) Forecast, by Application 2019 & 2032
- Table 78: Rest of North America Global Bioactive Ingredients Market Volume (K Tons) Forecast, by Application 2019 & 2032
- Table 79: Global Bioactive Ingredients Market Revenue Million Forecast, by Ingredient Type 2019 & 2032
- Table 80: Global Bioactive Ingredients Market Volume K Tons Forecast, by Ingredient Type 2019 & 2032
- Table 81: Global Bioactive Ingredients Market Revenue Million Forecast, by Application 2019 & 2032
- Table 82: Global Bioactive Ingredients Market Volume K Tons Forecast, by Application 2019 & 2032
- Table 83: Global Bioactive Ingredients Market Revenue Million Forecast, by Country 2019 & 2032
- Table 84: Global Bioactive Ingredients Market Volume K Tons Forecast, by Country 2019 & 2032
- Table 85: Spain Global Bioactive Ingredients Market Revenue (Million) Forecast, by Application 2019 & 2032
- Table 86: Spain Global Bioactive Ingredients Market Volume (K Tons) Forecast, by Application 2019 & 2032
- Table 87: United Kingdom Global Bioactive Ingredients Market Revenue (Million) Forecast, by Application 2019 & 2032
- Table 88: United Kingdom Global Bioactive Ingredients Market Volume (K Tons) Forecast, by Application 2019 & 2032
- Table 89: Germany Global Bioactive Ingredients Market Revenue (Million) Forecast, by Application 2019 & 2032
- Table 90: Germany Global Bioactive Ingredients Market Volume (K Tons) Forecast, by Application 2019 & 2032
- Table 91: France Global Bioactive Ingredients Market Revenue (Million) Forecast, by Application 2019 & 2032
- Table 92: France Global Bioactive Ingredients Market Volume (K Tons) Forecast, by Application 2019 & 2032
- Table 93: Italy Global Bioactive Ingredients Market Revenue (Million) Forecast, by Application 2019 & 2032
- Table 94: Italy Global Bioactive Ingredients Market Volume (K Tons) Forecast, by Application 2019 & 2032
- Table 95: Rest of Europe Global Bioactive Ingredients Market Revenue (Million) Forecast, by Application 2019 & 2032
- Table 96: Rest of Europe Global Bioactive Ingredients Market Volume (K Tons) Forecast, by Application 2019 & 2032
- Table 97: Global Bioactive Ingredients Market Revenue Million Forecast, by Ingredient Type 2019 & 2032
- Table 98: Global Bioactive Ingredients Market Volume K Tons Forecast, by Ingredient Type 2019 & 2032
- Table 99: Global Bioactive Ingredients Market Revenue Million Forecast, by Application 2019 & 2032
- Table 100: Global Bioactive Ingredients Market Volume K Tons Forecast, by Application 2019 & 2032
- Table 101: Global Bioactive Ingredients Market Revenue Million Forecast, by Country 2019 & 2032
- Table 102: Global Bioactive Ingredients Market Volume K Tons Forecast, by Country 2019 & 2032
- Table 103: China Global Bioactive Ingredients Market Revenue (Million) Forecast, by Application 2019 & 2032
- Table 104: China Global Bioactive Ingredients Market Volume (K Tons) Forecast, by Application 2019 & 2032
- Table 105: Japan Global Bioactive Ingredients Market Revenue (Million) Forecast, by Application 2019 & 2032
- Table 106: Japan Global Bioactive Ingredients Market Volume (K Tons) Forecast, by Application 2019 & 2032
- Table 107: India Global Bioactive Ingredients Market Revenue (Million) Forecast, by Application 2019 & 2032
- Table 108: India Global Bioactive Ingredients Market Volume (K Tons) Forecast, by Application 2019 & 2032
- Table 109: Australia Global Bioactive Ingredients Market Revenue (Million) Forecast, by Application 2019 & 2032
- Table 110: Australia Global Bioactive Ingredients Market Volume (K Tons) Forecast, by Application 2019 & 2032
- Table 111: Rest of Asia Pacific Global Bioactive Ingredients Market Revenue (Million) Forecast, by Application 2019 & 2032
- Table 112: Rest of Asia Pacific Global Bioactive Ingredients Market Volume (K Tons) Forecast, by Application 2019 & 2032
- Table 113: Global Bioactive Ingredients Market Revenue Million Forecast, by Ingredient Type 2019 & 2032
- Table 114: Global Bioactive Ingredients Market Volume K Tons Forecast, by Ingredient Type 2019 & 2032
- Table 115: Global Bioactive Ingredients Market Revenue Million Forecast, by Application 2019 & 2032
- Table 116: Global Bioactive Ingredients Market Volume K Tons Forecast, by Application 2019 & 2032
- Table 117: Global Bioactive Ingredients Market Revenue Million Forecast, by Country 2019 & 2032
- Table 118: Global Bioactive Ingredients Market Volume K Tons Forecast, by Country 2019 & 2032
- Table 119: Brazil Global Bioactive Ingredients Market Revenue (Million) Forecast, by Application 2019 & 2032
- Table 120: Brazil Global Bioactive Ingredients Market Volume (K Tons) Forecast, by Application 2019 & 2032
- Table 121: Argentina Global Bioactive Ingredients Market Revenue (Million) Forecast, by Application 2019 & 2032
- Table 122: Argentina Global Bioactive Ingredients Market Volume (K Tons) Forecast, by Application 2019 & 2032
- Table 123: Rest of South America Global Bioactive Ingredients Market Revenue (Million) Forecast, by Application 2019 & 2032
- Table 124: Rest of South America Global Bioactive Ingredients Market Volume (K Tons) Forecast, by Application 2019 & 2032
- Table 125: Global Bioactive Ingredients Market Revenue Million Forecast, by Ingredient Type 2019 & 2032
- Table 126: Global Bioactive Ingredients Market Volume K Tons Forecast, by Ingredient Type 2019 & 2032
- Table 127: Global Bioactive Ingredients Market Revenue Million Forecast, by Application 2019 & 2032
- Table 128: Global Bioactive Ingredients Market Volume K Tons Forecast, by Application 2019 & 2032
- Table 129: Global Bioactive Ingredients Market Revenue Million Forecast, by Country 2019 & 2032
- Table 130: Global Bioactive Ingredients Market Volume K Tons Forecast, by Country 2019 & 2032
- Table 131: Global Bioactive Ingredients Market Revenue Million Forecast, by Ingredient Type 2019 & 2032
- Table 132: Global Bioactive Ingredients Market Volume K Tons Forecast, by Ingredient Type 2019 & 2032
- Table 133: Global Bioactive Ingredients Market Revenue Million Forecast, by Application 2019 & 2032
- Table 134: Global Bioactive Ingredients Market Volume K Tons Forecast, by Application 2019 & 2032
- Table 135: Global Bioactive Ingredients Market Revenue Million Forecast, by Country 2019 & 2032
- Table 136: Global Bioactive Ingredients Market Volume K Tons Forecast, by Country 2019 & 2032
- Table 137: Saudi Arabia Global Bioactive Ingredients Market Revenue (Million) Forecast, by Application 2019 & 2032
- Table 138: Saudi Arabia Global Bioactive Ingredients Market Volume (K Tons) Forecast, by Application 2019 & 2032
- Table 139: Rest of Middle East Global Bioactive Ingredients Market Revenue (Million) Forecast, by Application 2019 & 2032
- Table 140: Rest of Middle East Global Bioactive Ingredients Market Volume (K Tons) Forecast, by Application 2019 & 2032
Frequently Asked Questions
1. What is the projected Compound Annual Growth Rate (CAGR) of the Global Bioactive Ingredients Market?
The projected CAGR is approximately 8.40%.
2. Which companies are prominent players in the Global Bioactive Ingredients Market?
Key companies in the market include Cargill Incorporated, Royal FrieslandCampina N V, DuPont de Nemours Inc, Archer Daniels Midland Company, Neptune Wellness Solutions*List Not Exhaustive, Chr Hansen Holding A/S, BASF SE, Kerry Group, Advanced Enzyme Technologies, Koninklijke DSM NV, Ingredion Incorporated.
3. What are the main segments of the Global Bioactive Ingredients Market?
The market segments include Ingredient Type, Application.
4. Can you provide details about the market size?
The market size is estimated to be USD 147.64 Million as of 2022.
5. What are some drivers contributing to market growth?
Increasing Demand For Convenience & Processed Food.
6. What are the notable trends driving market growth?
Rising Healthcare Expenditure.
7. Are there any restraints impacting market growth?
Increased Consumer Awareness On Side-Effects Of Chemical Additives.
8. Can you provide examples of recent developments in the market?
January 2023: FrieslandCampina partnered with a specialist biotechnology company, Triplebar Bio Inc. The purpose of this partnership is to produce and scale up the production of cell-based proteins by using precision fermentation.
9. What pricing options are available for accessing the report?
Pricing options include single-user, multi-user, and enterprise licenses priced at USD 4750, USD 5250, and USD 8750 respectively.
10. Is the market size provided in terms of value or volume?
The market size is provided in terms of value, measured in Million and volume, measured in K Tons.
11. Are there any specific market keywords associated with the report?
Yes, the market keyword associated with the report is "Global Bioactive Ingredients Market," which aids in identifying and referencing the specific market segment covered.
12. How do I determine which pricing option suits my needs best?
The pricing options vary based on user requirements and access needs. Individual users may opt for single-user licenses, while businesses requiring broader access may choose multi-user or enterprise licenses for cost-effective access to the report.
13. Are there any additional resources or data provided in the Global Bioactive Ingredients Market report?
While the report offers comprehensive insights, it's advisable to review the specific contents or supplementary materials provided to ascertain if additional resources or data are available.
14. How can I stay updated on further developments or reports in the Global Bioactive Ingredients Market?
To stay informed about further developments, trends, and reports in the Global Bioactive Ingredients Market, consider subscribing to industry newsletters, following relevant companies and organizations, or regularly checking reputable industry news sources and publications.
Methodology
Step 1 - Identification of Relevant Samples Size from Population Database


Step 2 - Approaches for Defining Global Market Size (Value, Volume* & Price*)

Note*: In applicable scenarios
Step 3 - Data Sources
Primary Research
- Web Analytics
- Survey Reports
- Research Institute
- Latest Research Reports
- Opinion Leaders
Secondary Research
- Annual Reports
- White Paper
- Latest Press Release
- Industry Association
- Paid Database
- Investor Presentations

Step 4 - Data Triangulation
Involves using different sources of information in order to increase the validity of a study
These sources are likely to be stakeholders in a program - participants, other researchers, program staff, other community members, and so on.
Then we put all data in single framework & apply various statistical tools to find out the dynamic on the market.
During the analysis stage, feedback from the stakeholder groups would be compared to determine areas of agreement as well as areas of divergence


