
Key Insights
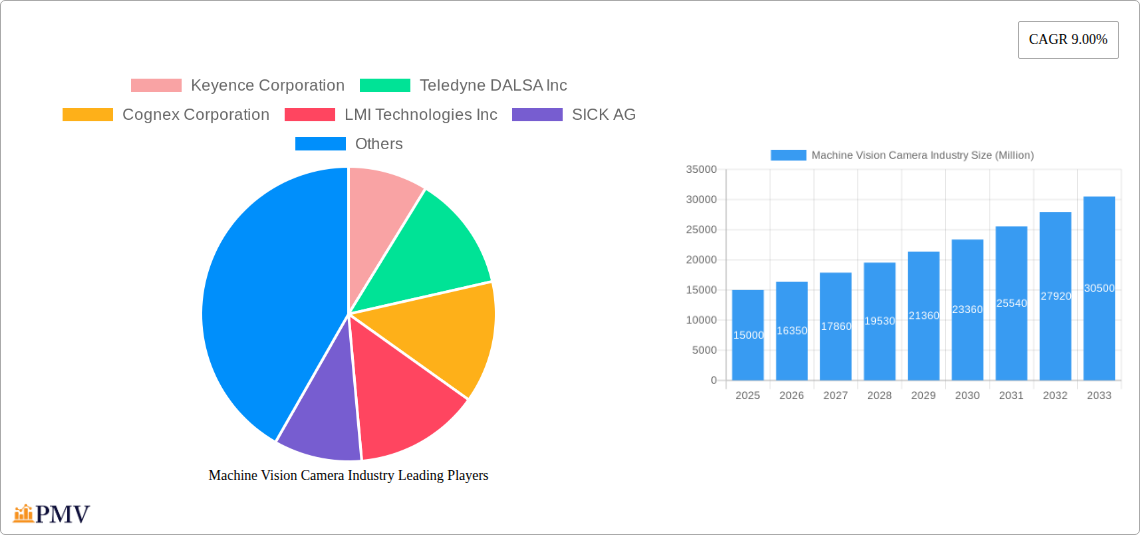
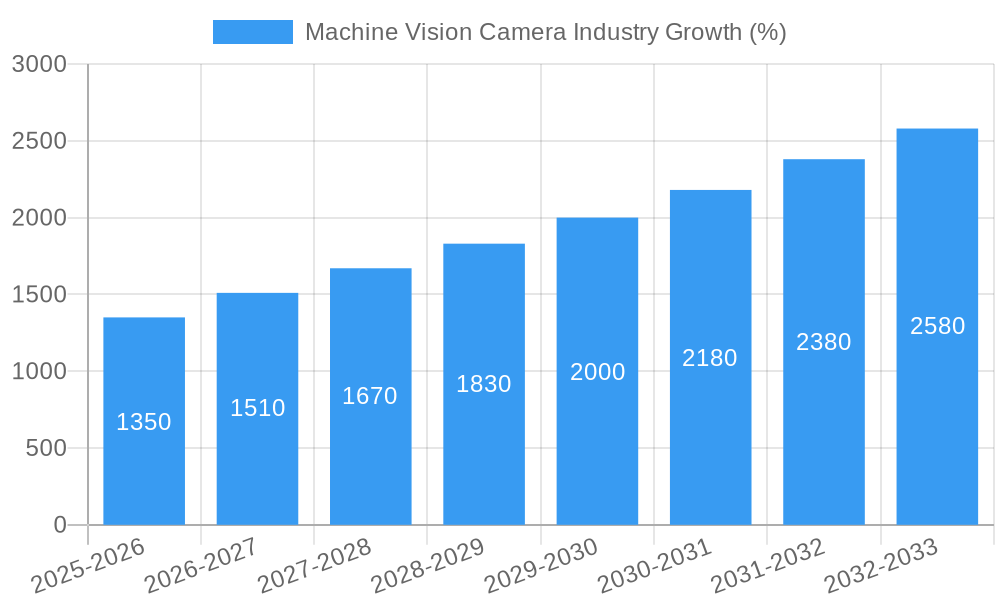
The global machine vision camera market is experiencing robust growth, projected to reach a substantial size by 2033, driven by a Compound Annual Growth Rate (CAGR) of 9.00% from 2025 to 2033. This expansion is fueled by several key factors. The increasing automation across various industries, particularly electronics and semiconductors, automotive, and healthcare, is a significant driver. These sectors are increasingly reliant on machine vision cameras for quality control, process optimization, and improved efficiency. Advancements in camera technology, such as higher resolution sensors, faster processing speeds, and enhanced functionalities like 3D imaging, are also contributing to market growth. Furthermore, the rising adoption of Industry 4.0 principles and the growing need for sophisticated automation solutions are further boosting demand. The market is segmented by camera type (inline and area scan) and end-user industry, offering diverse application opportunities. While potential restraints like high initial investment costs and the need for skilled labor exist, the overall market trajectory remains positive due to the overwhelming benefits offered by machine vision systems.
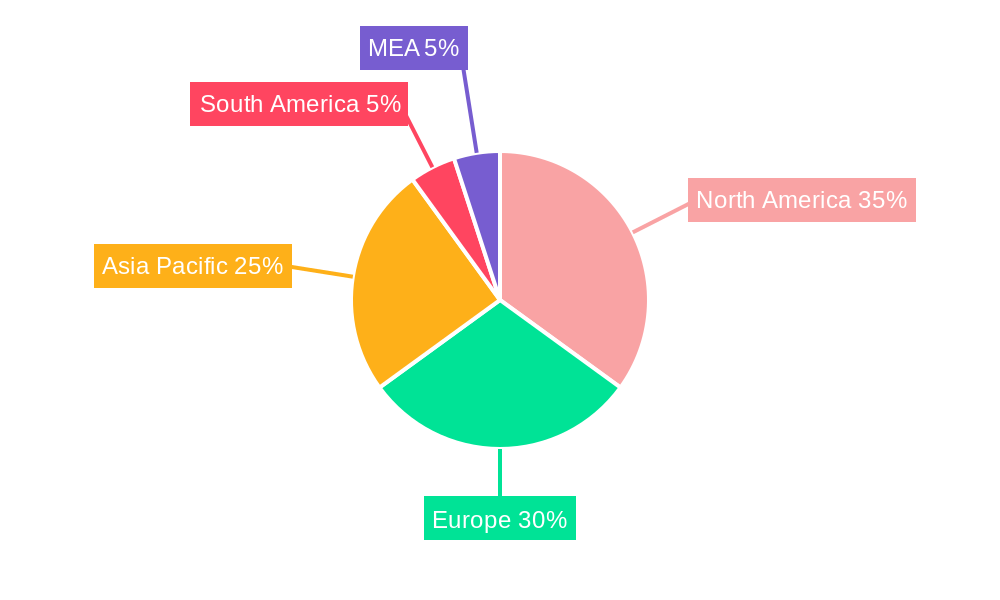
The regional distribution of the machine vision camera market shows strong performance across North America, Europe, and Asia-Pacific. North America, especially the United States, holds a significant market share due to its advanced technological infrastructure and strong presence of major industry players. Europe follows closely, driven by the growth of automation in manufacturing and logistics sectors. Asia-Pacific is exhibiting rapid growth, propelled by increasing industrialization and manufacturing activities in countries like China, Japan, and India. The continued expansion of e-commerce and the need for efficient supply chain management are also positively impacting market growth in this region. While South America and the Middle East and Africa are comparatively smaller markets, they also show potential for growth in the coming years as automation initiatives expand. The consistent innovation within the machine vision camera industry, focusing on improved accuracy, speed, and affordability, will likely continue driving market expansion throughout the forecast period.
Machine Vision Camera Industry: A Comprehensive Market Report (2019-2033)
This in-depth report provides a comprehensive analysis of the global Machine Vision Camera industry, offering invaluable insights for stakeholders seeking to navigate this dynamic market. Covering the period from 2019 to 2033, with a base year of 2025 and a forecast period from 2025 to 2033, this report leverages extensive data analysis to offer actionable strategies and forecasts. The global market value is projected to reach xx Million by 2033, exhibiting a robust CAGR of xx% during the forecast period.
Machine Vision Camera Industry Market Structure & Competitive Dynamics
The Machine Vision Camera industry exhibits a moderately concentrated market structure, with several key players holding significant market share. Keyence Corporation, Keyence Corporation, Cognex Corporation, Cognex Corporation, and Teledyne DALSA Inc. are among the dominant players, collectively accounting for an estimated xx% of the global market share in 2025. The industry's competitive landscape is characterized by intense innovation, with companies continuously investing in R&D to enhance camera functionalities and expand application reach. Regulatory frameworks, particularly concerning data privacy and safety standards, significantly influence industry operations. The presence of substitute technologies, such as LiDAR and 3D scanning, presents ongoing competitive pressure. End-user trends, such as the increasing automation in manufacturing and the growing demand for sophisticated quality control solutions, are shaping market growth. M&A activities are relatively frequent, with deal values exceeding xx Million in recent years, as larger companies seek to consolidate their market position and access new technologies. For example, the acquisition of Company X by Company Y in 2022 significantly impacted the market share dynamics of the area scan segment.
- Market Concentration: High, with top 5 players holding xx% market share.
- Innovation Ecosystems: Strong emphasis on R&D, with significant investments in advanced imaging technologies.
- Regulatory Frameworks: Stringent data privacy and safety regulations impact operations.
- Product Substitutes: LiDAR and 3D scanning present competitive challenges.
- End-User Trends: Automation and quality control drive market growth.
- M&A Activities: Significant activity with deals exceeding xx Million annually.
Machine Vision Camera Industry Industry Trends & Insights
The global Machine Vision Camera market is experiencing robust growth, driven by several factors. The increasing adoption of automation across various industries, coupled with the rising demand for improved quality control and process optimization, is a primary growth driver. Technological advancements, such as the development of higher-resolution cameras, improved processing speeds, and the integration of AI and machine learning capabilities, are further fueling market expansion. Consumer preferences are shifting towards more sophisticated and versatile machine vision systems capable of handling complex tasks. Competitive dynamics are characterized by fierce innovation, strategic partnerships, and mergers & acquisitions, all contributing to market expansion. The market is projected to witness a CAGR of xx% during the forecast period, with market penetration expanding significantly in emerging economies. Specific technological disruptions include the rise of 3D vision systems and the integration of edge computing capabilities for real-time processing. These developments are transforming the market, enabling new applications and increasing the overall efficiency of machine vision systems. The market penetration rate in the automotive sector is projected to reach xx% by 2033.
Dominant Markets & Segments in Machine Vision Camera Industry
The Electronics & Semiconductor industry is the dominant end-user segment for machine vision cameras, accounting for xx% of the market share in 2025. This is driven by stringent quality control requirements and the automation needs within the semiconductor manufacturing process. The Asia-Pacific region, specifically China, is the leading geographic market, due to its robust electronics manufacturing base and supportive government policies. The Area Scan segment holds a larger market share than the Inline segment due to its versatility and suitability for diverse applications.
Key Drivers:
- Electronics & Semiconductor: Stringent quality control, high automation levels.
- Automotive: Advanced Driver-Assistance Systems (ADAS), autonomous driving development.
- Healthcare: Medical imaging, diagnostics, robotic surgery.
- Food Processing: Quality inspection, automated sorting, process optimization.
- Aerospace: Non-destructive testing, automated assembly, quality control.
- Asia-Pacific (China): Robust electronics manufacturing, government support.
Dominance Analysis: The dominance of the Electronics & Semiconductor segment is primarily attributable to the high volume of production and stringent quality requirements in the industry. China's leading position is largely due to its massive manufacturing capacity and significant investments in automation.
Machine Vision Camera Industry Product Innovations
Recent years have witnessed significant product innovations in the machine vision camera industry. The integration of Artificial Intelligence (AI) and machine learning algorithms into camera systems is a major development, enhancing their ability to process complex visual information and enabling advanced features such as object recognition and classification. The development of higher-resolution cameras with improved sensitivity and faster frame rates has broadened application possibilities. Miniaturization of camera systems and the development of robust, compact designs are making them suitable for a wider range of applications. These innovations are enhancing the competitive advantage of leading players and driving market expansion.
Report Segmentation & Scope
This report segments the machine vision camera market by type (Inline, Area Scan) and by end-user industry (Electronics & Semiconductor, Automotive, Healthcare, Food Processing, Aerospace, Other End-user Industries). Each segment is analyzed in detail, providing market size estimations, growth projections, and competitive dynamics. The Inline segment is projected to exhibit xx% CAGR over the forecast period, while the Area Scan segment is expected to grow at xx%. The Electronics & Semiconductor segment is expected to maintain its market leadership, while the Automotive segment is projected to show significant growth, driven by the increasing adoption of ADAS and autonomous driving technologies. Detailed competitive landscapes are provided for each segment, considering factors such as market share, product differentiation, and pricing strategies.
Key Drivers of Machine Vision Camera Industry Growth
Several factors are driving the growth of the Machine Vision Camera industry. Technological advancements, particularly in AI and image processing, are enhancing the capabilities of machine vision systems. The increasing demand for automation across diverse industries, driven by rising labor costs and the need for improved efficiency, is another significant factor. Government initiatives promoting industrial automation and digital transformation further contribute to market growth. Specific examples include government subsidies for automation in manufacturing and the development of industry 4.0 standards.
Challenges in the Machine Vision Camera Industry Sector
The Machine Vision Camera industry faces several challenges. The high cost of advanced machine vision systems can be a barrier to adoption for smaller businesses. Supply chain disruptions, particularly related to semiconductor components, can impact production and delivery timelines. Intense competition among industry players can lead to price pressures and reduced profit margins. These factors combined may result in a xx% reduction in overall profitability for some companies in 2026 if supply chain disruptions continue at current levels. Furthermore, regulatory changes related to data privacy and cybersecurity could add compliance costs.
Leading Players in the Machine Vision Camera Industry Market
- Keyence Corporation
- Teledyne DALSA Inc
- Cognex Corporation
- LMI Technologies Inc
- SICK AG
- Allied Vision Technologies GmbH
- National Instruments Corporation
- Tordivel AS
- Adimec Advanced Image Systems bv
- Omron Microscan Systems Inc
- Basler AG
Key Developments in Machine Vision Camera Industry Sector
- June 2023: Cognex Corporation launches a new high-resolution camera with AI capabilities.
- October 2022: Keyence Corporation acquires a smaller competitor, expanding its market share.
- March 2022: Teledyne DALSA Inc. announces a strategic partnership to develop advanced image processing software.
Strategic Machine Vision Camera Industry Market Outlook
The future of the Machine Vision Camera industry appears bright, with significant growth potential driven by continuous technological innovation and the increasing adoption of automation across diverse sectors. Strategic opportunities exist for companies to capitalize on the growing demand for AI-powered vision systems and to develop specialized solutions for niche applications. The integration of machine vision with other technologies, such as robotics and IoT, will further enhance market growth. Expanding into emerging markets and developing cost-effective solutions will also be crucial for achieving sustainable growth in the long term.
Machine Vision Camera Industry Segmentation
-
1. Type
- 1.1. Inline
- 1.2. Area Scan
-
2. End-user Industries
- 2.1. Electronics & Semiconductor
- 2.2. Automotive
- 2.3. Heathcare
- 2.4. Food Processing
- 2.5. Aerospace
- 2.6. Other End-user Industries
Machine Vision Camera Industry Segmentation By Geography
- 1. North America
- 2. Europe
- 3. Asia Pacific
- 4. Rest of the World
Machine Vision Camera Industry REPORT HIGHLIGHTS
| Aspects | Details |
|---|---|
| Study Period | 2019-2033 |
| Base Year | 2024 |
| Estimated Year | 2025 |
| Forecast Period | 2025-2033 |
| Historical Period | 2019-2024 |
| Growth Rate | CAGR of 9.00% from 2019-2033 |
| Segmentation |
|
Table of Contents
- 1. Introduction
- 1.1. Research Scope
- 1.2. Market Segmentation
- 1.3. Research Methodology
- 1.4. Definitions and Assumptions
- 2. Executive Summary
- 2.1. Introduction
- 3. Market Dynamics
- 3.1. Introduction
- 3.2. Market Drivers
- 3.2.1. ; Increasing Implementation of Advanced Technologies in Industries
- 3.3. Market Restrains
- 3.3.1. ; Lack of Skilled Labour and Inconsistency in the End-user Requirements/Demands
- 3.4. Market Trends
- 3.4.1. The Demand from Automotive Industry to Grow Significantly
- 4. Market Factor Analysis
- 4.1. Porters Five Forces
- 4.2. Supply/Value Chain
- 4.3. PESTEL analysis
- 4.4. Market Entropy
- 4.5. Patent/Trademark Analysis
- 5. Global Machine Vision Camera Industry Analysis, Insights and Forecast, 2019-2031
- 5.1. Market Analysis, Insights and Forecast - by Type
- 5.1.1. Inline
- 5.1.2. Area Scan
- 5.2. Market Analysis, Insights and Forecast - by End-user Industries
- 5.2.1. Electronics & Semiconductor
- 5.2.2. Automotive
- 5.2.3. Heathcare
- 5.2.4. Food Processing
- 5.2.5. Aerospace
- 5.2.6. Other End-user Industries
- 5.3. Market Analysis, Insights and Forecast - by Region
- 5.3.1. North America
- 5.3.2. Europe
- 5.3.3. Asia Pacific
- 5.3.4. Rest of the World
- 5.1. Market Analysis, Insights and Forecast - by Type
- 6. North America Machine Vision Camera Industry Analysis, Insights and Forecast, 2019-2031
- 6.1. Market Analysis, Insights and Forecast - by Type
- 6.1.1. Inline
- 6.1.2. Area Scan
- 6.2. Market Analysis, Insights and Forecast - by End-user Industries
- 6.2.1. Electronics & Semiconductor
- 6.2.2. Automotive
- 6.2.3. Heathcare
- 6.2.4. Food Processing
- 6.2.5. Aerospace
- 6.2.6. Other End-user Industries
- 6.1. Market Analysis, Insights and Forecast - by Type
- 7. Europe Machine Vision Camera Industry Analysis, Insights and Forecast, 2019-2031
- 7.1. Market Analysis, Insights and Forecast - by Type
- 7.1.1. Inline
- 7.1.2. Area Scan
- 7.2. Market Analysis, Insights and Forecast - by End-user Industries
- 7.2.1. Electronics & Semiconductor
- 7.2.2. Automotive
- 7.2.3. Heathcare
- 7.2.4. Food Processing
- 7.2.5. Aerospace
- 7.2.6. Other End-user Industries
- 7.1. Market Analysis, Insights and Forecast - by Type
- 8. Asia Pacific Machine Vision Camera Industry Analysis, Insights and Forecast, 2019-2031
- 8.1. Market Analysis, Insights and Forecast - by Type
- 8.1.1. Inline
- 8.1.2. Area Scan
- 8.2. Market Analysis, Insights and Forecast - by End-user Industries
- 8.2.1. Electronics & Semiconductor
- 8.2.2. Automotive
- 8.2.3. Heathcare
- 8.2.4. Food Processing
- 8.2.5. Aerospace
- 8.2.6. Other End-user Industries
- 8.1. Market Analysis, Insights and Forecast - by Type
- 9. Rest of the World Machine Vision Camera Industry Analysis, Insights and Forecast, 2019-2031
- 9.1. Market Analysis, Insights and Forecast - by Type
- 9.1.1. Inline
- 9.1.2. Area Scan
- 9.2. Market Analysis, Insights and Forecast - by End-user Industries
- 9.2.1. Electronics & Semiconductor
- 9.2.2. Automotive
- 9.2.3. Heathcare
- 9.2.4. Food Processing
- 9.2.5. Aerospace
- 9.2.6. Other End-user Industries
- 9.1. Market Analysis, Insights and Forecast - by Type
- 10. North America Machine Vision Camera Industry Analysis, Insights and Forecast, 2019-2031
- 10.1. Market Analysis, Insights and Forecast - By Country/Sub-region
- 10.1.1 United States
- 10.1.2 Canada
- 10.1.3 Mexico
- 11. Europe Machine Vision Camera Industry Analysis, Insights and Forecast, 2019-2031
- 11.1. Market Analysis, Insights and Forecast - By Country/Sub-region
- 11.1.1 Germany
- 11.1.2 United Kingdom
- 11.1.3 France
- 11.1.4 Spain
- 11.1.5 Italy
- 11.1.6 Spain
- 11.1.7 Belgium
- 11.1.8 Netherland
- 11.1.9 Nordics
- 11.1.10 Rest of Europe
- 12. Asia Pacific Machine Vision Camera Industry Analysis, Insights and Forecast, 2019-2031
- 12.1. Market Analysis, Insights and Forecast - By Country/Sub-region
- 12.1.1 China
- 12.1.2 Japan
- 12.1.3 India
- 12.1.4 South Korea
- 12.1.5 Southeast Asia
- 12.1.6 Australia
- 12.1.7 Indonesia
- 12.1.8 Phillipes
- 12.1.9 Singapore
- 12.1.10 Thailandc
- 12.1.11 Rest of Asia Pacific
- 13. South America Machine Vision Camera Industry Analysis, Insights and Forecast, 2019-2031
- 13.1. Market Analysis, Insights and Forecast - By Country/Sub-region
- 13.1.1 Brazil
- 13.1.2 Argentina
- 13.1.3 Peru
- 13.1.4 Chile
- 13.1.5 Colombia
- 13.1.6 Ecuador
- 13.1.7 Venezuela
- 13.1.8 Rest of South America
- 14. North America Machine Vision Camera Industry Analysis, Insights and Forecast, 2019-2031
- 14.1. Market Analysis, Insights and Forecast - By Country/Sub-region
- 14.1.1 United States
- 14.1.2 Canada
- 14.1.3 Mexico
- 15. MEA Machine Vision Camera Industry Analysis, Insights and Forecast, 2019-2031
- 15.1. Market Analysis, Insights and Forecast - By Country/Sub-region
- 15.1.1 United Arab Emirates
- 15.1.2 Saudi Arabia
- 15.1.3 South Africa
- 15.1.4 Rest of Middle East and Africa
- 16. Competitive Analysis
- 16.1. Global Market Share Analysis 2024
- 16.2. Company Profiles
- 16.2.1 Keyence Corporation
- 16.2.1.1. Overview
- 16.2.1.2. Products
- 16.2.1.3. SWOT Analysis
- 16.2.1.4. Recent Developments
- 16.2.1.5. Financials (Based on Availability)
- 16.2.2 Teledyne DALSA Inc
- 16.2.2.1. Overview
- 16.2.2.2. Products
- 16.2.2.3. SWOT Analysis
- 16.2.2.4. Recent Developments
- 16.2.2.5. Financials (Based on Availability)
- 16.2.3 Cognex Corporation
- 16.2.3.1. Overview
- 16.2.3.2. Products
- 16.2.3.3. SWOT Analysis
- 16.2.3.4. Recent Developments
- 16.2.3.5. Financials (Based on Availability)
- 16.2.4 LMI Technologies Inc
- 16.2.4.1. Overview
- 16.2.4.2. Products
- 16.2.4.3. SWOT Analysis
- 16.2.4.4. Recent Developments
- 16.2.4.5. Financials (Based on Availability)
- 16.2.5 SICK AG
- 16.2.5.1. Overview
- 16.2.5.2. Products
- 16.2.5.3. SWOT Analysis
- 16.2.5.4. Recent Developments
- 16.2.5.5. Financials (Based on Availability)
- 16.2.6 Allied Vision Technologies GmbH
- 16.2.6.1. Overview
- 16.2.6.2. Products
- 16.2.6.3. SWOT Analysis
- 16.2.6.4. Recent Developments
- 16.2.6.5. Financials (Based on Availability)
- 16.2.7 National Instruments Corporation
- 16.2.7.1. Overview
- 16.2.7.2. Products
- 16.2.7.3. SWOT Analysis
- 16.2.7.4. Recent Developments
- 16.2.7.5. Financials (Based on Availability)
- 16.2.8 Tordivel AS
- 16.2.8.1. Overview
- 16.2.8.2. Products
- 16.2.8.3. SWOT Analysis
- 16.2.8.4. Recent Developments
- 16.2.8.5. Financials (Based on Availability)
- 16.2.9 Adimec Advanced Image Systems bv
- 16.2.9.1. Overview
- 16.2.9.2. Products
- 16.2.9.3. SWOT Analysis
- 16.2.9.4. Recent Developments
- 16.2.9.5. Financials (Based on Availability)
- 16.2.10 Omron Microscan Systems Inc
- 16.2.10.1. Overview
- 16.2.10.2. Products
- 16.2.10.3. SWOT Analysis
- 16.2.10.4. Recent Developments
- 16.2.10.5. Financials (Based on Availability)
- 16.2.11 Basler AG
- 16.2.11.1. Overview
- 16.2.11.2. Products
- 16.2.11.3. SWOT Analysis
- 16.2.11.4. Recent Developments
- 16.2.11.5. Financials (Based on Availability)
- 16.2.1 Keyence Corporation
List of Figures
- Figure 1: Global Machine Vision Camera Industry Revenue Breakdown (Million, %) by Region 2024 & 2032
- Figure 2: Global Machine Vision Camera Industry Volume Breakdown (K Unit, %) by Region 2024 & 2032
- Figure 3: North America Machine Vision Camera Industry Revenue (Million), by Country 2024 & 2032
- Figure 4: North America Machine Vision Camera Industry Volume (K Unit), by Country 2024 & 2032
- Figure 5: North America Machine Vision Camera Industry Revenue Share (%), by Country 2024 & 2032
- Figure 6: North America Machine Vision Camera Industry Volume Share (%), by Country 2024 & 2032
- Figure 7: Europe Machine Vision Camera Industry Revenue (Million), by Country 2024 & 2032
- Figure 8: Europe Machine Vision Camera Industry Volume (K Unit), by Country 2024 & 2032
- Figure 9: Europe Machine Vision Camera Industry Revenue Share (%), by Country 2024 & 2032
- Figure 10: Europe Machine Vision Camera Industry Volume Share (%), by Country 2024 & 2032
- Figure 11: Asia Pacific Machine Vision Camera Industry Revenue (Million), by Country 2024 & 2032
- Figure 12: Asia Pacific Machine Vision Camera Industry Volume (K Unit), by Country 2024 & 2032
- Figure 13: Asia Pacific Machine Vision Camera Industry Revenue Share (%), by Country 2024 & 2032
- Figure 14: Asia Pacific Machine Vision Camera Industry Volume Share (%), by Country 2024 & 2032
- Figure 15: South America Machine Vision Camera Industry Revenue (Million), by Country 2024 & 2032
- Figure 16: South America Machine Vision Camera Industry Volume (K Unit), by Country 2024 & 2032
- Figure 17: South America Machine Vision Camera Industry Revenue Share (%), by Country 2024 & 2032
- Figure 18: South America Machine Vision Camera Industry Volume Share (%), by Country 2024 & 2032
- Figure 19: North America Machine Vision Camera Industry Revenue (Million), by Country 2024 & 2032
- Figure 20: North America Machine Vision Camera Industry Volume (K Unit), by Country 2024 & 2032
- Figure 21: North America Machine Vision Camera Industry Revenue Share (%), by Country 2024 & 2032
- Figure 22: North America Machine Vision Camera Industry Volume Share (%), by Country 2024 & 2032
- Figure 23: MEA Machine Vision Camera Industry Revenue (Million), by Country 2024 & 2032
- Figure 24: MEA Machine Vision Camera Industry Volume (K Unit), by Country 2024 & 2032
- Figure 25: MEA Machine Vision Camera Industry Revenue Share (%), by Country 2024 & 2032
- Figure 26: MEA Machine Vision Camera Industry Volume Share (%), by Country 2024 & 2032
- Figure 27: North America Machine Vision Camera Industry Revenue (Million), by Type 2024 & 2032
- Figure 28: North America Machine Vision Camera Industry Volume (K Unit), by Type 2024 & 2032
- Figure 29: North America Machine Vision Camera Industry Revenue Share (%), by Type 2024 & 2032
- Figure 30: North America Machine Vision Camera Industry Volume Share (%), by Type 2024 & 2032
- Figure 31: North America Machine Vision Camera Industry Revenue (Million), by End-user Industries 2024 & 2032
- Figure 32: North America Machine Vision Camera Industry Volume (K Unit), by End-user Industries 2024 & 2032
- Figure 33: North America Machine Vision Camera Industry Revenue Share (%), by End-user Industries 2024 & 2032
- Figure 34: North America Machine Vision Camera Industry Volume Share (%), by End-user Industries 2024 & 2032
- Figure 35: North America Machine Vision Camera Industry Revenue (Million), by Country 2024 & 2032
- Figure 36: North America Machine Vision Camera Industry Volume (K Unit), by Country 2024 & 2032
- Figure 37: North America Machine Vision Camera Industry Revenue Share (%), by Country 2024 & 2032
- Figure 38: North America Machine Vision Camera Industry Volume Share (%), by Country 2024 & 2032
- Figure 39: Europe Machine Vision Camera Industry Revenue (Million), by Type 2024 & 2032
- Figure 40: Europe Machine Vision Camera Industry Volume (K Unit), by Type 2024 & 2032
- Figure 41: Europe Machine Vision Camera Industry Revenue Share (%), by Type 2024 & 2032
- Figure 42: Europe Machine Vision Camera Industry Volume Share (%), by Type 2024 & 2032
- Figure 43: Europe Machine Vision Camera Industry Revenue (Million), by End-user Industries 2024 & 2032
- Figure 44: Europe Machine Vision Camera Industry Volume (K Unit), by End-user Industries 2024 & 2032
- Figure 45: Europe Machine Vision Camera Industry Revenue Share (%), by End-user Industries 2024 & 2032
- Figure 46: Europe Machine Vision Camera Industry Volume Share (%), by End-user Industries 2024 & 2032
- Figure 47: Europe Machine Vision Camera Industry Revenue (Million), by Country 2024 & 2032
- Figure 48: Europe Machine Vision Camera Industry Volume (K Unit), by Country 2024 & 2032
- Figure 49: Europe Machine Vision Camera Industry Revenue Share (%), by Country 2024 & 2032
- Figure 50: Europe Machine Vision Camera Industry Volume Share (%), by Country 2024 & 2032
- Figure 51: Asia Pacific Machine Vision Camera Industry Revenue (Million), by Type 2024 & 2032
- Figure 52: Asia Pacific Machine Vision Camera Industry Volume (K Unit), by Type 2024 & 2032
- Figure 53: Asia Pacific Machine Vision Camera Industry Revenue Share (%), by Type 2024 & 2032
- Figure 54: Asia Pacific Machine Vision Camera Industry Volume Share (%), by Type 2024 & 2032
- Figure 55: Asia Pacific Machine Vision Camera Industry Revenue (Million), by End-user Industries 2024 & 2032
- Figure 56: Asia Pacific Machine Vision Camera Industry Volume (K Unit), by End-user Industries 2024 & 2032
- Figure 57: Asia Pacific Machine Vision Camera Industry Revenue Share (%), by End-user Industries 2024 & 2032
- Figure 58: Asia Pacific Machine Vision Camera Industry Volume Share (%), by End-user Industries 2024 & 2032
- Figure 59: Asia Pacific Machine Vision Camera Industry Revenue (Million), by Country 2024 & 2032
- Figure 60: Asia Pacific Machine Vision Camera Industry Volume (K Unit), by Country 2024 & 2032
- Figure 61: Asia Pacific Machine Vision Camera Industry Revenue Share (%), by Country 2024 & 2032
- Figure 62: Asia Pacific Machine Vision Camera Industry Volume Share (%), by Country 2024 & 2032
- Figure 63: Rest of the World Machine Vision Camera Industry Revenue (Million), by Type 2024 & 2032
- Figure 64: Rest of the World Machine Vision Camera Industry Volume (K Unit), by Type 2024 & 2032
- Figure 65: Rest of the World Machine Vision Camera Industry Revenue Share (%), by Type 2024 & 2032
- Figure 66: Rest of the World Machine Vision Camera Industry Volume Share (%), by Type 2024 & 2032
- Figure 67: Rest of the World Machine Vision Camera Industry Revenue (Million), by End-user Industries 2024 & 2032
- Figure 68: Rest of the World Machine Vision Camera Industry Volume (K Unit), by End-user Industries 2024 & 2032
- Figure 69: Rest of the World Machine Vision Camera Industry Revenue Share (%), by End-user Industries 2024 & 2032
- Figure 70: Rest of the World Machine Vision Camera Industry Volume Share (%), by End-user Industries 2024 & 2032
- Figure 71: Rest of the World Machine Vision Camera Industry Revenue (Million), by Country 2024 & 2032
- Figure 72: Rest of the World Machine Vision Camera Industry Volume (K Unit), by Country 2024 & 2032
- Figure 73: Rest of the World Machine Vision Camera Industry Revenue Share (%), by Country 2024 & 2032
- Figure 74: Rest of the World Machine Vision Camera Industry Volume Share (%), by Country 2024 & 2032
List of Tables
- Table 1: Global Machine Vision Camera Industry Revenue Million Forecast, by Region 2019 & 2032
- Table 2: Global Machine Vision Camera Industry Volume K Unit Forecast, by Region 2019 & 2032
- Table 3: Global Machine Vision Camera Industry Revenue Million Forecast, by Type 2019 & 2032
- Table 4: Global Machine Vision Camera Industry Volume K Unit Forecast, by Type 2019 & 2032
- Table 5: Global Machine Vision Camera Industry Revenue Million Forecast, by End-user Industries 2019 & 2032
- Table 6: Global Machine Vision Camera Industry Volume K Unit Forecast, by End-user Industries 2019 & 2032
- Table 7: Global Machine Vision Camera Industry Revenue Million Forecast, by Region 2019 & 2032
- Table 8: Global Machine Vision Camera Industry Volume K Unit Forecast, by Region 2019 & 2032
- Table 9: Global Machine Vision Camera Industry Revenue Million Forecast, by Country 2019 & 2032
- Table 10: Global Machine Vision Camera Industry Volume K Unit Forecast, by Country 2019 & 2032
- Table 11: United States Machine Vision Camera Industry Revenue (Million) Forecast, by Application 2019 & 2032
- Table 12: United States Machine Vision Camera Industry Volume (K Unit) Forecast, by Application 2019 & 2032
- Table 13: Canada Machine Vision Camera Industry Revenue (Million) Forecast, by Application 2019 & 2032
- Table 14: Canada Machine Vision Camera Industry Volume (K Unit) Forecast, by Application 2019 & 2032
- Table 15: Mexico Machine Vision Camera Industry Revenue (Million) Forecast, by Application 2019 & 2032
- Table 16: Mexico Machine Vision Camera Industry Volume (K Unit) Forecast, by Application 2019 & 2032
- Table 17: Global Machine Vision Camera Industry Revenue Million Forecast, by Country 2019 & 2032
- Table 18: Global Machine Vision Camera Industry Volume K Unit Forecast, by Country 2019 & 2032
- Table 19: Germany Machine Vision Camera Industry Revenue (Million) Forecast, by Application 2019 & 2032
- Table 20: Germany Machine Vision Camera Industry Volume (K Unit) Forecast, by Application 2019 & 2032
- Table 21: United Kingdom Machine Vision Camera Industry Revenue (Million) Forecast, by Application 2019 & 2032
- Table 22: United Kingdom Machine Vision Camera Industry Volume (K Unit) Forecast, by Application 2019 & 2032
- Table 23: France Machine Vision Camera Industry Revenue (Million) Forecast, by Application 2019 & 2032
- Table 24: France Machine Vision Camera Industry Volume (K Unit) Forecast, by Application 2019 & 2032
- Table 25: Spain Machine Vision Camera Industry Revenue (Million) Forecast, by Application 2019 & 2032
- Table 26: Spain Machine Vision Camera Industry Volume (K Unit) Forecast, by Application 2019 & 2032
- Table 27: Italy Machine Vision Camera Industry Revenue (Million) Forecast, by Application 2019 & 2032
- Table 28: Italy Machine Vision Camera Industry Volume (K Unit) Forecast, by Application 2019 & 2032
- Table 29: Spain Machine Vision Camera Industry Revenue (Million) Forecast, by Application 2019 & 2032
- Table 30: Spain Machine Vision Camera Industry Volume (K Unit) Forecast, by Application 2019 & 2032
- Table 31: Belgium Machine Vision Camera Industry Revenue (Million) Forecast, by Application 2019 & 2032
- Table 32: Belgium Machine Vision Camera Industry Volume (K Unit) Forecast, by Application 2019 & 2032
- Table 33: Netherland Machine Vision Camera Industry Revenue (Million) Forecast, by Application 2019 & 2032
- Table 34: Netherland Machine Vision Camera Industry Volume (K Unit) Forecast, by Application 2019 & 2032
- Table 35: Nordics Machine Vision Camera Industry Revenue (Million) Forecast, by Application 2019 & 2032
- Table 36: Nordics Machine Vision Camera Industry Volume (K Unit) Forecast, by Application 2019 & 2032
- Table 37: Rest of Europe Machine Vision Camera Industry Revenue (Million) Forecast, by Application 2019 & 2032
- Table 38: Rest of Europe Machine Vision Camera Industry Volume (K Unit) Forecast, by Application 2019 & 2032
- Table 39: Global Machine Vision Camera Industry Revenue Million Forecast, by Country 2019 & 2032
- Table 40: Global Machine Vision Camera Industry Volume K Unit Forecast, by Country 2019 & 2032
- Table 41: China Machine Vision Camera Industry Revenue (Million) Forecast, by Application 2019 & 2032
- Table 42: China Machine Vision Camera Industry Volume (K Unit) Forecast, by Application 2019 & 2032
- Table 43: Japan Machine Vision Camera Industry Revenue (Million) Forecast, by Application 2019 & 2032
- Table 44: Japan Machine Vision Camera Industry Volume (K Unit) Forecast, by Application 2019 & 2032
- Table 45: India Machine Vision Camera Industry Revenue (Million) Forecast, by Application 2019 & 2032
- Table 46: India Machine Vision Camera Industry Volume (K Unit) Forecast, by Application 2019 & 2032
- Table 47: South Korea Machine Vision Camera Industry Revenue (Million) Forecast, by Application 2019 & 2032
- Table 48: South Korea Machine Vision Camera Industry Volume (K Unit) Forecast, by Application 2019 & 2032
- Table 49: Southeast Asia Machine Vision Camera Industry Revenue (Million) Forecast, by Application 2019 & 2032
- Table 50: Southeast Asia Machine Vision Camera Industry Volume (K Unit) Forecast, by Application 2019 & 2032
- Table 51: Australia Machine Vision Camera Industry Revenue (Million) Forecast, by Application 2019 & 2032
- Table 52: Australia Machine Vision Camera Industry Volume (K Unit) Forecast, by Application 2019 & 2032
- Table 53: Indonesia Machine Vision Camera Industry Revenue (Million) Forecast, by Application 2019 & 2032
- Table 54: Indonesia Machine Vision Camera Industry Volume (K Unit) Forecast, by Application 2019 & 2032
- Table 55: Phillipes Machine Vision Camera Industry Revenue (Million) Forecast, by Application 2019 & 2032
- Table 56: Phillipes Machine Vision Camera Industry Volume (K Unit) Forecast, by Application 2019 & 2032
- Table 57: Singapore Machine Vision Camera Industry Revenue (Million) Forecast, by Application 2019 & 2032
- Table 58: Singapore Machine Vision Camera Industry Volume (K Unit) Forecast, by Application 2019 & 2032
- Table 59: Thailandc Machine Vision Camera Industry Revenue (Million) Forecast, by Application 2019 & 2032
- Table 60: Thailandc Machine Vision Camera Industry Volume (K Unit) Forecast, by Application 2019 & 2032
- Table 61: Rest of Asia Pacific Machine Vision Camera Industry Revenue (Million) Forecast, by Application 2019 & 2032
- Table 62: Rest of Asia Pacific Machine Vision Camera Industry Volume (K Unit) Forecast, by Application 2019 & 2032
- Table 63: Global Machine Vision Camera Industry Revenue Million Forecast, by Country 2019 & 2032
- Table 64: Global Machine Vision Camera Industry Volume K Unit Forecast, by Country 2019 & 2032
- Table 65: Brazil Machine Vision Camera Industry Revenue (Million) Forecast, by Application 2019 & 2032
- Table 66: Brazil Machine Vision Camera Industry Volume (K Unit) Forecast, by Application 2019 & 2032
- Table 67: Argentina Machine Vision Camera Industry Revenue (Million) Forecast, by Application 2019 & 2032
- Table 68: Argentina Machine Vision Camera Industry Volume (K Unit) Forecast, by Application 2019 & 2032
- Table 69: Peru Machine Vision Camera Industry Revenue (Million) Forecast, by Application 2019 & 2032
- Table 70: Peru Machine Vision Camera Industry Volume (K Unit) Forecast, by Application 2019 & 2032
- Table 71: Chile Machine Vision Camera Industry Revenue (Million) Forecast, by Application 2019 & 2032
- Table 72: Chile Machine Vision Camera Industry Volume (K Unit) Forecast, by Application 2019 & 2032
- Table 73: Colombia Machine Vision Camera Industry Revenue (Million) Forecast, by Application 2019 & 2032
- Table 74: Colombia Machine Vision Camera Industry Volume (K Unit) Forecast, by Application 2019 & 2032
- Table 75: Ecuador Machine Vision Camera Industry Revenue (Million) Forecast, by Application 2019 & 2032
- Table 76: Ecuador Machine Vision Camera Industry Volume (K Unit) Forecast, by Application 2019 & 2032
- Table 77: Venezuela Machine Vision Camera Industry Revenue (Million) Forecast, by Application 2019 & 2032
- Table 78: Venezuela Machine Vision Camera Industry Volume (K Unit) Forecast, by Application 2019 & 2032
- Table 79: Rest of South America Machine Vision Camera Industry Revenue (Million) Forecast, by Application 2019 & 2032
- Table 80: Rest of South America Machine Vision Camera Industry Volume (K Unit) Forecast, by Application 2019 & 2032
- Table 81: Global Machine Vision Camera Industry Revenue Million Forecast, by Country 2019 & 2032
- Table 82: Global Machine Vision Camera Industry Volume K Unit Forecast, by Country 2019 & 2032
- Table 83: United States Machine Vision Camera Industry Revenue (Million) Forecast, by Application 2019 & 2032
- Table 84: United States Machine Vision Camera Industry Volume (K Unit) Forecast, by Application 2019 & 2032
- Table 85: Canada Machine Vision Camera Industry Revenue (Million) Forecast, by Application 2019 & 2032
- Table 86: Canada Machine Vision Camera Industry Volume (K Unit) Forecast, by Application 2019 & 2032
- Table 87: Mexico Machine Vision Camera Industry Revenue (Million) Forecast, by Application 2019 & 2032
- Table 88: Mexico Machine Vision Camera Industry Volume (K Unit) Forecast, by Application 2019 & 2032
- Table 89: Global Machine Vision Camera Industry Revenue Million Forecast, by Country 2019 & 2032
- Table 90: Global Machine Vision Camera Industry Volume K Unit Forecast, by Country 2019 & 2032
- Table 91: United Arab Emirates Machine Vision Camera Industry Revenue (Million) Forecast, by Application 2019 & 2032
- Table 92: United Arab Emirates Machine Vision Camera Industry Volume (K Unit) Forecast, by Application 2019 & 2032
- Table 93: Saudi Arabia Machine Vision Camera Industry Revenue (Million) Forecast, by Application 2019 & 2032
- Table 94: Saudi Arabia Machine Vision Camera Industry Volume (K Unit) Forecast, by Application 2019 & 2032
- Table 95: South Africa Machine Vision Camera Industry Revenue (Million) Forecast, by Application 2019 & 2032
- Table 96: South Africa Machine Vision Camera Industry Volume (K Unit) Forecast, by Application 2019 & 2032
- Table 97: Rest of Middle East and Africa Machine Vision Camera Industry Revenue (Million) Forecast, by Application 2019 & 2032
- Table 98: Rest of Middle East and Africa Machine Vision Camera Industry Volume (K Unit) Forecast, by Application 2019 & 2032
- Table 99: Global Machine Vision Camera Industry Revenue Million Forecast, by Type 2019 & 2032
- Table 100: Global Machine Vision Camera Industry Volume K Unit Forecast, by Type 2019 & 2032
- Table 101: Global Machine Vision Camera Industry Revenue Million Forecast, by End-user Industries 2019 & 2032
- Table 102: Global Machine Vision Camera Industry Volume K Unit Forecast, by End-user Industries 2019 & 2032
- Table 103: Global Machine Vision Camera Industry Revenue Million Forecast, by Country 2019 & 2032
- Table 104: Global Machine Vision Camera Industry Volume K Unit Forecast, by Country 2019 & 2032
- Table 105: Global Machine Vision Camera Industry Revenue Million Forecast, by Type 2019 & 2032
- Table 106: Global Machine Vision Camera Industry Volume K Unit Forecast, by Type 2019 & 2032
- Table 107: Global Machine Vision Camera Industry Revenue Million Forecast, by End-user Industries 2019 & 2032
- Table 108: Global Machine Vision Camera Industry Volume K Unit Forecast, by End-user Industries 2019 & 2032
- Table 109: Global Machine Vision Camera Industry Revenue Million Forecast, by Country 2019 & 2032
- Table 110: Global Machine Vision Camera Industry Volume K Unit Forecast, by Country 2019 & 2032
- Table 111: Global Machine Vision Camera Industry Revenue Million Forecast, by Type 2019 & 2032
- Table 112: Global Machine Vision Camera Industry Volume K Unit Forecast, by Type 2019 & 2032
- Table 113: Global Machine Vision Camera Industry Revenue Million Forecast, by End-user Industries 2019 & 2032
- Table 114: Global Machine Vision Camera Industry Volume K Unit Forecast, by End-user Industries 2019 & 2032
- Table 115: Global Machine Vision Camera Industry Revenue Million Forecast, by Country 2019 & 2032
- Table 116: Global Machine Vision Camera Industry Volume K Unit Forecast, by Country 2019 & 2032
- Table 117: Global Machine Vision Camera Industry Revenue Million Forecast, by Type 2019 & 2032
- Table 118: Global Machine Vision Camera Industry Volume K Unit Forecast, by Type 2019 & 2032
- Table 119: Global Machine Vision Camera Industry Revenue Million Forecast, by End-user Industries 2019 & 2032
- Table 120: Global Machine Vision Camera Industry Volume K Unit Forecast, by End-user Industries 2019 & 2032
- Table 121: Global Machine Vision Camera Industry Revenue Million Forecast, by Country 2019 & 2032
- Table 122: Global Machine Vision Camera Industry Volume K Unit Forecast, by Country 2019 & 2032
Frequently Asked Questions
1. What is the projected Compound Annual Growth Rate (CAGR) of the Machine Vision Camera Industry?
The projected CAGR is approximately 9.00%.
2. Which companies are prominent players in the Machine Vision Camera Industry?
Key companies in the market include Keyence Corporation, Teledyne DALSA Inc, Cognex Corporation, LMI Technologies Inc, SICK AG, Allied Vision Technologies GmbH, National Instruments Corporation, Tordivel AS, Adimec Advanced Image Systems bv, Omron Microscan Systems Inc, Basler AG.
3. What are the main segments of the Machine Vision Camera Industry?
The market segments include Type, End-user Industries.
4. Can you provide details about the market size?
The market size is estimated to be USD XX Million as of 2022.
5. What are some drivers contributing to market growth?
; Increasing Implementation of Advanced Technologies in Industries.
6. What are the notable trends driving market growth?
The Demand from Automotive Industry to Grow Significantly.
7. Are there any restraints impacting market growth?
; Lack of Skilled Labour and Inconsistency in the End-user Requirements/Demands.
8. Can you provide examples of recent developments in the market?
N/A
9. What pricing options are available for accessing the report?
Pricing options include single-user, multi-user, and enterprise licenses priced at USD 4750, USD 5250, and USD 8750 respectively.
10. Is the market size provided in terms of value or volume?
The market size is provided in terms of value, measured in Million and volume, measured in K Unit.
11. Are there any specific market keywords associated with the report?
Yes, the market keyword associated with the report is "Machine Vision Camera Industry," which aids in identifying and referencing the specific market segment covered.
12. How do I determine which pricing option suits my needs best?
The pricing options vary based on user requirements and access needs. Individual users may opt for single-user licenses, while businesses requiring broader access may choose multi-user or enterprise licenses for cost-effective access to the report.
13. Are there any additional resources or data provided in the Machine Vision Camera Industry report?
While the report offers comprehensive insights, it's advisable to review the specific contents or supplementary materials provided to ascertain if additional resources or data are available.
14. How can I stay updated on further developments or reports in the Machine Vision Camera Industry?
To stay informed about further developments, trends, and reports in the Machine Vision Camera Industry, consider subscribing to industry newsletters, following relevant companies and organizations, or regularly checking reputable industry news sources and publications.
Methodology
Step 1 - Identification of Relevant Samples Size from Population Database


Step 2 - Approaches for Defining Global Market Size (Value, Volume* & Price*)

Note*: In applicable scenarios
Step 3 - Data Sources
Primary Research
- Web Analytics
- Survey Reports
- Research Institute
- Latest Research Reports
- Opinion Leaders
Secondary Research
- Annual Reports
- White Paper
- Latest Press Release
- Industry Association
- Paid Database
- Investor Presentations

Step 4 - Data Triangulation
Involves using different sources of information in order to increase the validity of a study
These sources are likely to be stakeholders in a program - participants, other researchers, program staff, other community members, and so on.
Then we put all data in single framework & apply various statistical tools to find out the dynamic on the market.
During the analysis stage, feedback from the stakeholder groups would be compared to determine areas of agreement as well as areas of divergence


